DOI:
10.1039/C9RA04127C
(Paper)
RSC Adv., 2019,
9, 23579-23588
Ozone and ozone/vacuum-UV degradation of diethyl dithiocarbamate collector: kinetics, mineralization, byproducts and pathways†
Received
31st May 2019
, Accepted 24th July 2019
First published on 30th July 2019
Abstract
The diethyl dithiocarbamate (DDC) collector, a precursor of toxic N-nitrosamines, is detected in flotation wastewaters usually at the ppm level. In this study, the O3 and O3/Vacuum-UV (O3/VUV) processes were compared to investigate the efficient removal of DDC with a low risk of N-nitrosamine formation. The results showed that 99.55% of DDC was removed at 20 min by O3/VUV, and the degradation rate constant was 3.99 times higher than that using O3-alone. The C, S and N mineralization extents of DDC using O3/VUV reached 36.36%, 62.69% and 79.76% at 90 min, respectively. O3/VUV achieved a much higher mineralization extent of DDC than O3-alone. After 90 min of degradation, O3/VUV achieved lower residual concentrations of CS2 and H2S, and released lower amounts of gaseous sulfur byproducts compared to O3-alone. The solid phase extraction and gas chromatography-mass spectrometry (SPE/GC–MS) analysis indicated that the main byproducts in O3/VUV degradation of DDC were amide compounds without the detection of N-nitrosamines. The avoidance of N-nitrosamine formation might be attributed to exposure of UV irradiation and enhanced formation of ˙OH radicals in the O3/VUV system. The degradation pathways of DDC were proposed. This work indicated that O3/VUV was an efficient alternative treatment technique for the removal of DDC flotation collector with low risk of N-nitrosamine formation.
1. Introduction
Diethyl dithiocarbamate (DDC), one of the widely used dithiocarbamates (DTCs), has a strong chelating capacity with metal species to generate insoluble and stable metallic complexes.1 Acting as a superior ligand, an extremely large quantity of DDC is used as a flotation collector in mining, as a fungicide in agriculture, and as a functional additive in rubber and lubricants. In the mining industry, to separate base metal sulfides or platinum minerals from ores, the DDC collector can react with mineral surfaces to render them hydrophobic, and subsequently to form stable particle-bubble agglomerates.2,3 In China, the DDC collector even gets a trivial name, SN-9, due to its wide usage in the separation of Cu–Fe and Pb–Zn minerals.4,5 Owing to the ubiquitous applications of DDC in various fields, it has been frequently detected in surface water and municipal wastewater at the ppb level.6
It has been documented that DDC and its N-nitrosamine byproducts are extremely toxic to aquatic animals and human beings. For example, the hydrophobic metallic complexes of DDC can significantly increase the bioaccumulation of heavy metals in Daphnia magna and Rainbow trout.7,8 Moreover, DDC can even affect the biological behaviors of heavy metals accumulated within mice and rats. The metals such as nickel9 and mercury10 can be partly redistributed from traditional metal enriching organs to the brain and adipose tissue of mice. In addition, due to its instability in acidic medium, DDC can be hydrolyzed to diethylamine (DEA) with a rate constant of 9.2 × 10⁻⁴ s−1 with a half-life of 0.2 h at pH 5.11 However, the hydrolysis rate constant of DDC may become as low as 1.0 × 10⁻⁷ s−1 with a half-life of 1905.5 h at pH 9.11 Subsequently, N-nitrosodiethylamine (NDEA) can be generated in drinking water while DEA is oxidized by water disinfection oxidants like Cl2 and O3.11 NDEA is a typical nitrogenous disinfection byproduct with probable cytotoxicity, genotoxicity and carcinogenesis. It has been included in the 3rd version of the Contaminant Candidate List (CCL 3) of the US EPA for drinking water. Based on these facts, DDC is an important indirect precursor of toxic NDEA. Therefore, special attention should be paid for the removal of DDC and its N-nitrosamine byproducts from the aquatic system.
Currently, N-nitrosamines in drinking water and wastewater were of great concern. Some methods including advanced oxidation processes (AOPs),12 integrated membrane system13 and nanoscale zero-valent iron,14 have been developed to remove toxic NDEA. However, the information on how to remove NDEA's precursors such as DDC in aqueous solutions is very limited. This may be attributed to very low concentration (ppb level) of DDC in water because most of the DDC used as fungicides and additives are discharged with a fugitive emission mode.15 Nevertheless, the DDC concentration in the mineral flotation wastewaters is as high as ppm level, e.g., 10–100 mg L−1, because of the high dosage of DDC collector (30–200 g t−1 (ore)) in mining industry.16,17 To avoid toxic effects of DDC collector to aquatic organisms and reduce the release of N-nitrosamines into aquatic system, it is extremely necessary to remove DDC collector with ppm level before the mineral flotation wastewaters are discharged into rivers.
Recently, biodegradation,18,19 ozonation11,20 and chemical oxidation with hypochlorite21 have been investigated to degrade DDC collector. Although the DDC can be removed by the biodegradation, the half-life of DDC biodegradation was as high as 36.96 h.18 The chemical oxidation can rapidly decompose DDC. For instance, 91.28% removal of DDC was achieved even within 1 min using 400 mg L−1 hypochlorite.21 However, it has been reported that the oxidation of DDC with free chlorine and hypochlorite can form N-nitrosamine byproducts.11 In our previous work, 100 mg L−1 of DDC solution was effectively decomposed by the ozonation with the half-life of 10.09 min.20 Nevertheless, the formation of N-nitrosamines is also observed in the ozonation of DDC.11 The degradation of NDEA by O3-alone is usually less effective with a second-rate constant of only 0.08 M−1 S−1, much lower than that of 7 × 10⁸ M−1 S−1 by hydroxyl radicals (˙OH).12,22 Thus, the combined processes such as the O3/H2O2 and O3/UV254nm have been developed to remove NDEA from aquatic system.12,23,24 Therefore, a novel process with a high yield of ˙OH radicals can provide the benefits of effective removal of DDC collector with low risk of N-nitrosamine formation.
In various AOPs, the O3/vacuum-UV (O3/VUV) has the higher yield of ˙OH radicals than O3, O3/UV254nm and O3/H2O2 per mass of oxidants.25 The VUV lamp, namely, low pressure Hg lamp covered with high pure quartz glass, can emit about 10% radiation at 185 nm and 90% radiation at 254 nm. In the O3/VUV system, the 185 nm VUV irradiation of water can in situ generate ˙OH radicals (eqn (1) and (2)). By combining UV254nm light emitted from VUV lamp and dosed O3, the O3/UV254nm can be formed with the generation of ˙OH radicals via eqn (3)–(5). Therefore, three oxidation processes, i.e., VUV photolysis, O3/UV254nm and ozonation, may be included in the O3/VUV system.26 Thus, previous studies had demonstrated that the O3/VUV could achieve much higher removal efficiencies of n-butyl xanthate,24 natural organic matter27 and phenols28 than O3-alone. For the degradation of N-nitrosamines, simple UV254nm photolysis can remove N-nitrosamines effectively due to their strong UV absorption.29,30 Therefore, it can be expected that the degradation of DDC by the O3/VUV would achieve higher removal of DDC with low risk of N-nitrosamine formation than O3-alone.
| | |
H2O + hν185nm → ˙OH + ˙H
| (1) |
| | |
H2O + hν185nm → ˙OH + H+ + eeq−
| (2) |
| | |
O3 + H2O + hν254nm → H2O2 + O2
| (3) |
| | |
H2O2 + 2O3 → 2˙OH + 3O2
| (4) |
| | |
H2O2 + hν254nm → 2˙OH
| (5) |
In this study, the degradation of DDC collector at initial concentration of 100 mg L−1 is compared by the O3 and O3/VUV at low O3 dosage of below 1.27 mg min−1 L−1. The objectives of this work are (1) to compare the removal efficiencies and mineralization extents of DDC by the O3 and O3/VUV; (2) to investigate the generation of CS2 and H2S byproducts; (3) to identify organic byproducts and propose degradation pathways of DDC. This work may be helpful to explore a method to effectively remove DDC collector from mineral flotation wastewaters.
2. Materials and methods
2.1 Chemicals and VUV lamp
Sodium diethyl dithiocarbamate trihydrate (C5H10NS2Na·3H2O) with analytical grade was purchased from Shanghai Aladdin Bio-Chem Technology Co., Ltd, China. Fig. S1 (see in the ESI†) shows the molecular structure of DDC. Other chemicals such as cupric acetate, lead acetate, diethylamine, silver sulfate and mercury sulfate were of analytical grade and purchased from Sinopharm Chemical Reagent Co., Ltd, Beijing, China. Deionized water was used in the degradation experiments. A 40 W VUV lamp was purchased from Bright Star Light & Electricity Co., Ltd, Guangdong, China. The lamp emitted about 10% of 185 nm VUV radiation and 90% of UV254nm radiation (see in Fig. S2†). To conduct the O3/UV254nm and UV254nm photolysis experiments, the UV254nm lamp, with same electric power and size to the VUV lamp, was purchased.
2.2 The degradation procedures
The DDC degradation was conducted in a jacket glass reactor connected with a thermostatic bath. Fig. 1 showed the schematic diagram of experimental setup. The cylindrical reactor had a 1240 mm height and 53 mm internal diameter. The VUV or UV254nm lamp was inserted into a quartz tube installed at the axis of the reactor. Ozone was generated from an O3 generator (SW-004 model, Qingdao West Electronic Purifiers Co., Qingdao, China) using air as the source. The O3 stream was introduced into the reactor through a porous glass plate.
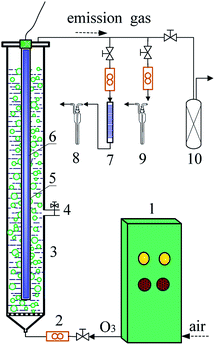 |
| | Fig. 1 Schematic diagram of experimental setup ((1) ozone generator; (2) flow meter; (3) column reactor; (4) sampling valve; (5) quartz tube; (6) VUV lamp; (7) absorbent cotton with lead acetate; (8) CS2 absorption liquid; (9) H2S absorption liquid; (10) activated carbon column). | |
100 mg L−1 of DDC solution was prepared by dissolving 0.265 g DDC with trihydrate in 2 L deionized water. The initial pH was adjusted to 10.0 using 0.05 mol L−1 NaOH or HCl solution. While 2 L of DDC solution was put into the reactor, the ozonation of DDC was conducted by introducing the O3 stream. The O3/VUV and O3/UV254nm degradation of DDC was performed by introducing O3 stream and turning on the VUV and UV254nm lamps, respectively. The O3 dosage rate was controlled to be 0.62–1.27 mg min−1 L−1. To perform the VUV and UV254nm photolysis of DDC, an air stream was introduced at a flow rate of 1.67 L min−1, and the VUV and UV254nm lamps were simultaneously turned on, respectively. In this study, the O3/UV254nm, VUV photolysis and UV254nm photolysis experiments were performed for the comparative purposes. To fully evaluate the mineralization of DDC, the degradation time was extended to 90 min although nearly 100% of DDC could be removed within 20 min. All experiments were conducted at 25 ± 2 °C. Aqueous samples were taken at predetermined time intervals to measure the concentrations of DDC, TOC, SO42− and NO3− anions, respectively.
2.3 Analysis and calculation
2.3.1 Determination of the concentrations of DDC, TOC, SO42− and NO3− ions. The concentration of DDC was determined by a UV-vis spectroscopic method since the DDC had a maximum absorption peak at 256 nm. The absorbance of aqueous samples was recorded at 256 nm by a UV–vis spectrophotometer (UV–5500PC, Shanghai Metash Instruments Co. Ltd, China). The TOC was measured using a Shimadzu TOC–V organic carbon analyzer.The SO42− concentration was analyzed by a barium chromate spectrophotometry method (HJ/T 342–2007). The NO3− concentration was determined by using an ion chromatograph (Metrohm 792 Basic, Switzerland). Anionic species were separated by a Star-Ion A300 anionic column using a carbonate eluting phase consisted of 2.4 mmol L−1 NaHCO3 and 2.5 mmol L−1 Na2CO3 at flow rate of 1 mL min−1.
2.3.2 Analysis of the concentrations of aqueous CS2 and H2S. The aqueous CS2 concentration was measured by a diethylamine cupric acetate spectrophotometric method (GB/T 15504-1995). 50 mL of aqueous sample was purged with a 100 mL min−1 N2 stream for 1 h to volatilize CS2 which was subsequently absorbed with a diethylamine and cupric acetate mixed liquid. Then, the absorbance of CS2 absorption liquid was determined at 430 nm using dehydrated alcohol as a reference solution. The aqueous H2S concentration was determined by an iodometric method (HJ/T 60-2000). The sulfides in the treated DDC solution should be transformed into ZnS by adding Zn(CH3(COO)2) and NaOH solution before the analysis.
2.3.3 Measurement of the amount of gaseous CS2 and H2S emitted into air. The amount of gaseous CS2 emitted into air was measured by a diethylamine spectrophotometric method (GB/T 14680-93). As shown in Fig. 1, the emission gas was allowed to pass through a lead acetate coated cotton tube to remove the H2S, and then introduced into the CS2 absorption liquid. The amount of gaseous H2S was determined by a methylene blue spectrophotometric method (GB/T 11742-89). To collect all of gaseous CS2 and H2S, the emission gas continuously passed through the CS2 and H2S absorption liquid for 90 min, respectively.
2.3.4 SPE/GC-MS analysis of organic byproducts. The solid phase extraction and gas chromatography-mass spectrometry (SPE/GC-MS) was developed to determine organic byproducts in the O3/VUV degradation of DDC. The SPE 24-port vacuum manifold system (Phenomenex, U.S.) was used to extract byproducts from water. The Strata™-X (10 g, code: 8B–S029-MFF, Phenomenex) was employed as the SPE sorbent. Firstly, the SPE cartridges were preconditioned with 2 mL of acetonitrile, followed by 1 mL of ultrapure water. Afterwards, 50 mL of acidified samples were allowed to pass through the cartridges at a flow rate of 3 mL min−1. Then, the cartridges were rinsed with 5 mL ultrapure water, and further dried under vacuum for 10 min to removal residual water. The analytes were eluted with 3 mL of acetonitrile. The organic extracts were transferred into 300 μL GC vials for analysis.The SPE extracts were analyzed by the GC-MS (Shimadzu, GCMS–QP2010 SE, Japan), equipped with a capillary column (Zebron ZB–FFAP, 30 m × 0.32 mm × 0.25 μm, Phenomenex, U.S.). The oven temperature program was as follow: an initial oven temperature was 80 °C (held for 5 min), then increased to 220 °C (held for 10 min) at 8 °C min−1, and finally increased to 300 °C (held for 1 min) at 30 °C min−1. High purity He gas (purity ≥ 99.999%) was used as carrier gas at flow rate of 1 mL min−1. The ion source of mass spectra was operated in the electron impact mode (EI mode, electron energy 70 eV, 220 °C). Full-scan mass (m/z 40–500) was recorded to identify organic byproducts. According to fragmentation rules of organic species under electron ionization conditions, the byproducts were identified by comparing mass spectra with National Institute of Standards and Technology (NIST) mass spectral library data.
3. Results and discussion
3.1 Degradation of DDC by the O3, UV254nm, VUV, O3/UV254nm and O3/VUV
The degradation performances of DDC by the O3, UV254nm, VUV, O3/UV254nm and O3/VUV processes were compared, and the results are shown in Fig. 2 and listed in Table 1. The O3 dosage rate was 1.16 mg min−1 L−1 and initial pH of DDC solution was 10.0. In this work, the removal of DDC by O3, UV254nm, VUV, O3/UV254nm and O3/VUV could be described with a pseudo-first order kinetic equation (eqn (6)),where, C and C0 (mg L−1) were the DDC concentration at degradation time t and initial, respectively, kapp (min−1) was the pseudo-first order rate constant, and t (min) was degradation time.
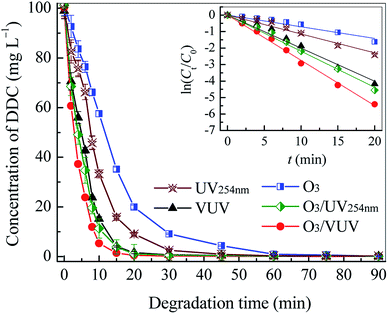 |
| | Fig. 2 The variations of DDC concentration with degradation time in the O3, UV254nm, VUV, O3/UV254nm and O3/VUV process. The inset figure was the pseudo-first-order kinetic fitting of ln(C/C0) versus time t. | |
Table 1 The removal efficiency at 20 min, degradation rate constant (kapp), half-life (t1/2) and correlation coefficient (R2) in the degradation of DDC by the O3, UV254nm, VUV, O3/UV254nm and O3/VUV, respectively
| Process |
Removal efficiency at 20 min (%) |
kapp (min−1) |
t1/2 (min) |
R2 |
| O3 |
80.25 |
0.0687 |
10.09 |
0.992 |
| UV254nm |
90.96 |
0.115 |
6.03 |
0.984 |
| VUV |
98.45 |
0.201 |
3.45 |
0.991 |
| O3/UV254nm |
98.94 |
0.219 |
3.17 |
0.996 |
| O3/VUV |
99.55 |
0.274 |
2.53 |
0.998 |
As shown in Fig. 2 and Table 1, the UV254nm photolysis had achieved the higher DDC removal and larger degradation rate constant (kapp) than O3-alone. It seemed that the DDC could be readily degraded by absorbing UV radiation. As indicated in our previous work, the DDC had a maximum UV absorption at 256 nm.20 Thus, the degradation may be initiated by exciting DDC molecules with the absorption of UV254nm light. As given in Table 1, the kapp obtained by VUV photolysis was 1.75 times higher than that by UV254nm photolysis, revealing that ˙OH radicals generated by 185 nm VUV irradiation of H2O (eqn (1) and (2)) had promoted the DDC degradation.31 However, it should be noted that the degradation initiated by direct absorption of UV radiation (UV254nm and 185 nm VUV) was still the main mechanism for the DDC removal in the VUV photolysis.
The kapp achieved by the O3/UV254nm was 0.219 min−1, much higher than that by UV254nm photolysis and O3-alone, respectively. As mentioned above, the UV254nm photolysis of dissolved O3 can yield H2O2, which in turn reacts with O3 or UV254nm radiation to generate ˙OH radicals as specified in eqn (3)–(5).32 The formation of ˙OH radicals plays a key role in DDC degradation by the O3/UV254nm. In this case, the O3/UV254nm could be also formed in the O3/VUV system by combining dosed O3 and UV254nm radiation emitted from the VUV lamp. As given in Table 1, the O3/UV254nm and VUV photolysis had achieved much higher kapp value compared to O3-alone, revealing that two former processes were main mechanisms for the DDC removal in the O3/VUV system.
For all processes tested, the O3/VUV could achieve the highest degradation rate of DDC. Specially, the kapp obtained by the O3/VUV was 3.99 times higher than that by O3-alone. Since the UV254nm and VUV lamps used in this work had same electric power, the O3/VUV and O3/UV254nm had same energy consumption in DDC removal. However, it can be seen that the O3/VUV had the higher DDC degradation rate as given in Table 1. Consequently, it was quite evident that the O3/VUV was more suitable for the DDC removal compared to the O3/UV254nm. In the previous biodegradation of DDC, the degradation rate constant of 0.45 day−1 (3.125 × 10⁻⁴ min−1) was reported, suggesting that the removal of DDC by the biodegradation was extremely low.18 Although the DDC was found to be effectively oxidized by hypochlorite, the high dosage of hypochlorite, for example 400 g L−1, might result in potential secondary pollution of free chlorite and high process cost.21 Based on above results, it was considered that the O3/VUV could be used to remove high concentration DDC collector from flotation wastewaters with fast reaction kinetics.
3.2 Effect of O3 dosage
The O3 dosage is one of key parameters for O3-based AOPs. It determines both the removal efficiency of pollutants and the treatment cost. In this work, the O3 dosage rate was chosen to be as low as 0.62–1.27 mg min−1 L−1 to investigate the removal of DDC by the O3/VUV. As shown in Fig. 3, when the O3 dosage rate increased from 0.62 to 1.27 mg min−1 L−1, the kapp for the O3 and O3/VUV rose from 0.0199 to 0.0826 min−1 and from 0.211 to 0.308 min−1, respectively. These results indicate that the DDC degradation could be significantly enhanced at higher O3 dosage. It can be attributed to the higher yield of ˙OH radicals by combining O3 and UV254nm radiation together. However, as shown in Fig. 3, the kapp obtained by VUV photolysis had reached 0.201 min−1, much higher than that (0.0826 min−1) by O3-alone even at the highest O3 dosage rate of 1.27 mg min−1 L−1. As discussed above, the O3/UV254nm and VUV photolysis were two main mechanisms for DDC removal in the O3/VUV system. Thus, the O3/VUV in this case can achieve high efficiency of DDC removal even at low O3 dosage.
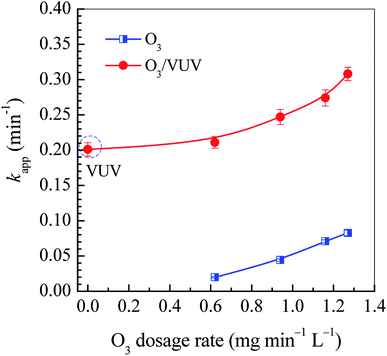 |
| | Fig. 3 The rate constants (kapp) in the O3 and O3/VUV degradation of DDC. | |
3.3 Mineralization of C, S and N elements of DDC
As shown in Fig. S1 (see in the ESI†), the DDC molecule contains functional S and N atoms. Thus, inorganic anions such as SO42− and NO3− may be generated in the degradation of DDC.20 As shown in Fig. 4, the ion chromatographic analysis exhibited that both sulfate (SO42−) and nitrate (NO3−) anions were generated after the oxidation of DDC by the O3 and O3/VUV, respectively. Other ionic species such as SO32−, S2O32− and NO2− were not detected, suggesting that these species with low valences of S and N were further oxidized into SO42− and NO3− anions.33,34 It well demonstrated that the complete mineralization of DDC was feasible for both the O3 and O3/VUV process. However, as shown in Fig. 4, the O3/VUV obtained higher peak intensity of either SO42− or NO3− anion than O3-alone, indicating more SO42− and NO3− anions were accumulated in the O3/VUV system.
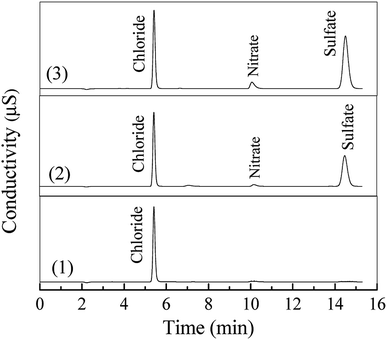 |
| | Fig. 4 Ion chromatographic analysis of 100 mg L−1 DDC solution treated at 0 min (1), 90 min by the O3 (2) and O3/VUV process (3). | |
Fig. 5 showed the relative concentrations of DDC and TOC, and the changes of SO42− and NO3− concentrations. The concentrations of TOC, SO42− and NO3− at 90 min were also presented in Table 2. As shown in Fig. 5, with the rapid decrease of the C/C0 of DDC, the TOC/TOC0 was also reduced with the increase of SO42− and NO3− concentrations, revealing the C, S and N elements of DDC could be mineralized by the O3, VUV and O3/VUV, respectively. However, as given in Table 2, the O3/VUV obtained higher concentrations of SO42− and NO3− anions with lower TOC at 90 min than O3-alone and VUV photolysis.
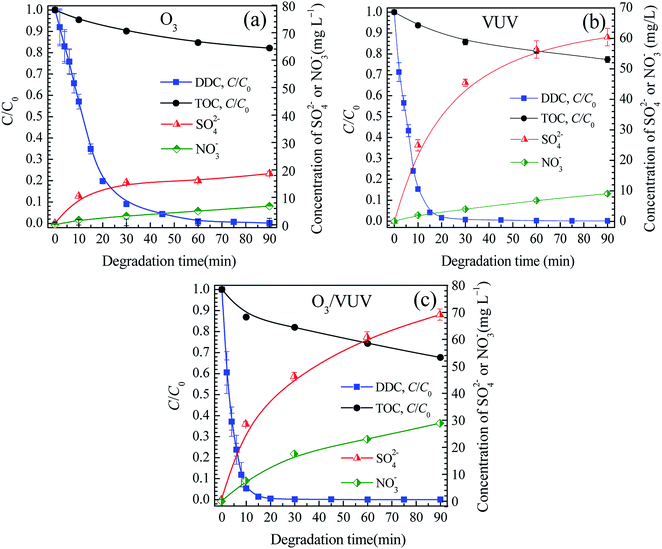 |
| | Fig. 5 The relative concentrations of DDC and TOC, and changes of SO42− and NO3− concentrations in the O3 (a), VUV (b) and O3/VUV (c) degradation of DDC. | |
Table 2 The concentrations of TOC, SO42−, and NO3− anions at 90 min and the mineralization extents of C, S and N elements of DDC by the O3, VUV and O3/VUV, respectively
| Process |
Concentration (mg L−1) |
Mineralization extent (%) |
| TOC |
SO42− |
NO3− |
C |
S |
N |
| O3 |
54.91 |
18.66 |
6.82 |
18.85 |
16.91 |
18.81 |
| VUV |
51.67 |
60.42 |
9.07 |
24.45 |
57.69 |
25.02 |
| O3/VUV |
45.21 |
69.18 |
28.92 |
32.36 |
62.69 |
79.76 |
In this work, to quantitatively describe the mineralization of DDC, the mineralization extents of C, S and N elements were calculated. The mineralization extent of C was expressed by eqn (7),20
| |
 | (7) |
where,
γC was the mineralization extent of C, TOC
0 and TOC were the TOC of DDC solution at initial and 90 min, respectively. The mineralization extent of S or N element was defined by
eqn (8):
| |
 | (8) |
where,
γ was the mineralization extent of S (
γS) or N (
γN) element of DDC,
n was the number of S or N atom of DDC,
Manion was the relative molecular weight of SO
42− or NO
3− anion,
Canion (mg L
−1) was the concentration of SO
42− or NO
3− at 90 min, and
C0 (mg L
−1) was initial concentration of DDC. The mineralization extents of C, S and N elements were summarized in
Table 2. It can be found that the
γC,
γS and
γN at 90 min obtained by the O
3/VUV were 1.72, 3.71 and 4.24 times higher than that by O
3-alone, respectively. The higher extents of mineralization well revealed that both DDC and its byproducts were removed by the O
3/VUV with higher degradation rates compared to O
3-alone. However, in this work, the VUV photolysis achieved the higher mineralization extents of C, S and N elements of DDC than O
3-alone at the O
3 dosage rate of 1.16 mg min
−1 L
−1, revealing that the VUV photolysis had made great contribution in further degradation of various byproducts for the O
3/VUV process. As mentioned above, the O
3/UV
254nm, VUV photolysis and the ozonation could be responsible for the generation of ˙OH radicals in the O
3/VUV system. Thus the O
3/VUV could obtain higher yields of oxidative species than O
3-alone at same O
3 dosage. As listed in
Table 2, the mineralization extent of C, S and N elements by the O
3/VUV increased as following:
γC <
γS <
γN. The results suggested that the S and N elements of DDC were relatively easier to be mineralized compared to C element. Accordingly, it can be reasonably inferred that some organic byproducts without the S or N element might be accumulated in treated DDC solution.
3.4 Generation of CS2 and H2S byproducts
It has been well documented that sulfur byproducts, such as carbon disulfide (CS2), carbonyl sulfide (COS), hydrogen sulfide (H2S), sulfite (SO32−) and thiosulfate (S2O32−), are generated during the degradation of xanthate collectors by the AOPs.26,33,35,36 In this case, the DDC collector had same functional –CSS− group as the xanthates. Thus, above-mentioned sulfur byproducts might be also generated while the DDC was degraded. However, to the best of our knowledge, there is no report on the formation of sulfur byproducts during the DDC degradation by the AOPs. Because the CS2 and H2S are typical toxic sulfur contaminants, the concentrations of aqueous CS2 and H2S were determined while the DDC was degraded by the O3 and O3/VUV, respectively.37,38 Since both the CS2 and H2S are highly volatile, the amounts of gaseous CS2 and H2S emitted into air were also measured to investigate the emission behaviors of CS2 and H2S from treated DDC solutions.
Fig. 6 showed the concentrations of aqueous CS2 and H2S in the O3 and O3/VUV degradation of DDC, respectively. During the degradation of DDC, the CS2 concentration increased up to a maximum value, and then decreased at longer time for both the O3 and O3/VUV process. At the initial stage, more CS2 was generated by the O3/VUV compared to O3-alone. However, at 90 min, the CS2 concentration was reduced to an extremely low level of 0.10 mg L−1 for the O3/VUV, but was still as high as 0.89 mg L−1 for O3-alone. In general, aqueous H2S concentrations had similar change behaviors to CS2 as shown in Fig. 6(b). Specially, when the H2S concentration by the O3/VUV was decreased after 20 min, it still increased significantly by O3-alone. Therefore, a low H2S concentration of 0.16 mg L−1 for the O3/VUV was obtained, but the H2S concentration was as high as 3.34 mg L−1 for O3-alone after 90 min of DDC degradation. Consequently, although sulfur byproducts could be further oxidized by the O3 and O3/VUV, the O3/VUV achieved much lower residual concentrations of CS2 and H2S, attributing to the enhanced yields of ˙OH radicals in the O3/VUV system.
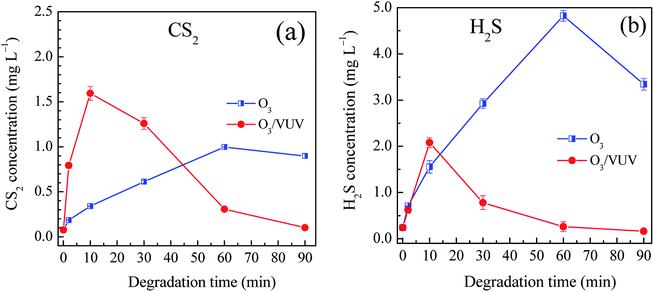 |
| | Fig. 6 The concentrations of aqueous CS2 (a) and H2S (b) byproducts in the O3 and O3/VUV degradation of DDC, respectively. | |
Fig. 7 depicts the amounts of gaseous CS2 and H2S emitted into air. The amount of emitted CS2 for the O3/VUV was slightly higher than that for O3-alone. As the CS2 was a volatile contaminant, the higher concentration of aqueous CS2 at initial stage (Fig. 6(a)) would release more CS2 into gas phase in the O3/VUV system. As shown in Fig. 7, the amount of emitted H2S for O3-alone was 12.24 times higher than that for the O3/VUV. The results were well in accordance with much higher concentration of aqueous H2S for O3-alone as indicated in Fig. 6(b). By considering the emission of CS2 and H2S together, the amount of emitted CS2 and H2S for the O3/VUV was just 0.685 mg, much lower than that (2.949 mg) for O3-alone. In summary, in comparison with O3-alone, the O3/VUV achieved lower aqueous concentrations and less emitted amounts of sulfur byproducts (CS2 and H2S) during the degradation of DDC. The result revealed that the release of toxic CS2 and H2S could be inhibited by the O3/VUV degradation of DDC.
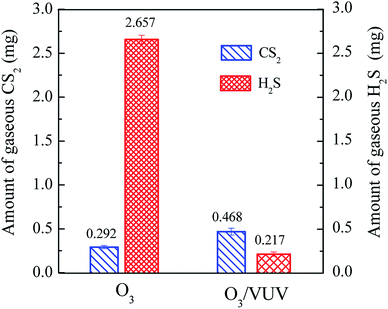 |
| | Fig. 7 The amounts of gaseous CS2 and H2S emitted into air for 90 min in the O3 and O3/VUV degradation of DDC. | |
3.5 Byproducts identified by SPE/GC-MS
To better understand the degradation mechanism of DDC, the SPE/GC-MS analysis was employed to identify organic byproducts generated in the O3/VUV degradation of DDC. All the peaks with a response on mass spectrometry were marked in Fig. 8. Identified byproducts were summarized in Tables 3 and 4 with retention time and other special characteristics. The mass spectrums of identified byproducts were shown in Fig. S3 (see in the ESI†).
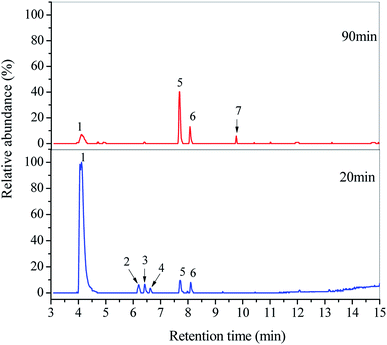 |
| | Fig. 8 GC-MS total ion chromatograms of DDC solutions treated at 20 and 90 min in the O3/VUV degradation of DDC. | |
Table 3 GC-MS retention time and special characteristics of identified byproducts in the O3/VUV degradation of DDC at 20 min
| No. |
Molecular formula |
Compounds |
Retention time (min) |
Similarity (%) |
Main characteristic ions (m/z) |
| 1 |
C5H11NO |
N,N-diethylformamide |
4.099 |
99 |
58, 72, 86, 101, 102 |
| 2 |
C4H9NO |
N,N-dimethylacetamide |
6.185 |
91 |
58, 72, 73, 87 |
| 3 |
C4H9NO |
N-ethylacetamide |
6.406 |
96 |
72, 87 |
| 4 |
C3H7NO |
N-methylacetamide |
6.607 |
97 |
58, 73 |
| 5 |
C5H8N2O2 |
5,6-Dihydro thymine |
7.697 |
99 |
127, 128, 129 |
| 6 |
C3H5NO2 |
N-formyl-N-methylformamide |
8.084 |
98 |
59, 87 |
Table 4 GC-MS retention time and special characteristics of identified byproducts in the O3/VUV degradation of DDC at 90 min
| No. |
Molecular formula |
Compounds |
Retention time (min) |
Similarity (%) |
Main characteristic ions (m/z) |
| 1 |
C5H11NO |
N,N-diethylformamide |
4.101 |
96 |
57, 58, 86, 101 |
| 5 |
C5H8N2O2 |
5,6-Dihydro thymine |
7.692 |
95 |
102, 127, 128, 129 |
| 6 |
C3H5NO2 |
N-formyl-N-methylformamide |
8.075 |
99 |
59, 87 |
| 7 |
C4H7NO2 |
Diacetamide |
9.767 |
94 |
59, 60, 73 |
As shown in Fig. 8 and Table 3, six amide byproducts were detected at 20 min, and the N,N-diethylformamide (peak 1) was the main byproduct of DDC degradation. Since the removal of DDC at 20 min had reached 99.85% as given in Table 1, the DDC was not detected. By extending the degradation time from 20 to 90 min, the relative abundance of N,N-diethylformamide (peak 1) was remarkably decreased. Meanwhile, the peaks of N,N-dimethylacetamide (peak 2), N-ethylacetamide (peak 3) and N-methylacetamide (peak 4) disappeared completely. The results indicated the further decomposition of these amines by the O3/VUV. Nevertheless, the relative abundance of 5,6-dihydro thymine (peak 5) and N-formyl-N-methylformamide (peak 6) increased, and the diacetamide (peak 7) appeared as shown in Fig. 8. Because almost 100% removal of DDC was achieved after 20 min, these three amides should be generated from certain intermediates. Consequently, the number of organic byproducts of DDC could be reduced by extending the reaction time.
In this work, main byproducts in the O3/VUV degradation of DDC were amide compounds without the generation of N-nitrosamines such as NDEA. However, the formation of NDEA was previously observed in the oxidation of DDC with Cl2, NaClO2 and O3, respectively.11 In the O3/VUV degradation of DDC, two mechanisms, i.e., UV photolysis and enhanced ˙OH radical formation, may contribute to the inhibition of N-nitrosamine formation. Because N-nitrosamines have a strong UV absorption via the homolytic cleavage of the N–N bond, the UV photolysis was proved to degrade N-nitrosamines effectively through N–N bond fission.29,39 The rate constant for NDEA degradation under UV irradiation reached 2.60 × 10⁻² and 1.62 × 10⁻³ mmol L−1 min−1 at pH 6.0 and 10.0, respectively.39 In this O3/VUV system, the UV (UV254nm + 185 nm VUV) photolysis may promote to the degradation of possibly generated N-nitrosamines.
Previous studies had concluded that an oxidation system with the higher yield of ˙OH radicals could achieve higher degradation rate of NDEA.23,24 For instances, compared to O3-alone, the UV/O3 could inhibit the regeneration of NDEA effectively via the interaction of NDEA and ˙OH radicals.23,24 As mentioned above, the rate constant of NDEA degradation with ˙OH radicals is nearly 9 orders higher than that with the O3.22 Therefore, ˙OH radicals are the key oxidant for NDEA degradation. In this case, three mechanisms, i.e., the ozonation, VUV photolysis and O3/UV254nm, had made contributions to the formation of ˙OH radicals in the O3/VUV system, resulting in much higher yield of ˙OH radicals compared to O3-alone. Therefore, the degradation of possible N-nitrosamines would be enhanced, and the N-nitrosamine formation was inhibited by the O3/VUV.
3.6 Possible degradation pathways of DDC by the O3/VUV
In this work, the degradation pathways of DDC by the O3/VUV were proposed as shown in Fig. 9. The degradation of DDC may have three pathways. As shown in Fig. 8, the N,N-diethylformamide was the primary byproduct of DDC degradation. Therefore, the main pathway (pathway 1) may be the oxidation of the –CSS− group of DDC into –CHO group to form the N,N-diethylformamide. Simultaneously, the S2− ions are released (eqn (9)). Another two pathways of DDC degradation may be related to the generation of the diethylamine (DEA). Although the DEA was not detected by SPE/GC-MS, the formation of DEA was previously reported through the hydrolysis or the oxidation of DDC.11 As mentioned above, the DDC can be easily hydrolyzed to DEA with the release of CS2 (eqn (10)).40 But the hydrolysis of DDC can be inhibited in alkaline pH. For example, the hydrolysis rate constant of DDC at pH 5 is 9.2 × 10⁻⁴ s−1, but the rate constant at pH 9 is remarkably reduced to 1.0 × 10⁻⁷ s−1.11 In this work, initial pH of DDC solution was 10.0, meaning that the DEA formation from the hydrolysis of DDC (pathway 2) may be low efficient. Thus, the yield of DEA (pathway 3) should be mainly attributed to the breaking of N–C bond of DDC by ˙OH radicals (eqn (11)).| | |
(CH3CH2)2NCSS− + ˙OH → (CH3CH2)2NCHO + S2−
| (9) |
| | |
Hydrolysis: (CH3CH2)2NCSS− → (CH3CH2)2NH + CS2
| (10) |
| | |
Oxidation: (CH3CH2)2NCSS− + ˙OH → (CH3CH2)2NH + CS2
| (11) |
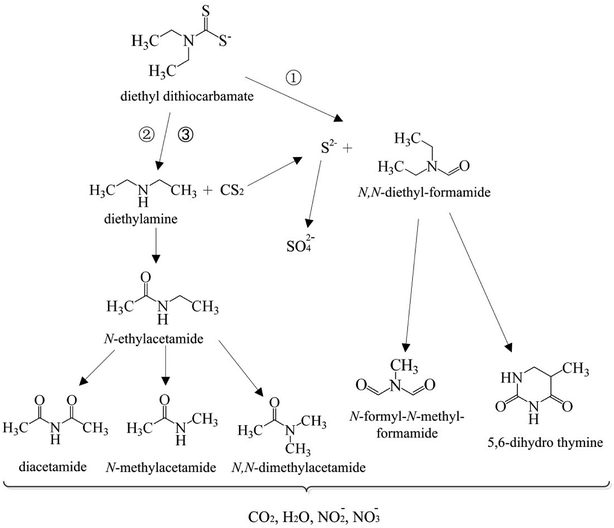 |
| | Fig. 9 Proposed degradation pathways of DDC by the O3/VUV process. | |
The DEA can be effectively oxidized by ˙OH radicals.41,42 The H-atom abstraction by ˙OH radicals from –NH and CH2 groups of DEA may occur (eqn (12) and (13)).41 The N-ethylacetamide may be generated from eqn (13) and (14). Then, the N-ethylacetamide can be further oxidized to diacetamide, N-methylacetamide and N,N-dimethylacetamide. As shown in Fig. 8, the relative abundance of 5,6-dihydro thymine and N-formyl-N-methyl formamide increased with the degradation of the N,N-diethyl formamide while the degradation time rose from 20 to 90 min. Therefore, the 5,6-dihydro thymine and N-formyl-N-methyl formamide may be generated from the degradation of N,N-diethylformamide. Finally, these amide compounds can be completely mineralized to CO2, H2O, NO2−, and NO3− anions by ˙OH radicals.
| | |
(CH3CH2)2NH + ˙OH → (CH3CH2)2N˙ + H2O
| (12) |
| | |
(CH3CH2)2NH + ˙OH → (CH3CH2)NHC˙HCH3 + H2O
| (13) |
| | |
(CH3CH2)NHC˙HCH3 + ˙O → (CH3CH2)NHCHOCH3
| (14) |
The CS2 byproduct generated via eqn (10) and (11) can react with ˙OH radicals to produce dithiocarbonate ions (˙CS2OH) (eqn (15)).43 Subsequently, the ˙CS2OH is decomposed instantaneously to produce hydrogen sulfide radicals (˙HS) and carbonyl sulfide (COS) (eqn (16)).44 The aqueous COS may be hydrolyzed to produce hydrogen sulfide (H2S) (eqn (17)).45 Then, S2− species generated from eqn (9) and (17) were further oxidized into SO42− anions (eqn (18)).46 The decreased concentrations of aqueous CS2 and H2S well demonstrated the oxidation of CS2 and H2S in the O3/VUV system.
| | |
COS + H2O → H2S + CO2
| (17) |
| | |
S2− + ˙OH → SO42− + H2O
| (18) |
4. Conclusions
The degradation of DDC collector with initial concentration of 100 mg L−1 was performed by the O3 and O3/VUV process, respectively. Compared to O3-alone, the O3/VUV achieved higher removal efficiency and mineralization extents of DDC. The rate constant of DDC degradation by the O3/VUV was 3.99 times higher than that by O3-alone. For the O3/VUV, the removal of DDC reached 99.55% at 20 min, and the mineralization extents of C, S and N elements reached 36.36%, 62.69% and 79.76% at 90 min, respectively. In the O3/VUV system, the O3/UV254nm and VUV photolysis were two main mechanisms for DDC removal. At the end of degradation (90 min), the residual concentrations of aqueous CS2 and H2S were reduced to 0.10 and 0.16 mg L−1 for the O3/VUV, but were still as high as 0.89 and 3.34 mg L−1 for O3-alone, respectively. Simultaneously, the O3/VUV released lower amount of gaseous CS2 and H2S. The results indicated that the O3/VUV could inhibit the release of CS2 and H2S byproducts in the degradation of DDC.
Main byproducts in the O3/VUV degradation of DDC were amide compounds such as N,N-diethylformamide. There were no N-nitrosamines such as NDEA detected by SPE/GC-MS, which may be attributed to UV (UV254nm + 185 nm VUV) photolysis and enhanced formation of ˙OH radicals in the O3/VUV system. Furthermore, the degradation pathways of DDC were proposed. The results suggested that the O3/VUV was very effective in the removal of DDC collector from mineral flotation wastewaters with low risk of N-nitrosamine formation.
Conflicts of interest
There are no conflicts to declare.
Acknowledgements
This work was supported by the National Natural Science Foundation of China (grant number: 51674017). The authors would greatly appreciate the Experiment Center in School of Metallurgical and Ecological Engineering, University of Science and Technology Beijing for providing the SPE/GC-MS analysis.
References
- S. Kanchi, P. Singh and K. Bisetty, Arabian J. Chem., 2014, 7, 11–25 CrossRef CAS.
- L. Kloppers, W. Maree, O. Oyekola and G. Hangon, Miner. Eng., 2016, 87, 54–58 CrossRef CAS.
- J. Taguta, C. T. O'Connor and B. McFadzean, Miner. Eng., 2018, 119, 99–104 CrossRef CAS.
- X. P. Niu, R. M. Ruan, L. Y. Xia, L. Li, H. Y. Sun, Y. Jia and Q. Y. Tan, Langmuir, 2018, 34, 2716–2724 CrossRef CAS PubMed.
- D. R. Nagaraj and R. S. Farinato, Miner. Eng., 2016, 96–97, 2–14 CrossRef CAS.
- R. Kesari and V. K. Gupta, Talanta, 1998, 45, 1097–1102 CrossRef CAS PubMed.
- J. E. Poldoski, Environ. Sci. Technol., 1980, 14, 735 CrossRef CAS PubMed.
- M. Block and P. Pärt, Aquat. Toxicol., 1986, 8, 295–302 CrossRef CAS.
- A. Oskarsson and H. Tjalve, Arch. Toxicol., 1980, 45, 45–52 CrossRef CAS PubMed.
- J. Aaseth, J. Alexander and A. Wannag, Arch. Toxicol., 1981, 48, 29–39 CrossRef CAS.
- L. P. Padye, J. H. Kim and C. H. Huang, Water Res., 2013, 47, 725–736 CrossRef PubMed.
- H. Mestankova, K. Schirmer, S. Canonica and U. von Gunten, Water Res., 2014, 66, 399–410 CrossRef CAS PubMed.
- H. Takeuchi, N. Yamashita, N. Nakada and H. Tanaka, Int. J. Environ. Res. Public Health, 2018, 15, 1–16 Search PubMed.
- W. F. Wang, J. Wang, Y. L. Guo, C. Y. Zhu, F. Pan, R. J. Wu and C. F. Wang, Sci. Total Environ., 2018, 639, 934–943 CrossRef CAS.
- C. Lee, C. Schmidt, J. Yoon and U. von Gunten, Environ. Sci. Technol., 2007, 41, 2056–2063 CrossRef CAS PubMed.
- B. McFadzean, D. G. Castelyn and C. T. O'Connor, Miner. Eng., 2012, 36–38, 211–218 CrossRef CAS.
- J. Taguta, C. T. O'Connor and B. McFadzean, Miner. Eng., 2017, 110, 145–152 CrossRef CAS.
- S. H. Chen, W. Q. Gong, G. J. Mei, Q. Zhou, C. P. Bai and N. Xu, Miner. Eng., 2011, 24, 953–955 CrossRef CAS.
- S. H. Chen, W. Q. Gong, G. J. Mei, L. Xiong and N. A. Xu, Int. J. Miner. Process., 2011, 101, 112–115 CrossRef CAS.
- P. F. Fu, X. F. Lin, G. Li, Z. H. Chen and H. Peng, Minerals, 2018, 8, 1–15 Search PubMed.
- B. Y. Cui, X. T. Wang, Q. Zhao and W. G. Liu, J. Chem., 2019, 7038015 CAS.
- S. P. Mezyk, W. J. Cooper, K. P. Madden and D. M. Bartels, Environ. Sci. Technol., 2004, 38, 3161–3167 CrossRef CAS PubMed.
- B. B. Xu, Z. L. Chen, F. Qi, J. Ma and F. C. Wu, J. Hazard. Mater., 2009, 168, 108–114 CrossRef CAS PubMed.
- B. B. Xu, Z. L. Chen, F. Qi, J. Ma and F. C. Wu, J. Hazard. Mater., 2010, 179, 976–982 CrossRef CAS.
- M. G. Gonzalez, E. Oliveros, M. Wörner and M. A. Braum, J. Photochem. Photobiol., C, 2004, 5, 225–246 CrossRef CAS.
- P. F. Fu, J. Feng, H. F. Yang and T. W. Yang, Process Saf. Environ. Prot., 2016, 102, 64–70 CrossRef CAS.
- T. Ratpukdi, S. Siripattanakul and E. Khan, Water Res., 2010, 44, 3531–3543 CrossRef CAS PubMed.
- F. J. Beltran, F. J. Rivas and O. Gimeno, J. Chem. Technol. Biotechnol., 2005, 80, 973–984 CrossRef CAS.
- C. Lee, W. Choi, Y. G. Kim and J. Yoon, Environ. Sci. Technol., 2005, 39, 2101–2106 CrossRef CAS PubMed.
- M. H. Plumlee, M. López-Mesas, A. Heidlberger, K. P. Ishida and M. Reinhard, Water Res., 2008, 42, 347–355 CrossRef CAS PubMed.
- N. Quici, M. I. Litter, A. M. Braun and E. Oliveros, J. Photochem. Photobiol., A, 2008, 197, 306–312 CrossRef CAS.
- J. Swietlik, A. Dabrowska, U. Raczyk-Stanislawiak and J. Nawrocki, Water Res., 2004, 38, 547–558 CrossRef CAS PubMed.
- X. H. Chen, Y. H. Hu, H. Peng and X. F. Cao, J. Cent. South Univ., 2015, 22, 495–501 CrossRef CAS.
- W. X. Lin, J. Tian, J. Ren, P. T. Xu, Y. K. Dai, S. Y. Sun and C. Wu, Environ. Sci. Pollut. Res., 2016, 23, 785–792 CrossRef CAS.
- E. Silvester, D. Truccolo and F. P. Hao, J. Chem. Soc., Perkin Trans. 2, 2002, 1562–1571 RSC.
- R. Q. Liu, W. Sun, K. Ouyang, L. M. Zhang and Y. H. Hu, Miner. Eng., 2015, 70, 222–227 CrossRef CAS.
- A. R. Bartholomaeus and V. S. Haritos, Food Chem. Toxicol., 2005, 43, 1687–1701 CrossRef CAS PubMed.
- W. Hugler, C. Acosta and S. Revah, Environ. Prog., 1999, 18, 173–177 CrossRef CAS.
- A. Aqeel, C. J. Kim and H. J. Lim, Int. J. Greenhouse Gas Control, 2017, 64, 194–203 CrossRef CAS.
- K. L. Aspila, V. S. Sastri and C. L. Chakrabarti, Talanta, 1969, 16, 1099–1102 CrossRef CAS PubMed.
- E. C. Tuazon, P. Martin, S. M. Aschmann, J. Arey and R. Atkinson, Int. J. Chem. Kinet., 2011, 43, 631–638 CrossRef CAS.
- I. Barnes, P. Wiesen and M. Gallus, J. Phys. Chem. A, 2016, 120, 8823–8829 CrossRef CAS PubMed.
- H. J. Fang, Q. Y. Bin, Y. Qin, W. B. Dong and H. Q. Hou, Chin. Sci. Bull., 2005, 50, 2832–2835 CAS.
- C. Appaw and Y. G. Adewuyi, J. Hazard. Mater., 2002, 90, 237–249 CrossRef CAS PubMed.
- L. Wang, D. Y. Wu, S. D. Wang and Q. Yuan, J. Environ. Sci., 2008, 20, 436–440 CrossRef CAS.
- A. Kotronarou, G. Mills and M. R. Hoffmann, Environ. Sci. Technol., 1992, 26, 2420–2428 CrossRef CAS.
Footnote |
| † Electronic supplementary information (ESI) available. See DOI: 10.1039/c9ra04127c |
|
| This journal is © The Royal Society of Chemistry 2019 |
Click here to see how this site uses Cookies. View our privacy policy here.  Open Access Article
 *,
Yanhong Ma,
Huifen Yang,
Gen Li and
Xiaofeng Lin


