 Open Access Article
Paper-based microfluidic devices based on 3D network polymer hydrogel for the determination of glucose in human whole blood†
Rong-Yu
He
a,
Hsin-Yi
Tseng
a,
Hsia-An
Lee
a,
Yu-Ci
Liu
a,
Igor O.
Koshevoy
 b,
Sheng-Wei
Pan
*cde and
Mei-Lin
Ho
 *a
*a
aDepartment of Chemistry, Soochow University, No. 70, LinShih Rd., Shih-Lin, Taipei 11102, Taiwan. E-mail: meilin_ho@gm.scu.edu.tw
bDepartment of Chemistry, University of Eastern Finland, 80101, Joensuu, Finland
cDepartment of Chest Medicine, Taipei Veterans General Hospital, Taipei 11217, Taiwan. E-mail: swpan25@gmail.com
dSchool of Medicine, National Yang-Ming University, Taipei 11221, Taiwan
eInstitute of Public Health, National Yang-Ming University, Taipei 11221, Taiwan
First published on 10th October 2019
Abstract
In this study, optical microfluidic paper analytical devices (μPADs) for glucose detection from whole blood samples with a small sample volume (2 μL) have been developed on a single paper. In the proposed method, a mushroom-shaped analytical device contains a sample inlet zone and a detection zone. When blood is dripped onto the inlet region of a μPAD, the plasma diffuses to the detection region. The detection region is implanted with a metallic three-dimensional (3D) polymer hydrogel vehicle. The gel vehicle consists of a copper complex that responds to oxygen changes and glucose oxidase (GOx) immobilized inside the gel as a bioactivity preservative. The phosphorescence of the copper complex is enhanced by oxygen consumed by detection of glucose with a limit of detection (S/N = 3) of 0.44 mM, and the total analysis of the sample is completed within 1 min. The validity of the proposed research is demonstrated using control samples and real-world whole blood samples of glucose concentrations ranging from 3 to 200 mM, and the detection results are shown to be in agreement with those obtained using a glucometer. Attaining a simple device for analysing glucose in human whole blood without any pretreatment procedures and having a broad sensing range while consuming a small sample volume remain challenging; thus, our new analytical device is of great interest.
Introduction
The development of microfluidic analytical devices can have a positive impact on disease diagnosis and patient care.1 Microfluidic devices with paper (μPADs) as a substrate have many attractive properties: a porous structure, capillary action-driven sample flow, low-cost, flexibility, bio-compatibility, and ease of modification.2 These characteristics make paper an ideal platform for point-of-care (POC) with the advantages of high sensitivity, faster analysis time, low-cost, low sample volume, environmental friendliness, flexibility and portability.2 With the development of μPADs, several detection techniques, such as colorimetric change,3,4 electrochemical properties,3 light absorption and emission,5 mass spectrum,6 and surface-enhanced Raman spectroscopy,7,8 have been applied to the fabrication of microfluidic channels on paper substrates.9 Among these methods, the advantages of the luminescence-based detection technique integrated with a paper-based device includes low cost, fast detection times, no need for significant technicians, and high sensitivity.10For many diagnostic tests, blood is the most commonly used human biofluid because it provides the health information of an individual.11 However, it is challenging to analyse blood without pretreatment due to the intrinsic properties of this complex fluid mixture, so blood has not been preferred for use as a test sample in colorimetric or optical detection techniques as compared to blood plasma or serum.12 In addition, blood absorbs at 541 and 577 nm due to the existence of oxy-hemoglobin.13 When the fluorescence detection technique is applied to μPADs, the luminescence from the analytes is absorbed by haemoglobin. On the other hand, the red colour of blood increases the difficulty of precisely quantifying the content of analytes with colorimetric detection techniques. The above characteristics of blood limit the development of μPADs using colorimetric and optical luminescence methodologies. Although some separation methods have been reported to address this problem, such methods also increase the technique complexity and are time-consuming.12
Some research efforts have been invested in whole blood analysis using μPADs. For example, Robinson et al. presented a microfluidic glass capillary and plunger device for semi-quantitative colorimetric determination of phenylalanine. In that device, blood was processed to the plasma separation membrane, and plasma progressed to enzymatic reaction. The resulting products further reacted with a colorimetric component and were converted into a dark-coloured precipitate.14 Noiphung et al. successfully fabricated electrochemical paper-based analytical devices by stacking different types of papers for glucose detection from whole blood samples following plasma isolation.1 Yang et al. developed a μPAD by using red blood cell agglutination with agglutinating antibodies for separating plasma to detect glucose.15 Recently, Tseng et al. presented a 3D μPAD for the determination of human whole blood creatinine by means of an alkaline Jaffé reaction via heating, followed by a colorimetric detection.16
The present study proposes a μPAD for the determination of whole blood glucose concentration with luminescent detection. The method processes a trace blood sample volume (2 μL) without pretreatment procedures. The μPAD is composed of a sample inlet zone to direct plasma to the detection zone on a single piece of glass fibre filter paper to simplify the whole analytical device (Fig. 1). In the detection zone, enzymes (GOx) and luminescent materials, namely [(P3)–Cu–CN–Cu–(P3)] + B(C6H3(CF3)2)4 − (Cu4c, P3 = PPh2C6H4–PPh–C6H4PPh2), are embedded in polyacrylamide hydrogel to form a 3D network luminescent coating, with enzymes as a bioactivity preservative. The glucose takes up oxygen together with the enzymes to form a gluconic acid that accompanies the increase of the emission intensity of the phosphorescent luminophore Cu4c, which is related to the glucose concentration, so it can be used for quantitative analysis of glucose concentration. It is worth noting that most of the luminescent-based sensors are fabricated on substrates by coating them with films in which the luminophores are embedded.17 In contrast, the 3D network luminescent coating exhibits different advantages over the above layer-by-layer sensors, such as (1) a higher multiplexing capacity for luminophores or enzymes, (2) minimal use of encapsulated probes in the coating process, and (3) increased surface area, luminescence intensity or dimensionality. Therefore, they hold promise for a range of electronic, photonic, environmental, biological and biomedical applications.18,19 The optimized glucose sensor shows detection limits of as low as 0.44 mM, and the measurement range is 3–200 mM. Therefore, it can be used to detect glucose in trace amounts of human whole blood without sample pretreatment, and the response time is less than 1 min. We have found that the simplified μPAD has a much wider response range than that of previous reports. Therefore, these types of devices with 3D network coatings are a highly sensitive platform for not only glucose detection in the food industry but also many other types of sensing applications.
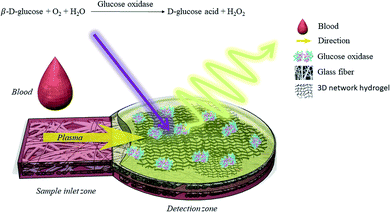 | ||
| Fig. 1 Schematic drawing of the μPAD with 3D luminescent network hydrogel for glucose detection in human blood. | ||
Results and discussion
Characterization of hydrogels, effects of monomer, pH, and buffer solution on luminescence emission intensity of hydrogels
First, enzyme on four hydrogels on paper, sodium polyacrylate, a cross-linked sodium polyacrylate, agar, and a polyacrylamide (PAM) were compared. The prepared samples were loaded in dishes for observation. As shown in Fig. 2(a) and (b), powders of the sodium polyacrylate and cross-linked sodium polyacrylate in buffer solution produced gels whose resulting hydrogels did not easily form thin and homogeneous films that clamped on the paper. Nawaz et al. reported that immobilization with agar gel significantly increases the stability of maltase.20 Hence, the agar gel was produced in accordance with the procedures of Nawaz's work. Agar solution was prepared in buffer solution through heating to boiling. The agar solution was then cooled to 40 °C, and enzyme was added to form a transparent and soft gel on paper (Fig. 2(c)). It was found that when enzyme and luminophore were mixed at 40 °C, the luminescence intensity of the analytical devices decreased, possibly due to enhancement of the emission population through thermal quenching, which decreased the emission intensity. The temperature effect was also reported in lead–iridium heterobimetallic coordination frameworks.21 Acrylamide (AM) under N,N,N′,N′-tetramethylethylenediamine (TEMED) catalysis caused the homolytic scission of the ammonium persulfate (APS), and it was mixed with luminophores and enzyme. A transparent light-yellow gel was formed at room temperature (Fig. 2(d)) to retain the enzyme activity and the emission intensity of the luminophore. From the above, the PAM was chosen as the entrapment support.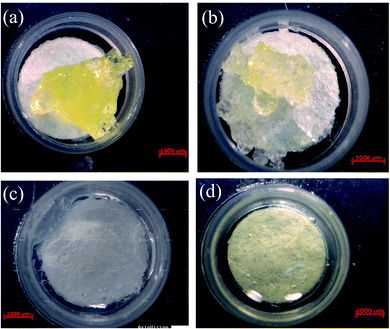 | ||
| Fig. 2 Photographs of four hydrogels on paper: sodium polyacrylate (a), a cross-linked sodium polyacrylate (b), agar (c), and a polyacrylamide (d). The hydrogels contain luminophores and enzyme. | ||
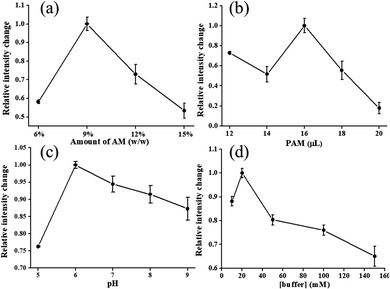
The dependence of luminescence intensity of Cu4c on the concentration and volumes used of monomer AM and PAM, respectively, for hydrogels is depicted in Fig. 3(a) and (b), in which the amount of AM changed from 6% to 15% (wt%). The hydrogels presented a maximum emission intensity when the amount of AM was at 9%. This concentration is within the routine use range of 4–20%, wherein the gel is not too fragile or too brittle to withstand the manipulation required for sensor use.22 A variety of volumes that used 9% PAM for hydrogels are described in Fig. 3(b). From the relative emission intensity, the optimum volume of 16 μL was selected for further tests. In our work, buffer solution was employed as the polymerization solvent and enzyme dissolving solvent simultaneously, and the pH value was in the range of 5 to 9. Free enzyme GOx can operate under a pH range of 4 to 7, but its optimum pH is 5.5. When the enzyme is entrapped in hydrogel to alter the micro-environment of the enzyme, the pH stability can be changed. As shown in Fig. 3(c), PAM has the property of being non-ionic, and it does not respond to changes in pH buffer solutions.23 The maximum emission intensity occurs at pH 6.0, mainly due to the change in the environment of the enzyme. At the same time, the optimum buffer concentration and the concentration of enzyme were found to be 20 mM and 10 mg mL−1, respectively (Fig. 3(d) and S1 in ESI†).
The characterization of luminophore to oxygen
Cu4c was selected as the luminophore in the glucose sensing device in this study because of its high quenching efficiency (KSV), excellent stability and facile preparation procedure. The uniform quenching environment collided with oxygen, and therefore the changes in emission intensity were measured quantitatively to evaluate the oxygen content (vide infra). The luminescence quenching was measured with the Stern–Volmer equation. In eqn (1), the quencher concentration is PO2, the Stern–Volmer constant is KSV, and I0 and I are the measured intensity without and with oxygen present, respectively. After plotting I0/I against PO2, the KSV value of 10.14 was deduced with a collision (dynamic) quenching process (Fig. S2(a and b) in the ESI†). The collision efficiency for oxygen of Cu4c is better than those of [Cu(xantphos)(dmp)]tfpb and [Cu(CN-xylyl)(dbp)]tfpb complexes studied previously.24,25 Although the KSV value is smaller than those of [Cu(2,9-dimethyl-4,7-diphenyl-1,10-phenanthroline)(2,6-dimethylphenylisocyanide)2][B(C6H3(CF3)2)4] and [Cu(2,9-dimethyl-1,10-phenanthroline)(2,6-dimethylphenylisocyanide)2][B(C6H3(CF3)2)4], a uniform environment was identified in Cu4c, which is more suitable for practical quantitative analysis.26 | (1) |
Sensitivity and selectivity
To obtain the quantitative response ability of the analytical devices towards glucose, the emission intensity as a function of glucose was investigated (Fig. S3†). The luminescence intensity of Cu4c gradually increased along with the consumption of oxygen, with the increment of glucose under the oxidation of GOx, and it reached a plateau at a glucose concentration of up to 200 mM (Fig. 4). As can be seen from Fig. 4, the emission intensity was linearly related to the glucose concentration in a range of 3.0 to 200 mM with a correlation coefficient of 0.9962. The linear equation can be expressed as emission intensity change = 387.28 + 5.989 × [glucose]/mM (R2 = 0.9962). The detection limit was estimated to be 0.44 mM according to the ratio of signal to noise at 3 (S/N = 3). Therefore, it can be stated that the analytical device demonstrated a wide response range of sensing based on a 3D network luminescent hydrogel coating. The analytical performance of the analytical device was also compared with those of other reported luminescent glucose sensing devices using gel capping (Table 1).27–34 As shown in Table 1, the proposed method provides detection sensitivity for glucose comparable with those of some reported methods and could meet the requirement for glucose detection in clinical glucose monitoring and the food industry (mM levels).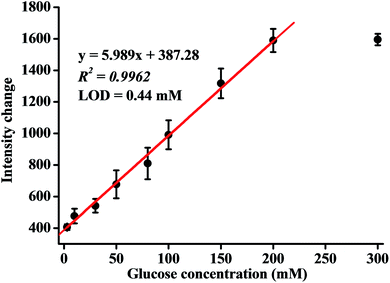 | ||
| Fig. 4 The calibration curve of the analytical device. Error bars represent the SD of three independent experiments. | ||
| Gel-based system/gel | Test sample | Linear range (mM) | LOD (mM) | Response time (s) | Stability (days) | Ref. |
|---|---|---|---|---|---|---|
| a B5 = [(AuC2C6H4OMe)2(Ph2P(C6H4)3PPh2)]. b Ag3 = [Ag(P3)CNAg(P3)][B(C6H3(CF3)2)4] (P3 = PPh2C6H4-PPh-C6H4PPh2 [bis(o-diphenylphosphinophenyl)phenylphosphine]). c CNT = carbon nanotubes; TEOS = tetraethoxysilane. d N.A. = not available. e [Ru(dpp)3][(4-Clph)4B]2 = tris(4,7-diphenyl-1,10-phenanthroline)ruthenium(II)ditetrakis(4-chlorophenyl)borate. f Ru(dpp)3Cl2 = tris(4,7-diphenyl-1,10-phenanthroline)ruthenium dichloride. g GOx-CF = glucose labelled with fluorescein-5(6)-carboxamido-caproic acid N-hydroxysuccinimide ester; TMOS = tetramethoxysilane. | ||||||
| Cu complex/polyacrylamide | Blood | 3.0–200.0 | 0.44 | 15 | >131 | Our work |
| Gel-encapsulated B5a/polyacrylic acid | Plasma and tear | 1.0–50.0 (plasma), 0.1–2.0 (tear) | 0.9 (plasma), 0.08 (tear) | 0.3 (plasma), 0.3 (tear) | 120 | 28 |
| Ag3 on paperb/sodium alginate | Plasma, urine | 1.0–35.0 | 0.9 | 10 | 45 | 27 |
| CNT on basal plane pyrolytic graphite electrode/TEOSc | Serum | 0.5–4.0 | 0.05 | 5 | N.A.d | 29 |
| Ferrocenium hexafluorophosphate/titania sol–gel | Glucose solution | 0.07–15 | 0.07 | 6 | N.A. | 30 |
| [Ru(dpp)3][(4-Clph)4B]2/silica gele | Wine, glucose injections | 0.0–0.6 | 0.058 | 300 | 8 months | 31 |
| Ru(dpp)3Cl2/silica sol–gelf | Glucose solution | 0.1–5 | 0.06 | 1500 | 60 | 32 |
| GOx-CF/TMOSg | Pineapple juice | 0.56–5.56 | N.A. | 1200 | 15 | 33 |
| Optical fibre/TMOS | Glucose solution | Up to 20 | N.A. | 600 | 60 | 34 |
To evaluate the selectivity of glucose detection based on the Cu4c in 3D hydrogel, the spectral responses of the analytical device towards various biologically relevant analytes, including ions, sugars, amino acids, ascorbic acid, uric acid and urea in blood, serum and plasma, were recorded (Fig. S4†). The concentrations of most of the interfering species were 2 to 5000 times greater than those of the normal range in body biofluids. Those of urea and sodium ions in the plasma and serum were 68 mM and <150 mM, respectively, and a concentration of 100 mM was used in this test. Although the amounts of potential interferents were greater than that of glucose (5 mM), only glucose caused a conspicuous change in intensity. To further explore the anti-interference of glucose sensing, a competition test was performed by exposing the 5 mM glucose to all interferents (mix in Fig. S4†). The luminescence change of this sensor to glucose was similar to that of the mixture with the individual interferents, indicating that the proposed analytical device had excellent selectivity over other interfering species.
Detection of human whole blood
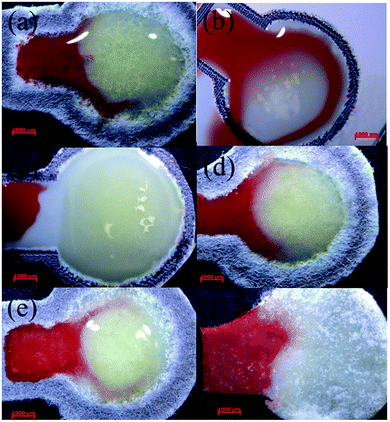
To further demonstrate the applicability of the analytical devices in a practical glucose detection process, whole blood was dropped onto the sample inlet zones of different papers. When fresh blood was applied to the pad based on Whatman filter papers (No. 1, and nitrocellulose membrane with 0.45 μM pore size, Fig. 5(a and b)) and Advantec filter papers (No. 5C and 50, Fig. 5(d and e)) to elute and to deliver the plasma to the detection zone, the plasma flowed to the gel and the gel turned red, making it difficult to judge the readout reliably. The Whatman nitrocellulose membrane filter paper separated plasma from blood with bigger pore sizes (nitrocellulose membrane with 5 μM pore size, Fig. 5(c)). The blood could not flow on the pad because in the filter paper with a larger pore size, the cellulose fibres would swell and constrain the capillary flow.35 When glass fibre filter paper was adopted as the paper material, the glass fibres attracted red blood cells and trapped them within the depths of the papers (Fig. 5(f)) to elute the plasma to the detection zone successfully. Consequently, the glass fibre filter paper was chosen as the base material for the analysis of glucose from human whole blood.In the glucose detection process, the optimum blood volume was also tested. It was found that 2 μL of blood was the most suitable volume and did not exceed the capacity of the present μPAD or cause the plasma to retain its red colour. Furthermore, the delivery times of the blood of persons without diabetes or diabetes patients from the sample inlet zone to the detection zone of the present analytical device was less than 1 minute.
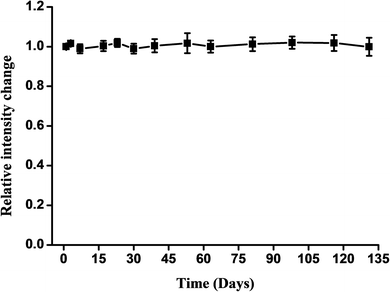
In further experiments, the number of sensors monitored was increased to evaluate the stability of the response to glucose (Fig. 6). All of the sensors could be used within a period of at least 135 days; this sensor retained 95% of its intensity change after 135 days.
The glucose concentrations in whole blood from different patients (one non-diabetic and one type 2 diabetic) were analysed. The detection results were compared with those obtained via a glucometer from Roche (Accu-Chek Active, Dubai, UAE). The blood glucose concentration of the diabetic patient measured by glucometer was 11.74 ± 0.306 mM, and that detected by the proposed method was 11.61 ± 0.277 mM, with an R.S.D. value of 2.38% (Table 2). The blood glucose concentrations of the non-diabetic case were 4.685 ± 0.285 and 4.665 ± 0.132 mM according to the two tests, with an R.S.D. value of 2.83%. Also, from the standard addition method, the delta glucose levels measured in the non-diabetic blood (4 samples with glucose added) were in agreement with the added content, demonstrating that the proposed method was exact (Pearson correlation r = 1.000, p < 0.001).
| Biofluids | Glucose added (mM) | Concentration (mM) | Glucose found (mM) | Recovery (%) | R.S.D.b (%) | |
|---|---|---|---|---|---|---|
| Claimedc value | Proposed methoda | |||||
| a N = 3. b R.S.D.: relative standard deviation. c The glucose concentrations in human blood were measured by using a commercial glucometer from Roche. | ||||||
| Diabetic blood | 11.74 ± 0.306 | 11.61 ± 0.277 | 2.38 | |||
| Non-diabetic blood | 4.685 ± 0.285 | 4.665 ± 0.132 | 2.83 | |||
| Non-diabetic blood | 3 | 3.033 ± 0.099 | 101.1 | 3.26 | ||
| 5 | 4.867 ± 0.102 | 97.3 | 2.10 | |||
| 10 | 9.901 ± 0.073 | 99.0 | 0.74 | |||
| 20 | 20.11 ± 0.862 | 100.6 | 4.29 | |||
Fig. S5† shows the validation plot of measurements using the present method versus the values of glucose measured by glucometer. First, for the 6 samples shown in Table 2, there was no statistical difference between the means of paired measurements (paired t-test, p = 0.455). Second, the glucose values estimated by the two methods were strongly correlated in a linear relationship (Pearson correlation r = 1.000, p < 0.001). As shown in Fig. S5,† the two sets of results were highly correlated and fitted a linear regression line with an equation of Y = 0.965X + 0.335 (p < 0.001). In other words, the paired measurements were in excellent agreement, confirming that the μPAD with 3D luminescent network hydrogel worked well in human whole blood samples.
Conclusions
In this study, we prepared optical μPADs to elute plasma from human whole blood and detect glucose levels by means of a copper complex mixed with a bioactive enzyme in 3D network hydrogel. Luminescent copper complex and enzyme co-doped in polyacrylamide gel were used as the reactor for converting the glucose levels to changes in luminescence intensity. With this approach, the quantification was completed within 1 minute in a single piece of paper with a trace amount of blood and without any pretreatment procedures. When the blood sample was dropped onto the sample inlet zone, the blood moved through the paper. Blood cells were trapped within the depths of the paper matrix, and the glucose in the plasma could reach the detection zone. The developed μPADs have been successfully applied to measure glucose levels in a non-diabetic individual and a patient with diabetes with no significant differences compared to a commercial glucometer. Notably, the μPADs provide a wider quantitative detection range of glucose and can be further applied to monitor food and water contamination. The present device also simplifies the preparation of analytical devices and provides a cost-effective method for rapid detection of glucose in human whole blood.Experimental sections
Materials and instruments
Sodium polyacrylate (Sigma-Aldrich, 95%) and crosslinked sodium polyacrylate (Sigma-Aldrich), agar (Sigma-Aldrich), acrylamide 30% (AM, w/w) (Sigma-Aldrich), N,N,N′,N′-tetramethylethylenediamine (TEMED, Sigma-Aldrich), ammonium persulfate (APS, Sigma-Aldrich, ≥98%), D-glucose (Sigma-Aldrich, 99.5%), glucose oxidase (G2133, Sigma-Aldrich, 195![[thin space (1/6-em)]](https://www.rsc.org/images/entities/char_2009.gif) 700 unit per g), potassium chloride (Sigma-Aldrich, ≥99.5%), sodium chloride (J.T. Baker, 99.8%), magnesium dichloride (Sigma-Aldrich, ≥99.8%), calcium chloride dehydrate (J.T. Baker, ≥99.8%), lactose (Sigma-Aldrich, 99%), D-fructose (Sigma-Aldrich, 99%), maltose (Sigma-Aldrich, 99%), galactose (Sigma-Aldrich, 99%), L-lysine (Sigma-Aldrich, ≥99.8%), L-methionine (Sigma-Aldrich, ≥98.0%), L-phenylalanine (Sigma-Aldrich, ≥98.5%), L-tryptophan (Sigma-Aldrich, ≥98.0%), L-glutathione reduced (GSH, Sigma-Aldrich, ≥98.0%), L-valine (Sigma-Aldrich, ≥99.0%), L-cysteine (Sigma-Aldrich, ≥98.0%), glycine (Sigma-Aldrich, ≥99.7%), L-aspartic acid (Sigma-Aldrich, ≥99%), citric acid (Sigma-Aldrich, 99%), L(+)-ascorbic acid (Sigma-Aldrich, 99%), creatinine (Sigma-Aldrich, ≥98%), urea (Sigma-Aldrich, ≥98%), dichloromethane (DCM, Sigma-Aldrich, 99.8%), and N,N-dimethylformamide (DMF, Sigma-Aldrich, 99.8%) were used as received. Disodium hydrogen phosphate and sodium dihydrogen phosphate were purchased from Merck. Advantec filter paper (No. 5C, 50, and GA-55) was purchased from Toyo Roshi Kaisha Ltd. (Japan). Whatman filter papers (No. 1 and nitrocellulose membrane) were purchased from GE Healthcare sciences (UK). The wax printer used was a XEROX ColorQube 8880 (Norwalk, USA).
700 unit per g), potassium chloride (Sigma-Aldrich, ≥99.5%), sodium chloride (J.T. Baker, 99.8%), magnesium dichloride (Sigma-Aldrich, ≥99.8%), calcium chloride dehydrate (J.T. Baker, ≥99.8%), lactose (Sigma-Aldrich, 99%), D-fructose (Sigma-Aldrich, 99%), maltose (Sigma-Aldrich, 99%), galactose (Sigma-Aldrich, 99%), L-lysine (Sigma-Aldrich, ≥99.8%), L-methionine (Sigma-Aldrich, ≥98.0%), L-phenylalanine (Sigma-Aldrich, ≥98.5%), L-tryptophan (Sigma-Aldrich, ≥98.0%), L-glutathione reduced (GSH, Sigma-Aldrich, ≥98.0%), L-valine (Sigma-Aldrich, ≥99.0%), L-cysteine (Sigma-Aldrich, ≥98.0%), glycine (Sigma-Aldrich, ≥99.7%), L-aspartic acid (Sigma-Aldrich, ≥99%), citric acid (Sigma-Aldrich, 99%), L(+)-ascorbic acid (Sigma-Aldrich, 99%), creatinine (Sigma-Aldrich, ≥98%), urea (Sigma-Aldrich, ≥98%), dichloromethane (DCM, Sigma-Aldrich, 99.8%), and N,N-dimethylformamide (DMF, Sigma-Aldrich, 99.8%) were used as received. Disodium hydrogen phosphate and sodium dihydrogen phosphate were purchased from Merck. Advantec filter paper (No. 5C, 50, and GA-55) was purchased from Toyo Roshi Kaisha Ltd. (Japan). Whatman filter papers (No. 1 and nitrocellulose membrane) were purchased from GE Healthcare sciences (UK). The wax printer used was a XEROX ColorQube 8880 (Norwalk, USA).
Synthesis of Cu4c
P3 ligand36 (100 mg, 0.159 mmol) and CuCN (14 mg, 0.156 mmol) were suspended in dichloromethane (15 mL), and the mixture was stirred for 1 h to give a nearly clear pale yellow-greenish solution. Then a mixture of P3 (100 mg, 0.159 mmol) and [Cu(NCMe)4]CF3SO3 (60 mg, 0.159 mmol) in dichloromethane (15 mL) was added and the stirring continued overnight. The resulting pale-yellow solution was filtered and evaporated to give yellow-green amorphous solid. It was dissolved in dichloromethane (3 mL) and precipitated by adding excess of diethyl ether (223 mg, 90%). The entire amount of this triflate salt was dissolved in dichloromethane (10 mL) and treated with a solution of Na[B(C6H3(CF3)2)4] (130 mg, 147 mmol) in diethyl ether (10 mL). The opaque mixture was stirred for 2 h and then evaporated, and the product was extracted with diethyl ether (3 × 8 mL). The extracts were filtered, concentrated to ca. 8 mL and diluted with an equal volume of hexanes. Slow evaporation of this mixture produced pale greenish microcrystalline solid, which was washed with pentane and vacuum dried (254 mg, 79%). The 31P{1H} NMR spectrum was identical to that for previously reported triflate precursor.3631P{1H} NMR (CD2Cl2; 298 K; δ): 4.5 (2P), 1.8 (1P), J(P–P) = 128 Hz AB2 system 1; −1.2 (br, 2P), −8.0 (br, 1P), J(P–P) = 145 Hz AB2 system 2. Anal. calcd for C117H78Cu2BF24NP6: C, 61.70; H, 3.45; N, 0.62. Found: C, 62.03; H, 3.61; N, 0.55.The measurement of oxygen collision efficiency
The oxygen collision efficiency measurement procedures were similar to those in our previous report.27 10 μL of Cu4c (1 mM) in DCM was added to the filter paper, and the films were used for oxygen collision efficiency measurement. The prepared films were then placed into the Linkam FTIR600 stage, and N2 (99.999%) and O2 (99.999%) were mixed at different concentrations via mass flow controllers and passed to a Linkam FTIR600 stage. The output flow rate of the gas mixture was maintained at 600 mL min−1. Photoluminescence experiments were carried out by using a 406 nm LED source as an excitation light, and the emission was further filtered by a long-wavelength-pass filter (3RD420LP, Omega Optical) before detection by a sensitive charge coupled detector (CCD, Princeton Instruments, PI-MAX). Spectral responses obtained at 0.0, 0.167, 0.333, 0.500, 0.667, 0.833 and 1.0 mole fraction of O2 in N2 were used for the Stern–Volmer plot.Microfluidic device design
Advantec filter papers, Whatman grade 1 qualitative filter paper and nitrocellulose membrane filter papers, and Advantec glass fibre filters were tested. The microfluidic device was fabricated by using wax printed technique.37 A ColorQube 8880 printer was used to pattern wax barriers on all type of filter papers except the Advantec glass fibre filter. The wax pattern was designed as a mushroom shape having a sampling site in a square shape (with an edge of 0.4 cm) as the sample inlet zone to direct plasma to the circular detection zone with a diameter of 0.8 cm. The printed patterns were heated at 150 °C for 3 min on a hot plate to produce hydrophobic barriers. To prevent the sample leaking from the paper during sample loading and migration, the back side of the paper was covered with tape. The analytical device was designed as illustrated in Fig. 1.Synthesis of different hydrogels and addition to the analytical devices
First, the enzyme GOx (10 mg) was dissolved in 1 mL PBS buffer. 0.71 mg Cu4c in DMF (5 μL) was mixed with 350 μL of enzyme solution to produce the resulting solution. The enzyme was immobilized in sodium polyacrylate and cross-linked sodium polyacrylate by weighing 1.5 mg of sodium polyacrylate and cross-linked sodium polyacrylate, respectively, into paper devices, then adding 10 μL of the resulting solution to produce sodium polyacrylate and cross-linked sodium polyacrylate hydrogels.Agar hydrogel was prepared by adding 25 mg agar into 1 mL ddH2O. The solution was heated to boiling, and then a gentle boil was maintained until the solution is completely dissolved. Afterward, the enzyme solution was mixed with agar solution in the ratio of 1![[thin space (1/6-em)]](https://www.rsc.org/images/entities/char_2009.gif) :
:![[thin space (1/6-em)]](https://www.rsc.org/images/entities/char_2009.gif) 1 (v/v, 2 mL) at 40 °C and mixed with 10 μL of Cu4c solution. Last, the 10 μL of final solution was added to the filter paper to obtain the final agar hydrogels.
1 (v/v, 2 mL) at 40 °C and mixed with 10 μL of Cu4c solution. Last, the 10 μL of final solution was added to the filter paper to obtain the final agar hydrogels.
Polyacrylamide (PAM) in the form of a three-dimensional network hydrogel was prepared as follows. 150 μL of 30%(w/w) monomer acrylamide (AM) solution was mixed with 350 μL of enzyme solution (1). 5 μL of Cu4c solution was mixed with 2.5 μL of 10%(w/w) APS aqueous solution (2). Solutions (1) and (2) were combined together, and the resulting mixture solution was stirred until a homogeneous solution was observed. Finally, 0.5 μL TEMED was added the solution to yield the network solution and the desired volume was dropped onto the filter paper to yield the PAM hydrogel.
Glucose detection in human whole blood
Blood specimens were obtained from individuals enrolled in Taipei Veterans General Hospital under an approved IRB protocol (Taiwan; 2017-12-002CC). All study participants provided written, informed consent forms, and the blood samples were de-identified to the user and transported directly to the laboratory for evaluation. In parallel, the glucose measurements were conducted with a glucometer from Roche (Accu-Chek Active, Dubai, UAE).Statistical analysis
In SPSS (version 20, Chicago, IL, USA), a paired sample t-test was performed to compare the means of paired glucose measurements. Here, the means are expressed as the mean ± standard deviation (SD) of triplicate data. Then a Pearson's correlation coefficient was calculated to test whether there was a linear relationship between paired measurements. Finally, a linear regression model was built to assess the association between measured means. A P value of less than 0.05 was regarded as statistically significant.Conflicts of interest
There are no conflicts to declare.Acknowledgements
This work was supported by the Ministry of Science and Technology, Taiwan.References
- J. Noiphung, T. Songjaroen, W. Dungchai, C. S. Henry, O. Chailapakul and O. Laiwattanapaisal, Anal. Chim. Acta, 2013, 788, 39–45 CrossRef CAS.
- F. A. Gomez, Bioanalysis, 2013, 5, 1–3 CrossRef CAS.
- S. Chaiyo, A. Apiluk, W. Siangproh and O. Chailapakul, Sens. Actuators, B, 2016, 233, 540–549 CrossRef CAS.
- K. R. Chabaud, J. L. Thomas, M. N. Torres, S. Oliveira and B. R. McCord, Forensic Chem., 2018, 9, 35–41 CrossRef CAS.
- C. Baynes and J. Y. Yoon, SLAS Technol., 2018, 23, 30–43 CAS.
- S. V. de Freitas, F. R. de Souza, J. C. Rodrigues Neto, G. A. Vasconcelos, P. V. Abdelnur, B. G. Vaz, C. S. Henry and W. K. T. Coltro, Anal. Chem., 2018, 90, 11949–11954 CrossRef CAS.
- B. Wang, Z. Lin and M. Wang, J. Chem. Educ., 2015, 92, 733–736 CrossRef CAS.
- M. Chen, H. Yang, L. Rong and X. Chen, Analyst, 2016, 141, 5511–5519 RSC.
- S. Liu, W. Su and X. Ding, Sensors, 2016, 16, 2086–2102 CrossRef.
- N. Pestana, D. Walsh, A. Hatch, P. Hahn, G. J. Jaffe, S. K. Murthy and M. Niedre, J. Med. Devices, 2013, 7, 024501 CrossRef.
- D. A. M. Carvalho, A. R. O. Rodrigues, V. Faustino, D. Pinho, E. M. S. Castanheira and R. Lima, J. Funct. Biomater., 2018, 9, 70–80 CrossRef CAS.
- H. Li and A. J. Steckl, Anal. Chem., 2019, 91, 352–371 CrossRef CAS.
- A. M. Smith, M. C. Mancini and S. Nie, Nat. Nanotechnol., 2009, 4, 710–711 CrossRef CAS.
- R. Robinson, L. Wong, R. J. Monnat and E. Fu, Micromachines, 2016, 7, 28–37 CrossRef.
- X. Yang, O. Forouzan, T. P. Brown and S. S. Shevkoplyas, Lab Chip, 2012, 12, 274–280 RSC.
- C. C. Tseng, R. J. Yang, W. J. Ju and L. M. Fu, Chem. Eng. J., 2018, 348, 117–124 CrossRef CAS.
- Q. Ju, M. O. Noor and U. J. Krull, Analyst, 2016, 141, 2838–2860 RSC.
- Y. Li, Z. Song, L. Yao, S. Yang and Y. Zhang, CrystEngComm, 2018, 20, 2850–2860 RSC.
- Y. Zhong, B. Chu, X. Bo, Y. He and C. Zhao, Chem. Commun., 2019, 55, 652–655 RSC.
- M. A. Nawaz, A. Karim, A. Aman, R. Marchetti, S. A. U. Qader and A. Molinaro, Bioprocess Biosyst. Eng., 2014, 38, 631–638 CrossRef.
- Y. T. Chen, C. Y. Lin, G. H. Lee and M. L. Ho, CrystEngComm, 2015, 17, 2129–2140 RSC.
- A. Rath, F. Cunningham and C. M. Deber, Proc. Natl. Acad. Sci. U. S. A., 2013, 110, 15668–15673 CrossRef CAS.
- R. Mahajan, V. K. Gupta and J. Sharma, Indian J. Pharm. Sci., 2010, 72, 223–228 CrossRef CAS.
- C. S. Smith, C. W. Branham, B. J. Marquardt and K. R. Mann, J. Am. Chem. Soc., 2010, 132, 14079–14085 CrossRef CAS.
- C. S. Smith and K. R. Mann, J. Am. Chem. Soc., 2012, 134, 8786–8789 CrossRef CAS.
- M. L. Ho, Y. A. Chen, T. C. Chen, P. J. Chang, Y. P. Yu, K. Y. Cheng, C. H. Shih, G. H. Lee and H. S. Sheu, Dalton Trans., 2012, 41, 2592–2600 RSC.
- Z. B. Pan, Y. C. Wang, G. Chakkaradhari, J. F. Zhu, R. Y. He, Y. C. Liu, C. H. Hsu, I. O. Koshevoy, P. T. Chou, S. W. Pan and M. L. Ho, Dalton Trans., 2018, 47, 8346–8355 RSC.
- J. J. Luo, S. W. Pan, J. H. Yang, T. L. Chang, P. Y. Lin, C. L. Wu, W. F. Liu, X. R. Huang, I. O. Koshevoy, P. T. Chou and M. L. Ho, Polymers, 2018, 10(9), 1001 CrossRef.
- A. Salimi, R. G. Compton and R. Hallaj, Anal. Biochem., 2004, 333(1), 49–56 CrossRef CAS.
- J. Yu, S. Liu and H. Ju, Biosens. Bioelectron., 2003, 19(4), 401–409 CrossRef CAS.
- X. Yang, Z. Zhou, D. Xiao and M. M. F. Choi, Biosens. Bioelectron., 2006, 21(8), 1613–1620 CrossRef CAS.
- G. Chang, Y. Tatsu, T. Goto, H. Imaishi and K. Morigaki, Talanta, 2010, 83(1), 61–65 CrossRef CAS.
- S. De Marcos, J. Galindo, J. F. Sierra, J. Galban and J. R. Castillo, Sens. Actuators, B, 1999, 57(1–3), 227–232 CrossRef CAS.
- M. Portaccio, M. Lepore, B. Della Ventura, O. Stoilova, N. Manolova, I. Rashkov and D. G. Mita, J. Sol-Gel Sci. Technol., 2009, 50(3), 437–448 CrossRef CAS.
- A. K. Yetisen, M. S. Akram and C. R. Lowe, Lab Chip, 2013, 13, 2210–2251 RSC.
- G. Chakkaradhari, Y. T. Chen, A. J. Karttunen, M. T. Dau, J. Jänis, S. P. Tunik, P. T. Chou, M. L. Ho and I. O. Koshevoy, Inorg. Chem., 2016, 55, 2174–2184 CrossRef CAS.
- E. Carrilho, A. W. Martinez and G. M. Whitesides, Anal. Chem., 2009, 81, 7091–7095 CrossRef CAS.
Footnote |
| † Electronic supplementary information (ESI) available: The optimum concentration of enzyme, the collision efficiency for oxygen of Cu4c, the emission intensity as a function of glucose, the interference test, and the validation plot of measurements using the present method versus the values of glucose measured by glucometer. See DOI: 10.1039/c9ra04278d |
| This journal is © The Royal Society of Chemistry 2019 |

