 Open Access Article
A molecular approach on the ability of functionalized single walled carbon nanotube for cathinone sensing
Rahele Zhiani *ab,
Shokufe Emraniab and
Iman Razavipanaha
aDepartment of Chemistry, Faculty of Sciences, Neyshabur Branch, Islamic Azad University, Neyshabur, Iran. E-mail: r_zhiani2006@yahoo.com; r_zhiani@iau-neyshabur.ac.ir
bYoung Researchers and Elite Club, Neyshabur Branch, Islamic Azad University, Neyshabur, Iran
First published on 15th July 2019
Abstract
In this article, single walled carbon nanotube functionalized with COOH (NT1) and CONHCH3 (NT2) groups were used for detection of the cathinone (CT) molecule in the gas phase and the liquid phase from the theoretical point of view. Density functional theory (DFT) calculations indicate that the NT2 nanostructure is more sensitive to the cathinone molecule than to the NT1 nanostructure. Compared to the gas phase, in the liquid phase water increases the sensitivity of the nanostructures toward the cathinone molecules. DFT results show that the polarity of the solvent increases the stability of the complexes. Donor–acceptor orbital interactions reveal that the cathinone molecule has a more effective orbital interaction with the NT2 nanostructure, especially in a water solvent. Also, molecular dynamic (MD) simulations confirm that the interactions between the cathinone molecule and the nanostructures increase in the water solvent. Therefore, NT nanostructures are more sensitive toward the CT molecule in a water solvent.
Introduction
Today, nano-structured materials have many applications in different areas like sensing, biology, electronic and drug delivery.1–4 Single walled carbon nanotubes (SWCNTs) represent an innovative class of nanomaterials with some interesting advantages, such as a large inner volume and outer surfaces for functionalization. In other words, SWCNTs have a larger outer surface, a property that makes the SWCNTs more practical than other nanostructures.5–7 Carbon nanomaterials have attracted much attention due to their special structural and physical properties.8 With nanometre-scale dimensions, the properties of carbon nanomaterials are strongly dependent on their atomic structures and interactions with other materials.9 For more than one decade, carbon nanomaterials were used for sensing different analytes, including gas molecules, solvents and biomolecules.10,11Kong et al. reported the application of a SWCNT for gas sensing. Based on their results, a large shift in the threshold voltages of the SWCNT were observed in the negative and positive directions upon exposure to ammonia (NH3) and nitrogen dioxide (NO2) molecules, respectively.12,13 By applying quantum chemistry, Baei et al. studied the ability of an SWCNT functionalized with Pd metal for sensing carbon monoxide.14 The results show that the Pd metal increases the sensing ability of the (6,0) SWCNT toward carbon monoxide. Therefore, this nanostructure is a good candidate for the selective sensing of carbon monoxide. By using theoretical methods, Majidi shows that the electronic properties of an SWCNT were significantly changed in the presence of hydrogen peroxide.15
The psychostimulating herbal drug kath (Catha edulis Forsk.) is cultivated and used as a recreational drug predominantly in East Africa and the Arabian Peninsula. The main psychoactive alkaloid of kath is the phenylpropylamine derivative S-(−)-α-aminopropiophenone (cathinone), which is accompanied by the less psychoactive phenylpropanolamine diastereomers S,S-(+)-norpseudoephedrine (cathine) and R,S-(−)-norephedrine, for which the detection in urine is of importance. Therefore, proposing new sensors based on theoretical methods can be useful for the detection of this alkaloid.
In this article, by employing quantum chemistry calculations and molecular dynamic simulations a new sensor based on a functionalized SWCNT for cathinone detection is proposed. The effect of functional groups on the sensitivity of SWCNTs was investigated from a theoretical viewpoint, and, on the basis of obtained results, functional groups have considerable effects on the sensing ability and selectivity of these functionalized nanostructures. Moreover, theoretical calculations determine the nature of the interactions between cathinone and functionalized SWCNTs, for which donor–acceptor orbital interactions between cathinone and the nanostructure are the driving force for complex formation. The importance of this study is to predict the interesting ability of the proposed functionalized SWCNT for cathinone detection.
Experimental
DFT calculations
The COOH and CONHCH3 groups were used to functionalize the (5,5) SWCNT of length 10 Å. The structures of the SWCNT–COOH, SWCNT–CONHCH3 and cathinone molecule are denoted by NT1, NT2 and CT, respectively. The structures of the NTs and their complexes with the CT molecule were optimized in the gas phase, water, chloroform and methanol at the M05-2X/6-31G(d,p) level of theory.16,17 The corresponding parameters for the gas phase are according to the Gaussian 09 software default. To calculate the thermodynamic parameters and determine the minimum energy structure frequencies, DFT calculations were performed. The conductor-like polarizable continuum model (CPCM)18 was applied to investigate the effects of methanol, chloroform, and water solvents on the response ability of the NT nanostructures toward the cathinone molecule. To investigate the electronic charge distribution and hydrogen bond (H-bond) formation between the CT molecule and NT nanostructures, natural bond orbital (NBO) analysis was applied.19 Also, the donor–acceptor interactions between the CT molecule and NT nanostructures were studied using NBO analysis. All the calculations were performed by employing the Gaussian 09 computational program.MD simulation details
All the MD simulations were performed by using the AMBER12 software package.20 Previous studies indicate that the AMBER 12 simulation package has been used successfully for the study of the carbon nanotube structures.21 Twenty CT molecules were added randomly around the NT1 and NT2 and the nanostructures were fully solvated with a cubic box of water, methanol and chloroform solvents, where the solvent molecule has a 15 Å distance with the solute molecules. Structural parameters of the cathinone molecule, NT nanostructures and also the atomic charges of these molecules were obtained from DFT calculations at the M05-2X/6-31G(d,p) level of theory. All the calculations were performed in the isothermal–isobaric ensemble at 1 atm and 300 K using the SANDER module. The SHAKE algorithm was applied to constrain the bonds containing hydrogen atoms.22 The Langevin dynamic was used for the temperature and pressure regulation.23 The periodic boundary conditions were imposed and the particle mesh Ewald (PME) method was used for long-range electrostatic interactions.24 The PME method was set at 12 Å for non-bonded interactions. Also, the general amber force filed (GAFF) parameters were applied for all the corresponding structures.25 Each simulation included 1000 steps of solvent relaxation and 1000 steps of solute relaxation for energy minimization. Then, systems were heated from 0 to 300 K for 2000 ps and equilibrated at 300 K for 2000 ps. The production stages were finally run for 10 ns with a time step of 2 fs. Water solvent was simulated using the TIP3P model and chloroform and methanol solvents were simulated by applying amber parameters.26,27Results and discussion
Structural and energy analysis
DFT calculations at the M05-2X/6-31G(d,p) level of theory were applied to investigate the interactions between the SWCNT and the COOH and CONHCH3 groups and the cathinone molecule in the gas and liquid phases. The optimized structures (with the minimum energy) of the CT molecule, NT nanostructures and their complexes in the gas phase are shown in Fig. 1. Before concluding as to the best optimized geometry, various orientations of the cathinone molecule with respect to the NT nanostructures were explored by changing their separation distance. The results from Fig. 1 imply that the calculated average of the C–C bond lengths and C–C–C angles of the NT nanostructures are 1.42 Å and 118.59 Å, respectively, which is in good agreement with previous studies.28,29 The calculated average of the N–H bond length of the CT molecule is 1.014 Å and the calculated average of C–N–H angle is 108.29 Å. The calculated average of O–H and N–H bond lengths of the NT1 and NT2 nanostructures are 0.967 and 1.005 Å, respectively. Due to the complex formation between the cathinone molecule and the NT1 nanostructure, the N1–H5 bond length decreases, however the N1–H6 bond length of the cathinone molecule does not change significantly. Moreover, the C3–O4 bond length of the CT molecule reduces from 1.216 to 1.213 Å, but the length of O8–H7 bond increases from 0.967 to 1.013 Å. These results indicate that the H7 atom of the NT1 nanostructure has a remarkable interaction with the N1 atom of the CT molecule (the calculated N1⋯H7 distance is 1.667 Å). Reoptimized, the corresponding structures in the water and other solvents reveal that solvents do not have a remarkable effect on structural parameters.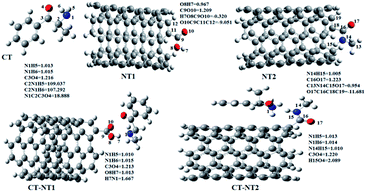 | ||
| Fig. 1 Optimized structures of the CT molecule and CT-NT complexes in the gas phase with their atom numbering. | ||
During the complex formation between the CT molecule and the NT2 nanostructure, the C1–O4 and N14–H15 bond lengths increased, which confirms the O4⋯H15 interaction (the calculated distance for this bond is 2.089 Å). Based on the results obtained from the structural analysis, O–H⋯N and O⋯H–N interactions have an important role on the complex formation between the CT molecule and the NT1 and NT2 nanostructures, respectively.
To confirm the interaction between the CT molecule and the NT nanostructures, IR vibrational frequencies of the C![[double bond, length as m-dash]](https://www.rsc.org/images/entities/char_e001.gif) O, N–H and O–H groups before and after complexation were calculated and are reported in Table 1. Inspection of Table 1 exhibits that, compared to the gas phase, solvents have an important effect on the IR vibrational frequencies. The IR frequencies of the C
O, N–H and O–H groups before and after complexation were calculated and are reported in Table 1. Inspection of Table 1 exhibits that, compared to the gas phase, solvents have an important effect on the IR vibrational frequencies. The IR frequencies of the C![[double bond, length as m-dash]](https://www.rsc.org/images/entities/char_e001.gif) O and N–H groups in the CT molecule have a red-shift in the liquid phase compared to the gas phase. However, in the NT2 nanostructure these groups have blue-shift in the liquid phase compared to the gas phase. IR vibrational frequencies of the O8–H7 bond in the NT1 nanostructure have a considerable red-shift due to the complex formation between the NT1 nanostructure and the CT molecule. The obtained results confirm that there are substantial interactions between NT1 and the CT molecule. Furthermore, the IR frequency of the N14–H15 bond in the NT2 nanostructure reduces during the complex formation with the CT molecule from 3700 to 3640 cm−1, approximately. In general, the results obtained from IR vibrational frequencies reveal that there are notable interactions between the NT nanostructures and the CT molecule in the presence of the studied solvents.
O and N–H groups in the CT molecule have a red-shift in the liquid phase compared to the gas phase. However, in the NT2 nanostructure these groups have blue-shift in the liquid phase compared to the gas phase. IR vibrational frequencies of the O8–H7 bond in the NT1 nanostructure have a considerable red-shift due to the complex formation between the NT1 nanostructure and the CT molecule. The obtained results confirm that there are substantial interactions between NT1 and the CT molecule. Furthermore, the IR frequency of the N14–H15 bond in the NT2 nanostructure reduces during the complex formation with the CT molecule from 3700 to 3640 cm−1, approximately. In general, the results obtained from IR vibrational frequencies reveal that there are notable interactions between the NT nanostructures and the CT molecule in the presence of the studied solvents.
| Structures | CT | NT1 | NT2 | CT-NT1 | CT-NT2 | |||||||
|---|---|---|---|---|---|---|---|---|---|---|---|---|
| Bonds | C3–O4 | N1–H5 | N1–H6 | O8–H7 | C9–O10 | C16–O17 | N14–H15 | O8–H7 | N1–H5 | C9–O10 | C3–O4 | N14–H15 |
| Gas | 1831.25 | 3556.18 | 3556.18 | 3844.96 | 1869.35 | 1783.16 | 3717.65 | 2875.88 | 3563.99 | 1831.32 | 1803.51 | 3651.50 |
| Chloroform | 1824.47 | 3554.07 | 3554.07 | 3545.19 | 1856.91 | 1804.76 | 3720.47 | 2821.49 | 3564.24 | 1819.44 | 1809.36 | 3646.91 |
| Methanol | 1823.17 | 3553.97 | 3553.97 | 3545.56 | 1853.56 | 1802.24 | 3720.88 | 2806.67 | 3564.25 | 1815.87 | 1807.98 | 3645.56 |
| Water | 1823.02 | 3553.96 | 3553.96 | 3545.56 | 1853.24 | 1802.42 | 3720.93 | 2805.18 | 3564.25 | 1815.50 | 1795.10 | 3645.41 |
In order to investigate the response ability of the NT nanostructures toward the CT molecule, thermodynamic parameters of the CT-NT complexes were calculated and the corresponding results are summarized in Table 2. According to Table 2, calculated binding energy (ΔEbin) values indicate that CT-NT complexes have considerable stability in the gas phase and different solvents. ΔEbin values of the CT-NT1 complex show that this structure is more stable in the gas phase compared to the methanol and chloroform solvents. However, water as a polar solvent significantly increases the stability of the CT-NT1 complex. The order of stability of the CT-NT1 complex in the gas phase and the mentioned solvents is: water > gas > methanol > chloroform. The calculated values of the binding enthalpy (ΔHbin) confirm that the complex formation reactions are exothermic processes. Also, the binding Gibbs free energies (ΔGbin) in Table 2 indicate that complex formation reactions are favourable from the thermodynamic viewpoint. The ΔEbin values of the CT-NT2 complex exhibit that this structure is more stable than the CT-NT1 complex in the gas phase and the studied solvents. Similar to the CT-NT1 complex, in the case of CT-NT2 the most stable complex was formed in the water solvent.
| Structure | NT1 | NT2 | ||||
|---|---|---|---|---|---|---|
| ΔEbin | ΔHbin | ΔGbin | ΔEbin | ΔHbin | ΔGbin | |
| Gas | −96.74 | −125.38 | −43.04 | −155.41 | −157.89 | −116.67 |
| Chloroform | −58.74 | −61.94 | −5.12 | −105.04 | −107.51 | −59.69 |
| Methanol | −59.74 | −60.73 | −6.71 | −103.25 | −105.74 | −57.43 |
| Water | −296.14 | −66.80 | −6.90 | −339.36 | −105.56 | −57.19 |
Furthermore, a clear inspection of the ΔEbin values shows that, unlike the CT-NT1 complex, a more stable complex was formed between the CT molecule and the NT2 nanostructure in a chloroform solvent.
Theoretical results obtained from the energy analysis indicate that both the NT1 and NT2 nanostructures have a considerable ability for sensing the cathinone molecule. Also, results show that the NT2 nanostructure is a more favourable receptor than the NT1 nanostructure for the detection of the CT molecule in the gas phase and especially in a water solvent.
In our previous work we employed theoretical methods to investigate the sensing ability of functionalized SWCNTs with COOH and CONHCH3 groups for the detection of ketamine.31 The obtained results indicate that SWCNT–COOH has a better sensing ability for ketamine detection than SWCNT–CONHCH3 and water as a solvent increases the sensitivity of the corresponding nanostructure toward ketamine. In addition to this, the electrostatic interactions between ketamine and the functionalized SWCNT have a key role on the complexation process.
In comparison to our previous study, the calculations indicate that SWCNT functionalized with a CONHCH3 group is a better candidate for sensing cathinone than the SWCNT–COOH nanostructure. An overall comparison of the obtained results from a theoretical viewpoint on the sensing ability of the functionalized SWCNT reveals that the functional group of the nanostructures has a key effect on the sensing properties of this structure. SWCNT–COOH has an interesting sensing ability toward ketamine while SWCNT–CONHCH3 is a good sensor for cathinone detection. Moreover, on the basis of these results, the solvent has an important effect on the sensing properties of a functionalized SWCNT and electrostatic interactions between the nanostructures and target molecule are a factor in the complex formation process.
NBO analysis
All the orbital details were mathematically chosen to include the highest possible percentage of the electron density. The most accurate possible picture of the wave function ψ was provided by the NBO method. A useful aspect of this method is that it can provide information about the interactions in both real occupied and virtual unoccupied orbitals. This means that the NBO method can facilitate the analysis of intermolecular interactions such as solvent–solute interactions. For evaluation of the donor–acceptor interactions, a second-order perturbation theory analysis of the Fock matrix was carried out. The interactions result in a loss of occupancy from the localized NBOs of the idealized Lewis structure into empty non-Lewis orbitals. In this analysis, the stabilization energy, E(2), which is related to the delocalization trend of electrons from the donor to the acceptor orbitals was calculated via perturbation theory. If the stabilization energy between a donor and acceptor bonding orbital is large, it can be concluded that there is a strong interaction between them.The most important stabilization energies of the CT-NT complexes in the gas phase and different solvents are summarized in Table 3. In the case of the CT-NT1 complex, the most important interactions are formed between the lone pair (LP) electrons of the O9 atom and the antibonding orbital of the O8–H7 and N1–H5 bonds as donors (LPO9,  and
and  ) with the antibonding orbitals of N1–H5, N1–H6 and O8–H7 bonds as the acceptors, respectively. According to Table 3, the
  interactions are weaker in the solution phase compared to the gas phase. On the other hand,
  and
and  interactions are stronger in the studied solvents compared to the gas phase.
In the case of the CT-NT2 complex, the most important interactions are related to  ,
,  and
and  The calculated E(2) values reveal that the
  interactions are significantly stronger than other donor–acceptor interactions in the CT-NT2 complex. Moreover, inspection of the E(2) values indicate that the CT molecule has stronger and more effective interactions with the NT2 structure compared to those with the NT1 structure. In the other words, the NT2 structure is a better sensor for the detection of the CT molecule. These results are in accordance with the obtained thermodynamic parameters.
Quantum reactivity descriptors
To investigate the changes of the electronic properties of the NT nanostructures toward the CT molecule, quantum reactivity descriptors were calculated by employing a HOMO–LUMO analysis.30 According to Table 4, the HOMO energy of the NT1 (EHOMO) structure increased in the studied solvents compared to that in the gas phase. Moreover, by increasing the polarity of the solvent, the HOMO energy of the NT1 nanostructure increased. A similar trend was observed for the LUMO energy (ELUMO) of this structure. From Table 4, it can be concluded that in the case of the NT1 nanostructure the chemical hardness (η) and the electronic chemical potential (μ) decreased in the liquid phase. This means that the solvent increases the reactivity of the NT1 nanostructure. Due to the complex formation between the NT1 nanostructure and the CT molecule, EHOMO and ELUMO of the NT1 nanostructure increased in the gas phase and the mentioned solvent. These results exhibit the important effect of the CT molecule on the electronic properties of the NT1 nanostructure. Comparison between the η and μ values of the NT1 nanostructure and CT-NT1 complex indicate that, after completion of the complex formation reaction, the chemical hardness of the NT1 nanostructure and the electronic chemical potential of the NT1 increase, except in the gas phase. This behaviour results in the stabilization of the CT-NT1 complex.| Structure | NT1 | CT-NT1 | ||||||
|---|---|---|---|---|---|---|---|---|
| −EHOMO | −ELUMO | η | −μ | −EHOMO | −ELUMO | η | −μ | |
| Gas | 0.2605 | 0.0278 | 0.2327 | 0.1441 | 0.2438 | 0.0211 | 0.2227 | 0.1324 |
| Chloroform | 0.2663 | 0.0338 | 0.2325 | 0.1500 | 0.2598 | 0.0233 | 0.2365 | 0.1415 |
| Methanol | 0.2678 | 0.0353 | 0.2325 | 0.1515 | 0.2640 | 0.0278 | 0.2362 | 0.1459 |
| Water | 0.2679 | 0.0354 | 0.2325 | 0.1516 | 0.2644 | 0.0283 | 0.2361 | 0.1463 |
| Structure | NT2 | CT-NT2 | ||||||
|---|---|---|---|---|---|---|---|---|
| −EHOMO | −ELUMO | η | −μ | −EHOMO | −ELUMO | η | −μ | |
| Gas | 0.2605 | 0.0211 | 0.2394 | 0.1408 | 0.2584 | 0.0290 | 0.2294 | 0.1437 |
| Chloroform | 0.2654 | 0.0267 | 0.2387 | 0.1460 | 0.2655 | 0.0297 | 0.2358 | 0.1476 |
| Methanol | 0.2666 | 0.0282 | 0.2384 | 0.1474 | 0.2674 | 0.0311 | 0.2363 | 0.1492 |
| Water | 0.2667 | 0.0283 | 0.2384 | 0.1475 | 0.2676 | 0.0313 | 0.2365 | 0.1494 |
EHOMO and ELUMO of the NT2 nanostructure increase in the gas and solution phase as: water > methanol > chloroform > gas. By decreasing the chemical hardness of the NT2 nanostructure, solvents increase the reactivity of this nanostructure. A similar trend was observed for μ in the solution phase. Chemical hardness and electronic chemical potential values of the CT-NT2 complex are lower than those obtained for the free NT2 nanostructure, confirming that the CT molecule increases the reactivity of the NT2 nanostructure.
MD simulation results
To evaluate the dynamic properties of the NT nanostructures for sensing the CT molecule in a solution phase, 10 ns MD simulations were performed in water, chloroform and methanol solvents. To this end, twenty cathinone molecules were added around the NT1 and NT2 nanostructures, randomly. Each CT molecule has at least a 10 Å distance to the NT nanostructures. MD analysis indicates that solvents have an important role on the interactions between the CT molecule and the NT nanostructures. Also, MD results show that the studied solvents have a positive effect on the ability of the NT nanostructures to bind the CT molecule. Fig. 2 shows the calculated distance between the NT nanostructures and the cathinone molecule in different solvents. It can be seen that the minimum distance between the CT molecule and the NT nanostructures was achieved in the water solvent. This means that the maximum interaction between the CT molecule and the NT nanostructures was obtained in this solvent.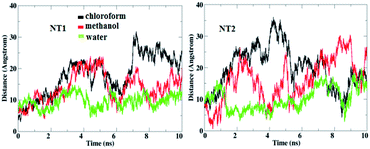 | ||
| Fig. 2 Calculated distances between the COOH and CONHCH3 groups in the NT nanostructures and the CT molecule in different solvents. | ||
According to the distance analysis results, the order of interaction between the CT molecule and NT nanostructures in different solvents is: water, methanol, chloroform. These results are in accordance with those obtained by DFT studies. Moreover, it should be mentioned that increasing the polarity of environment results in increasing the interaction between the CT molecule and the NT nanostructures.
The main factor for complexation between the CT molecule and the NT nanostructures is H-bond formation. Fig. 3 shows the calculated number of H-bonds formed between the CT molecule and the nanostructures. This figure clearly shows that the CT-NT complexes have a higher number of H-bonds in water compared to that in the other solvents. Moreover, the results show that the number of H-bonds formed with the CT-NT2 complex is greater than that with the CT-NT1 complex. This behaviour shows that the CT molecule forms a more stable complex with the NT2 nanostructure compared to that with the NT1 nanostructure. This finding is in accordance with those obtained by DFT studies.
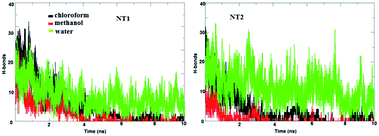 | ||
| Fig. 3 The calculated number of H-bonds formed between the CT molecule and the NT nanostructures in different solvents. | ||
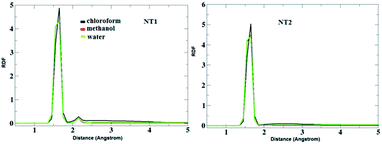
To evaluate the CT molecule arrangement around the NT nanostructures, a radial distribution function (RDF) analysis was performed. Fig. 4 shows the RDF plots of the interaction between O atoms from the NT nanostructures and H (of NH2) atoms from the CT molecule in the studied solvents. As can be seen in this figure, the first sharp peak appears around 1.5 Å, which confirms H-bond formation between the corresponding groups. Moreover, a careful inspection of this figure reveals that the solvents do not have an important effect on the interaction between O and H atoms in the CT-NT complexes.
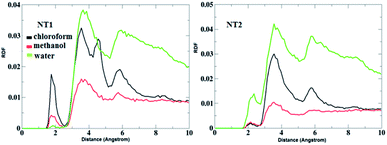
Fig. 5 shows the RDF plots of O⋯H bonds (O atoms from the CO group of the CT molecule and H atoms from the OH and NH groups of the NT nanostructures) in different solvents. As is evident from Fig. 5, in the presence of the chloroform solvent, the H-bond was formed between the OH, NH and CO groups, but in the case of the other solvents, the H-bond does not form between the mentioned groups. Fig. 6 represents RDF plots of the N⋯H bond in different solvents. As presented in Fig. 6, in the case of the CT-NT1 complex, two sharp peaks were seen around 1.9 and 3.1 Å. But in the case of the CT-NT2 complex only one peak around 3.1 Å was seen for this interaction in different solvents. MD simulation results exhibit that solvents have an important role on the formation of CT-NT complexes. Water as the solvent increases the stability of the complexes and the response ability of the NT nanostructures toward the CT molecule. As expected, the results obtained from the MD simulations are in good agreement with the DFT data.
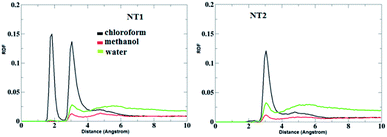 | ||
| Fig. 6 RDF plots of H⋯N bonds (H atom from the OH and NH groups of the NT nanostructures and N atom from the cathinone molecule) of the CT-NT complexes in water, chloroform and methanol solvents. | ||
Conclusions
DFT calculations and MD simulations in the gas phase and the liquid phase were performed for the investigation of the response ability of the NT nanostructures toward the cathinone molecule. DFT results show that the NT nanostructures have a remarkable ability for sensing the cathinone molecule. Water as the solvent increases the stability of the CT-NT complexes and response ability of the NT nanostructures toward the CT molecule. Moreover, the NT2 nanostructure has a better performance for the detection of the CT molecule compared to that of the NT1 nanostructure. 10 ns MD simulations reveal that a polar solvent like water is a good choice for increasing the ability of the NT nanostructures to bind the cathinone molecule.Conflicts of interest
There are no conflicts to declare.Acknowledgements
The authors gratefully acknowledge the support of this work by the Islamic Azad University, Neyshabur, Iran (Grant No. 70.27283).Notes and references
- V. R. Devadasu, V. Bhardwaj and M. R. Kumar, Chem. Rev., 2012, 113, 1686–1735 CrossRef.
- O. C. Farokhzad and R. Langer, ACS Nano, 2009, 3, 16–20 CrossRef CAS.
- E. M. Martín del Valle, M. A. Galan and R. G. Carbonell, Ind. Eng. Chem. Res., 2009, 48, 2475–2486 CrossRef.
- K. Park, ACS Nano, 2013, 7, 7442–7447 CrossRef CAS.
- N. Tanigaki, K. Murata, R. Kukobat, R. Futamura, T. Hayashi and K. Kaneko, Adsorption, 2019, 1–7 Search PubMed.
- C. Fabbro, H. Ali-Boucetta, T. Da Ros, K. Kostarelos, A. Bianco and M. Prato, Chem. Commun., 2012, 48, 3911–3926 RSC.
- S. K. Vashist, D. Zheng, G. Pastorin, K. Al-Rubeaan, J. H. Luong and F.-S. Sheu, Carbon, 2011, 49, 4077–4097 CrossRef CAS.
- V. K. Sangwan, D. Jariwala, K. Everaerts, J. J. McMorrow, J. He, M. Grayson, L. J. Lauhon, T. J. Marks and M. C. Hersam, Appl. Phys. Lett., 2014, 104, 083503 CrossRef.
- Q. Meng, K. Cai, Y. Du and L. Chen, J. Alloys Compd., 2019, 778, 163–169 CrossRef CAS.
- J. Shi, X. Li, H. Cheng, Z. Liu, L. Zhao, T. Yang, Z. Dai, Z. Cheng, E. Shi and L. Yang, Adv. Funct. Mater., 2016, 26, 2078–2084 CrossRef CAS.
- P. Bondavalli, P. Legagneux and D. Pribat, Sens. Actuators, B, 2009, 140, 304–318 CrossRef CAS.
- J. Kong, N. R. Franklin, C. Zhou, M. G. Chapline, S. Peng, K. Cho and H. Dai, Science, 2000, 287, 622–625 CrossRef CAS.
- E. N. Paura, W. F. da Cunha, J. B. L. Martins, G. M. e. Silva, L. F. Roncaratti and R. Gargano, RSC Adv., 2014, 4, 28249–28258 RSC.
- M. T. Baei and S. Z. Sayyad-Alangi, Fullerenes, Nanotubes, Carbon Nanostruct., 2013, 21, 12–18 CrossRef CAS.
- R. Majidi, Mol. Phys., 2013, 111, 89–93 CrossRef CAS.
- Y. Zhao and D. G. Truhlar, J. Phys. Chem. A, 2006, 110, 5121–5129 CrossRef CAS.
- R. J. Bartlett and G. D. Purvis, Int. J. Quantum Chem., 1978, 14, 561–581 CrossRef CAS.
- M. Cossi, N. Rega, G. Scalmani and V. Barone, J. Comput. Chem., 2003, 24, 669–681 CrossRef CAS.
- A. E. Reed, R. B. Weinstock and F. Weinhold, J. Chem. Phys., 1985, 83, 735–746 CrossRef CAS.
- D. A. Case, T. Darden, T. Cheatham III, C. Simmerling, J. Wang, R. Duke, R. Luo, R. Walker, W. Zhang, and K. Merz, AMBER 12, University of California, San Francisco, 2012 Search PubMed.
- Z. Khatti and S. M. Hashemianzadeh, J. Inclusion Phenom. Macrocyclic Chem., 2015, 83, 131–140 CrossRef CAS.
- J.-P. Ryckaert, G. Ciccotti and H. J. Berendsen, J. Comput. Phys., 1977, 23, 327–341 CrossRef CAS.
- D. S. Cerutti, R. Duke, P. L. Freddolino, H. Fan and T. P. Lybrand, J. Chem. Theory Comput., 2008, 4, 1669–1680 CrossRef CAS.
- U. Essmann, L. Perera, M. L. Berkowitz, T. Darden, H. Lee and L. G. Pedersen, J. Chem. Phys., 1995, 103, 8577–8593 CrossRef CAS.
- J. Wang, R. M. Wolf, J. W. Caldwell, P. A. Kollman and D. A. Case, J. Comput. Chem., 2004, 25, 1157–1174 CrossRef CAS.
- D. J. Price and C. L. Brooks III, J. Chem. Phys., 2004, 121, 10096–10103 CrossRef CAS.
- J. Wang, W. Wang, P. A. Kollman and D. A. Case, J. Mol. Graphics Modell., 2006, 25, 247–260 CrossRef CAS PubMed.
- S. Mukhopadhyay, R. H. Scheicher, R. Pandey and S. P. Karna, J. Phys. Chem. Lett., 2011, 2, 2442–2447 CrossRef CAS.
- I. Garg, H. Sharma, K. Dharamvir, V. Jindal and D. Kanhere, J. Phys. Chem. C, 2010, 114, 18762–18772 CrossRef CAS.
- S. Pathak, R. Srivastava, A. Sachan, O. Prasad, L. Sinha, A. Asiri and M. Karabacak, Spectrochim. Acta, Part A, 2015, 135, 283–295 CrossRef CAS.
- R. Zhiani, I. Razavipanah and S. Emrani, Struct. Chem., 2018, 29, 1807–1815 CrossRef CAS.
| This journal is © The Royal Society of Chemistry 2019 |


