 Open Access Article
Creative Commons Attribution 3.0 Unported Licence
Synthesis and electrochemical performance of NaV3O8 nanobelts for Li/Na-ion batteries and aqueous zinc-ion batteries
Fang Hu *,
Di Xie,
Fuhan Cui,
Dongxu Zhang and
Guihong Song
School of Materials Science and Engineering, Shenyang University of Technology, Shenyang 110870, China. E-mail: hufang25@sut.edu.cn
First published on 2nd July 2019
Abstract
NaV3O8 nanobelts were successfully synthesized for Li/Na-ion batteries and rechargeable aqueous zinc-ion batteries (ZIBs) by a facile hydrothermal reaction and subsequent thermal transformation. Compared to the electrochemical performance of LIBs and NIBs, NaV3O8 nanobelt cathode materials in ZIBs have shown excellent electrochemical performance, including high specific capacity of 421 mA h g−1 at 100 mA g−1 and good cycle stability with a capacity retention of 94% over 500 cycles at 5 A g−1. The good diffusion coefficients and high surface capacity of NaV3O8 nanobelts in ZIBs were in favor of fast Zn2+ intercalation and long-term cycle stability.
1. Introduction
In large-scale electric energy storage applications, lithium-ion batteries (LIBs) have not met the eventual requirements owing to limited lithium resources, safety hazards, high cost and low power density. Sodium-ion batteries have been brought into focus for renewable energy and smart grids because of the abundant sodium resources and low cost.1–3 However, the Na+ has a larger ionic radius (1.06 Å) than Li+ (0.76 Å), which causes sluggish Na+ ion kinetics, reversible intercalation difficulties and electrochemical performances lower than those for Li-ion batteries.4,5 Recently, the extensive study of aqueous zinc ion batteries (ZIBs) has begun owing to their low cost, high theoretical capacity (820 mA h g−1), environmentally friendliness and rich global distribution.6–8 The radius of the Zn2+ ion (0.74 Å) is almost the same as that of the Li+ ion (0.76 Å), but the development of rechargeable aqueous Zn-ion batteries is seriously impeded by the limited choices of suitable cathode materials because of the larger atomic mass and stronger positive polarity.8 α-MnO2,9 β-MnO2,10 γ-MnO2 (ref. 11) and ZnMn2O4 (ref. 12) have been explored as cathode materials for ZIBs, but the MnO2 cathode suffers from poor rate performance and rapid capacity fading due to its inherent low conductivity and the Jahn–Teller distortion effect, while ZnMn2O4 delivers limited capacity around 90 mA h g−1 at a current of 500 mA g−1.In the past, layered vanadium-based compounds have been exhibited good electrochemical performance for LIBs and NIBs because of the multiple oxidation state of vanadium and wide interlayer spacing.13–17 Now, layered vanadium-based compounds, such as Zn0.25V2O5·nH2O,18 V2O5·nH2O,19 H2V3O8,20 V3O7·H2O,21 Na0.33V2O5,22 VS2 (ref. 23) and Zn2V2O7,24 can also act as promising host materials for ZIBs based on intercalation reaction. Nazar's group reported hydrothermal synthesis of Zn0.25V2O5·nH2O nanobelts, which exhibited a specific energy of about 250 W h kg−1, a capacity of 220 mA h g−1 at 4.5 A g−1, and a capacity retention of more than 80% after 1000 cycles.18 Kim and his coworkers prepared Zn2V2O7 nanowires, which delivered a specific energy of 166 W h kg−1 at 50 mA g−1. The cycling performance of Zn2V2O7 indicates a 85% of the maximum capacity after 1000 cycles at 4 A g−1.24 Liang' group obtained Na1.1V3O7.9 nanoribbons/graphene with a high capacity of 220 mA h g−1 at 300 mA g−1, and a high capacity retention of 77% with respect to the highest value after 100 cycles.25
Recently, layered vanadium-based compounds NaV3O8 has been reported as a cathode material for LIBs, NIBs and ZIBs, respectively. Cao et al. synthesized NaV3O8 nanoplates by using an in situ template method. The electrode can deliver a high capacity of 230 mA h g−1 at the current density of 100 mA g−1 with capacity retention of 93.4% after 200 cycles.14 He et al. reported hydrothermal synthesis NaV3O8 nanowires with the raw material of V2O5 and NaOH, and they present a high discharge capacity of 145.8 mA h g−1 at the current density of 10 mA g−1 and good retention of 91.1% after 50 cycles for NIBs.26 Mai group fabricated NaV3O8 nanowires by annealing Na2V6O16·1.63H2O at 400 °C, which only shows a discharge capacity of 240 mA h g−1 at the current density of 50 mA g−1 for ZIBs.27
Herein, we develop a facile hydrothermal reaction and subsequent thermal transformation to obtain NaV3O8 nanobelts. The as-prepared NaV3O8 nanobelts are investigated as the cathode material for aqueous zinc ion batteries, which exhibited superior zinc ions storage performances including large specific capacity (421 mA h g−1 at 100 mA g−1), high rate capability (120 mA h g−1 at 10 A g−1) and long-term cycling stability (a retention of 94% at 5 A g−1 after 500 cycles).
2. Experimental
All chemicals were of analytical grade and were used as received without further purification. In a typical procedure, 0.24 g NaOH, 0.234 g NH4VO3 and 0.053 g Na2CO3 were added together to a beaker with 50 mL of distilled water and the solution was stirred at 90 °C for 20 min. Then, put the beaker into cool water to room temperature. 1 mL 30% H2O2 was dissolved in the solution and stirred about 2 min with the solution color changed to faint yellow. The solution was adjusted to pH = 1.9 by the titration of 2 mol L−1 HCl and kept for stirring about 30 min, the solution color turns to reddish brown gradually. Finally, the solution was thrown into a 50 mL autoclave and subjected to hydrothermal treatment at 200 °C for 24 h. And then, the autoclave was naturally cooled down and red precipitates were collected, followed with wash with distilled water and alcohol for several times, and finally dried at 60 °C. At last, the product was also annealed in air atmosphere at 400 °C for 4 h with an increasing rate of 3 °C min−1.The crystallographic structure and phase purity of the as-prepared products were measured by a powder X-ray diffraction analyzer (XRD, 7000, Shimadzu) with Cu Kα radiation (λ = 1.5406 Å). The morphology and structure of the samples were characterized by using a scanning electron microscope (SEM, Hitachi-4800) and a high resolution transmission electron microscope (HRTEM, JEM-2100 PLUS) operated at 200 kV. X-ray photoelectron spectra (XPS) measurements were conducted using an ESCALAB250 to investigate the elemental composition using an Al Kα source. The nitrogen adsorption–desorption isotherms at the temperature of liquid nitrogen (77 K) were measured on VSorb 4800P Surface Area and Pore Porosimetry Analyzer (Gold Spectrum Technology Co., Ltd., China) with prior degassing under vacuum for 4 h at 150 °C. Total pore volumes were determined using the adsorbed volume at a relative pressure of 0.99. The multi-point Brunauer–Emmett–Teller (BET) surface area was estimated from the relative pressure range from 0.05 to 0.2.
Galvanostatic discharge/charge measurements were carried out using Land-2100 automatic battery tester (Land-2100, China). Electrochemical tests were performed by using a coin battery cell, where a metallic lithium foil, sodium foil and zinc foil were used as the anode electrode for Li/Na ion batteries and aqueous zinc ion batteries, respectively. For Li/Na coin cells, NaV3O8 active materials (70%, mass fraction) were blended with acetylene black (20%, mass fraction) and polyvinylidene fluoride (PVDF, 10%, mass fraction). The resultant slurry was pasted on an Al foil as cathode electrode and then dried in a vacuum oven. For zinc coin cells, the cathode electrode was fabricated by pressing a mixture of 70% active material, 20% conductive carbon and 10% poly tetra fluoroethylene (PTFE) onto a carbon paper and dried under air at 60 °C for 12 h. A Whatman grade glass fiber was chosen as separator between cathode and anode for Na ion batteries and aqueous zinc ion batteries, respectively. 1 mol L−1 lithium hexafluorophosphate (LiPF6) dissolved in ethylene carbonate (EC), dimethyl carbonate (DMC) and ethyl methyl carbonate (EMC) (EC![[thin space (1/6-em)]](https://www.rsc.org/images/entities/char_2009.gif) :
:![[thin space (1/6-em)]](https://www.rsc.org/images/entities/char_2009.gif) DMC
DMC![[thin space (1/6-em)]](https://www.rsc.org/images/entities/char_2009.gif) :
:![[thin space (1/6-em)]](https://www.rsc.org/images/entities/char_2009.gif) EMC = 1
EMC = 1![[thin space (1/6-em)]](https://www.rsc.org/images/entities/char_2009.gif) :
:![[thin space (1/6-em)]](https://www.rsc.org/images/entities/char_2009.gif) 1
1![[thin space (1/6-em)]](https://www.rsc.org/images/entities/char_2009.gif) :
:![[thin space (1/6-em)]](https://www.rsc.org/images/entities/char_2009.gif) 8, by v/v ratio) was used as electrolyte. For Na coin cells, the electrolyte was 1 mol L−1 NaClO4 dissolved in a solvent mixture of ethylene carbonate (EC) and propylene carbonate (PC) (1
8, by v/v ratio) was used as electrolyte. For Na coin cells, the electrolyte was 1 mol L−1 NaClO4 dissolved in a solvent mixture of ethylene carbonate (EC) and propylene carbonate (PC) (1![[thin space (1/6-em)]](https://www.rsc.org/images/entities/char_2009.gif) :
:![[thin space (1/6-em)]](https://www.rsc.org/images/entities/char_2009.gif) 1 v/v) and 5% FEC. For zinc ion batteries, the coin cells were assembled under room temperature and 1 mol L−1 ZnSO4·7H2O and 0.2 mol L−1 Na2SO4 mixed solution was used as the electrolyte. Cyclic voltammetry (CV) was carried out using Bio-Logic VSP-300 multichannel electrochemical workstations.
1 v/v) and 5% FEC. For zinc ion batteries, the coin cells were assembled under room temperature and 1 mol L−1 ZnSO4·7H2O and 0.2 mol L−1 Na2SO4 mixed solution was used as the electrolyte. Cyclic voltammetry (CV) was carried out using Bio-Logic VSP-300 multichannel electrochemical workstations.
3. Results and discussion
XRD patterns of the as-synthesized NaV3O8 (hereafter denoted as NVO) products are showed in Fig. 1a. The diffraction peaks of the as-synthesized NVO could be well indexed to Na1.1V3O7.9 phase (JCPDS no. 45-0498), and no other impurities are detected. Nitrogen adsorption–desorption isotherms characterization (Fig. 1b) revealed that the Brunauer–Emmett–Teller (BET) surface area of the as-prepared NVO was 25.5 cm2 g−1, which could provide large contact area between the materials and electrolyte. XPS analysis of V and O was performed as shown in Fig. 1c and d, respectively. The peaks position of V are centered at 517 eV and 524.5 eV, respectively. The spin–orbit coupling splits the V 2p states into j = 3/2 and j = 1/2 by about 7.5 eV.28 The peaks located at lower energy of 529.8, 531.3, and 532.5 eV could be assigned to O 1s in NVO, which is similar to the that of H2V3O8.29 The first one corresponds to O2− ion in the V–O bonding, the second and the third are assigned to OH group in H2O molecule and C![[double bond, length as m-dash]](https://www.rsc.org/images/entities/char_e001.gif) O on the surface, respectively.
O on the surface, respectively.
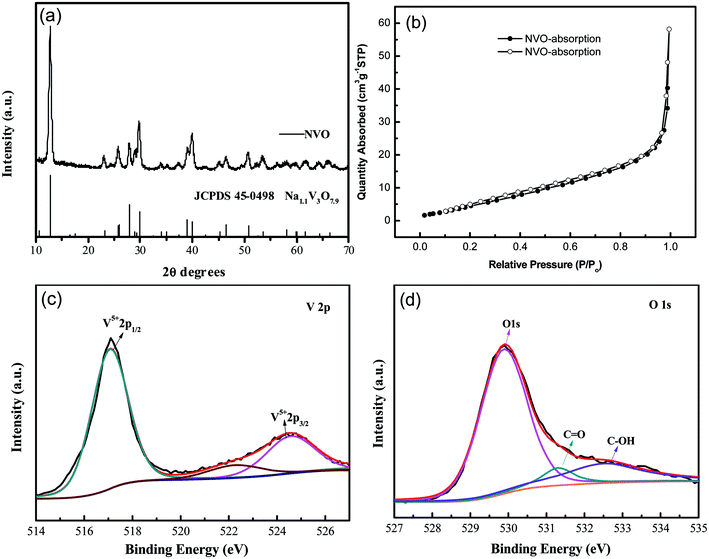 | ||
| Fig. 1 (a) XRD patterns of the as-synthesized products; (b) N2 adsorption–desorption isotherm of NVO samples. XPS survey spectrum of NVO samples (c) V 2p and (d) O 1s. | ||
In our experiment, multi-step synthesis of NaV3O8 nanobelts can be described by the following reactions:
| NH4+ + VO3− + 3OH− → VO43− + NH3↑ + 2H2O | (1) |
| VO43− + 2H2O2 → [VO2(O2)2]3− + 2H2O | (2) |
| 2Na+ + 4H+ + 4[VO2(O2)2]3− + 2[V(O2)]3+ + H2O → Na2V6O16·3H2O + 5O2↑ | (3) |
 | (4) |
The reaction (2) showed that [VO2(O2)2]3− can be formed by added H2O2 with the solution color turned to faint yellow. For the third step, when the pH value of the solution decreased to 1.9, some [VO2(O2)2]3− can be converted to [V(O2)]3+ with the solution changed to reddish brown. As we known, [VO2(O2)2]3− can be converted to [V(O2)]3+ totally when the pH value is 1.0.
The SEM image in Fig. 2a and b shows the NVO is composed of long belts-like with lengths of above 50 μm and widths of about 200–300 nm. The TEM results in Fig. 2c show the thickness of NVO nanobelts are about 30 nm. HRTEM in Fig. 2d shows the lattice fringes of 0.195 nm corresponded to the (11–7) planes of NaV3O8 and the spot in the SAED pattern was parallel to the length of the NVO nanobelts, indicating the growth direction of the material.
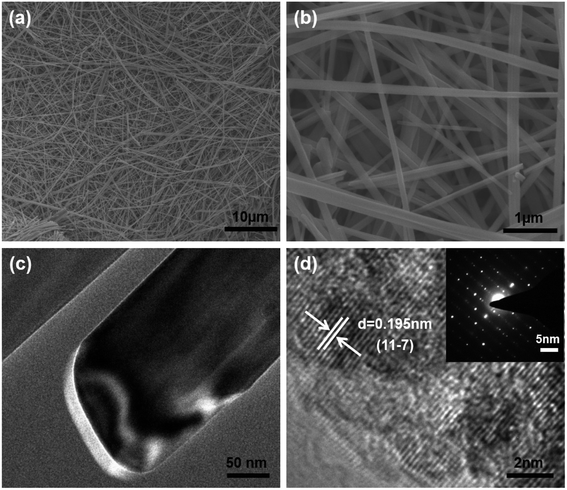 | ||
| Fig. 2 (a) Low magnification SEM images of NVO nanobelts. (b) High magnification SEM images of NVO nanobelts; (c) TEM images of the NVO nanobelts; (d) HRTEM and SAED (inset) image of NVO nanobelts. | ||
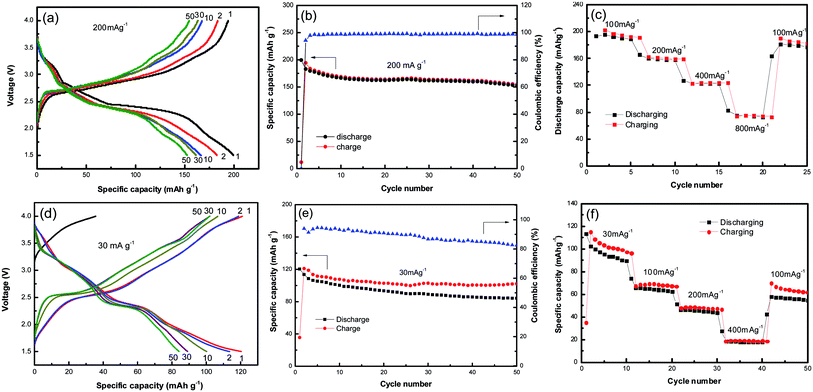
Fig. 3a shows the galvanostatic charge–discharge profiles of NVO nanobelts at a current density of 200 mA g−1 with Li in the voltage range from 4 V to 1.5 V. It can be observed that the discharge plateaus located at around 3.2, 2.7 and 2.4 V, implying a complex multiphase transition mechanism during the Li-ion insertion process. The initial discharge capacity of NVO nanobelts is about 200 mA h g−1, which corresponds to a 2.26 electron transfer reaction. A high charge capacity of 195 mA h g−1 can be obtained, indicating a high reversibility of NVO nanobelts cathode materials for Li insertion/extraction reactions. After 50 cycles in Fig. 3b, NVO nanobelts can maintain discharge capacity of 153 mA h g−1 with a capacity retention of 76.5% and high coulombic efficiency of 99%. Fig. 3c shows the rate performance of NVO nanobelts with Li at the different current densities of 100 mA g−1, 200 mA g−1, 400 mA g−1 and 800 mA g−1, respectively. The NVO nanobelts electrode presents a high discharge capacity of 76 mA h g−1 at the current density of 800 mA g−1. When the current density finally returned to 100 mA g−1, a capacity of 177 mA g−1 could be recovered, indicating NVO nanobelts remains stable after high rates. In addition, the electrochemical performance of NVO nanobelts as cathode materials in the voltage range from 4 V to 1.5 V for Na-ion batteries was also investigated (Fig. 3d–f). The initial discharge capacity of NVO nanobelts with Na is about 120 mA h g−1 at a current density of 30 mA g−1 with two average plateaus at about 3.0 and 2.39 V. The charge–discharge profiles at different cycles are overlap reasonably well, indicating the good structural reversibility of NVO nanobelts upon long cycling. The capacity retention after 50 cycles is 70% with coulombic efficiency of 84%. We speculate that Na ions in NaV3O8 cannot act as a pillar between the [V3O8] layers in Na ion batteries, which results to the crystal structure of the sample collapsed during the charge and discharge cycle and indicates a low coulombic efficiency.30 The electrode presents a rate capability with reversible average discharge capacity of 94, 65, 46 and 18 mA h g−1 at the current densities of 30, 100, 200 and 400 mA g−1, respectively. When cycling at 100 mA h g−1 again, the discharge capacity remains at 56 mA h g−1, which indicates NVO nanobelts cathode remains stable after high rates.
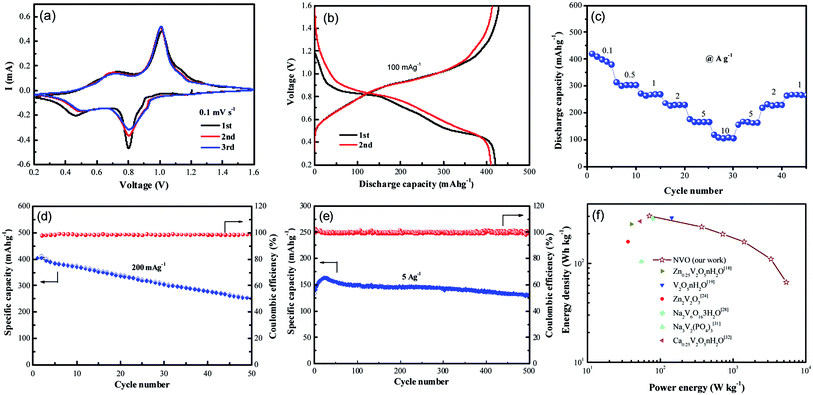
Recently, vanadium-based materials have received extensively attention as cathode for aqueous ZIBs with excellent electrochemical performance. Herein, the electrochemical performance of NVO nanobelts was also investigated. The first three cycled electrochemical Zn-ion storage performance of NVO electrode in Fig. 4a is assessed using CV at 0.1 mV s−1 scan rate in the potential range 0.2–1.6 V. Two strong redox peaks on both cathodic and anodic sweeps are observed, corresponding to continuous reduction (Zn2+ insertion) and oxidation (Zn2+ extraction) of NVO electrode. The redox couple at about 0.80/1.01 V in the cathodic/anodic sweep represents the redox couple at the equilibrium voltage V5+/V4+ in NVO electrode. Similarly, the redox couple at 0.46/0.73 V represents the V4+/V3+ couple. The multiphase vanadium redox couples commonly induce multistep electrochemical intercalation/extraction of various charge carriers in the vanadium-based layered structure. The second and third discharge profiles are similar and slightly different from the first, indicating a stead structure after first cycle. The largely overlapped CV curves for the NVO electrode suggest the good reversibility of the zinc ions interaction/extraction process and the good retention of crystallinity.
Galvanostatic first charge–discharge profiles of NVO electrodes with Zn are examined at a current density of 100 mA g−1 in the voltage range from 0.2 V to 1.6 V (Fig. 4b). In agreement with the CV curves, the NVO electrode exhibits a profile with two discharge plateau at about 0.84 V and 0.5 V during discharge, respectively. The NVO electrode delivers initial specific discharge capacity of 421 mA h g−1, which is close to the theoretical capacity 529 mA h g−1 of NVO corresponding to 2.37 mol Zn2+ insertion. The calculated first charge capacity is 428 mA h g−1 with a high initial coulombic efficiency (101.7%) for NVO. In the second and third discharge process, these two voltage plateaus of NVO remained in every profile. This phenomenon suggested that the electrochemical reactions might occur without irreversible crystal structure change in the subsequent cycles. The rate performance of NVO electrodes is also tested in Fig. 4c. The average discharge capacities are 400, 303, 270, 231, 166 and 105 mA h g−1 at current densities of 0.1, 0.5, 1, 2, 5 and 10 A g−1, respectively. When the rate is returned to 1 A g−1, the electrode is able to recover a reversible capacity of 270 mA h g−1, indicating a high reversibility of NVO nanobelts cathode materials for Zn insertion/extraction reactions.
Fig. 4d shows the cycling performance and coulombic efficiency of the NVO electrodes at the current density of 200 mA g−1, respectively. After 50 cycles, the discharge capacities are reduced from 400 to 253 mA h g−1, corresponding to the capacity retention of 62%. Fig. 4e shows the cycling performance of NVO in large current density of 5 A g−1. The increase specific capacity of NVO from 139 mA h g−1 to the maximum capacity of 163 mA h g−1 for about the initial 20 cycles is attributed to the activation. After reaching a steady state, the electrode exhibits a decrease in capacity, and at the end of 500 cycles, achieves a capacity of 131 mA h g−1 with retention of 94% of the first discharge capacity, indicating the outstanding rate ability and stable cycling ability of NVO nanobelts electrode.
The Ragone plot in Fig. 4f can be used to evaluate the practical suitability of the NVO electrode along with reported cathode for ARZIBs. This electrode delivers a high specific energy of 302 W h kg−1 at the specific power of 71 W kg−1 based on the active mass of the cathode material, which surpasses those cathodes such as Zn0.25V2O5·nH2O,18 V2O5·nH2O,19 Zn2V2O7,24 Na2V6O16·3H2O,28 Na3V2(PO4)3 (ref. 31) and Ca0.25V2O5·nH2O.32 The energy density still remained at a high value of 64 W h kg−1 when the power density was as high as 5440 W kg−1, indicating a fast and good electrochemical performance of NVO electrode for ARZIBs.
To further understand the electrochemical kinetics, cyclic voltammetry curves of the NVO electrodes at different voltage scan rates varies from 0.1 to 1.0 mV s−1 with Zn were shown in Fig. 5a. The electrochemical kinetics process can be assumed to fit the following eqn (5).33
| i = aνb | (5) |
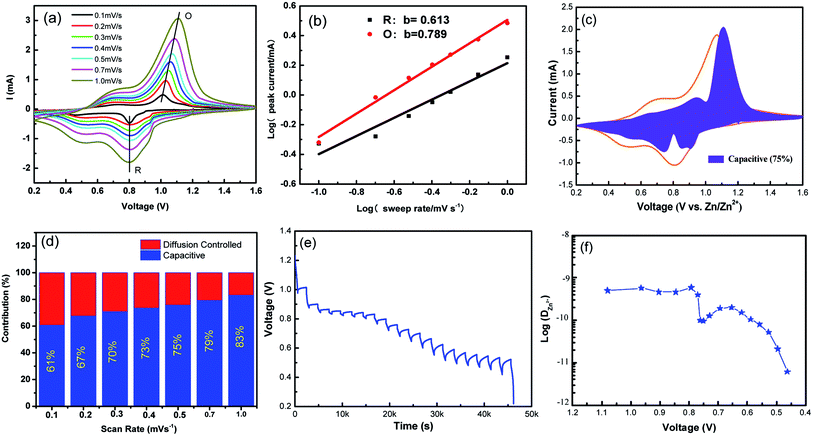 | ||
| Fig. 5 (a) Cyclic voltammetry curves of the NVO electrodes at different voltage scan rates varies from 0.1 to 1.0 mV s−1 for aqueous Zn-ion batteries. (b) log(i)–log(ν) plots for specific peak currents at different scan rates to analysis the diffusion/capacity behaviors. (c) The contribution ratio of the capacitive capacities and diffusion-limited capacities based on eqn (2) at 0.5 mV s−1. (d) Bar diagram for contribution ratio between capacitive capacities and diffusion-limited capacities for different voltage scan rates. (e) GITT data collected at a current density of 100 mA g−1 for 10 min and a rest interval of 30 min. (f) The corresponding ionic diffusion coefficient. | ||
From eqn (5), to further analyze the combination of surface-controlled capacitive and diffusion-controlled intercalation processes, the following equation is derived.34
| i = k1v + k2v1/2 | (6) |
In addition, to determining the average diffusion coefficient around the redox peaks, galvanostatic intermittent titration technique (GITT) measurements are carried out to better understand the kinetics during the diffusion of Zn2+ ions in NVO. The GITT data were collected at a current density of 100 mA g−1 for 10 min and a rest interval of 30 min (Fig. 5e). The ionic diffusion coefficient in NVO electrodes as a function of voltage can be determined by the following equation.35
 | (7) |
 | (8) |
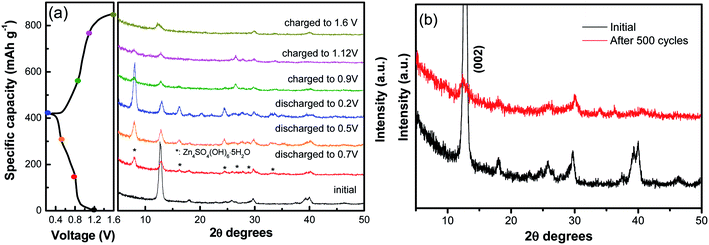
Furthermore, ex situ XRD analysis in Fig. 6 was carried out to investigate the structure evolution of the NVO nanobelts during the first charge/discharge cycle at the current density of 100 mA g−1. The obvious reflection peak at 2θ = 12.7° (d = 0.69 nm) as attributed to the (002) plane of NVO. When the electrode was discharged to 0.8 V, a few new peaks appeared at 8.0°, 16.1°, 24.5°, 26.6°, 28.7° and 32.9°, which could be indexed to a triclinic Zn4SO4(OH)6·5H2O phase (JCPDS no. 39-0688). The (002) plane of NVO becomes weaker and slightly shifted toward higher 2θ positions from 12.7° to 12.9°. With more Zn2+ intercalated into the electrode from 0.8 V to 0.2 V, the reflection peaks of Zn4SO4(OH)6·5H2O are gradually strengthened, and the (002) plane of NVO continuously shifted to a higher 2θ position (13.0°), which corresponded to an enlarged interlayer distance of 0.67 nm. This reduction in the interplanar spacing from 0.69 to 0.67 nm indicates an improvement in the structural coordination owing to the strong electrostatic interaction between the intercalated Zn2+ and the (V3O8)− layers.28 During the subsequent charging process, the reflection peaks of Zn4SO4(OH)6·5H2O gradually disappeared. The formation of this phase can be described by the following reactions:37
| 3Zn + 6OH− + Zn4SO4·xH2O + (5 − x)H2O − 6e− ↔ Zn4SO4(OH)6·5H2O | (9) |
Meanwhile, the (002) plane of NVO shifted back to a lower 2θ position from 13.0° to 12.5°, which demonstrated that the Zn2+ intercalation and extraction in NVO was highly reversible. The XRD of the electrode after 500 cycles at a current density of 5 A g−1 is investigated in Fig. 6b. The main diffraction peak corresponding to the (002) plane still remains after 500 cycles, indicating a stable structure of the sample and a highly reversible zinc ion intercalation/de-intercalation process in NaV3O8 electrode.
4. Conclusion
In this work, a facile hydrothermal reaction was developed to prepare NaV3O8 nanobelts as a promising cathode material for LIBs, NIBs and ZIBs, respectively. Compared to the electrochemical performance for LIBs and NIBs, NaV3O8 nanobelts cathode materials for ZIBs have shown excellent electrochemical performance, including high specific capacity of 421 mA h g−1 at 100 mA g−1 and good cycle stability with a capacity retention of 94% over 500 cycles at 5 A g−1. Ex situ XRD showed that the Zn2+ intercalation and extraction in NaV3O8 nanobelts was highly reversible. The capacitive behavior and good Zn ions diffusion coefficients played an important role in fast Zn2+ intercalation/extraction and long cycle stability. This work also indicates that NaV3O8 nanobelts have a great potential as a cathode material for ZIBs in large-scale electric energy storage applications.Conflicts of interest
There are no conflicts to declare.Acknowledgements
This work was supported by National Natural Science Foundation of China (No. 51772193) and Nature Science Fund of Liaoning Province (No. 20180550200).References
- C. Vaalma, D. Buchholz, M. Weil and S. Passerini, Nat. Rev. Mater., 2018, 3, 18013 CrossRef.
- D. X. Wang, X. F. Bie, Q. Fu, D. Dixon, N. Bramnik, Y. S. Hu, F. Fauth, Y. J. Wei, H. Ehrenberg, G. Chen and F. Du, Nat. Commun., 2017, 8, 15888 CrossRef CAS PubMed.
- X. Q. Xie, K. Kretschmer, B. Anasori, B. Sun, G. X. Wang and Y. Gogotsi, ACS Appl. Mater. Interfaces, 2018, 1, 505–511 CrossRef CAS.
- F. Hu, W. Jiang, Y. D. Dong, X. Y. Lai, L. Xiao and X. Wu, RSC Adv., 2017, 7, 29481–29488 RSC.
- Y. Y. Zhao, Q. Pang, Y. Meng, Y. Gao, C. Z. Wang, B. B. Liu, Y. J. Wei, F. Du and G. Chen, Chem.–Eur. J., 2017, 23, 13150–13157 CrossRef CAS PubMed.
- E. Y. Hu and X. Q. Yang, Nat. Mater., 2018, 17, 480–481 CrossRef CAS PubMed.
- F. Wang, O. Borodin, T. Gao, X. L. Fan, W. Sun, F. D. Han, A. Faraone, J. A. Dura, K. Xu and C. S. Wang, Nat. Mater., 2018, 17, 543–549 CrossRef CAS PubMed.
- F. Wan, L. L. Zhang, X. Dai, X. Y. Wang, Z. Q. Niu and J. Chen, Nat. Commun., 2018, 9, 1656 CrossRef PubMed.
- M. H. Alfaruqi, S. Islam, J. Gim, J. J. Song, S. J. Kim, D. T. Pham, J. Jo, Z. L. Xiu, V. Mathew and J. Kim, Chem. Phys. Lett., 2016, 650, 64–68 CrossRef CAS.
- N. Zhang, F. Y. Cheng, J. X. Liu, L. B. Wang, X. H. Long, X. S. Liu, F. J. Li and J. Chen, Nat. Commun., 2017, 8, 405 CrossRef PubMed.
- M. H. Alfaruqi, V. Mathew, J. Gim, S. Kim, J. Song, J. P. Baboo, S. H. Choi and J. Kim, Chem. Mater., 2015, 27, 3609–3620 CrossRef CAS.
- N. Zhang, F. Y. Cheng, Y. C. Liu, Q. Zhao, K. X. Lei, C. C. Chen, X. S. Liu and J. Chen, J. Am. Chem. Soc., 2016, 138, 12894–12901 CrossRef CAS PubMed.
- L. M. Zhu, W. X. Li, L. L. Xie, Q. Yang and X. Y. Cao, Chem. Eng. J., 2019, 372, 1056–1065 CrossRef CAS.
- L. F. Cao, L. Chen, Z. Huang, Y. F. Kuang, H. H. Zhou and Z. X. Chen, ChemElectroChem, 2016, 3, 122–129 CrossRef CAS.
- Z. X. Chen, F. Xu, S. N. Cao, Z. F. Li, H. X. Yang, X. P. Ai and Y. L. Cao, Small, 2017, 13, 1603148 CrossRef PubMed.
- S. Q. Liang, J. Zhou, G. Z. Fang, C. Zhang, J. Wu, Y. Tang and A. Q. Pan, Electrochim. Acta, 2014, 130, 119–126 CrossRef CAS.
- J. K. Kim, B. Senthilkumar, H. S. Sun, J. H. Kim, M. F. Chi and Y. Kim, ACS Appl. Mater. Interfaces, 2015, 12, 7025 CrossRef PubMed.
- D. Kundu, B. D. Adams, V. Duffort, S. H. Vajargah and L. F. Nazar, Nat. Energy, 2016, 1, 16119 CrossRef CAS.
- M. Y. Yan, P. He, Y. Chen, S. Y. Wang, Q. L. Wei, K. N. Zhao, X. Xu, Q. Y. An, Y. Shuang, Y. Y. Shao, K. T. Mueller, L. Q. Mai, J. Liu and J. H. Yang, Adv. Mater., 2018, 30, 1703725 CrossRef PubMed.
- P. He, Y. L. Quan, X. Xu, M. Y. Yan, W. Yang, Q. Y. An, L. He and L. Q. Mai, Small, 2017, 13, 1702551 CrossRef PubMed.
- D. Kundu, S. H. Vajargah, L. W. Wan, B. Adams, D. Prendergastbc and L. F. Nazar, Energy Environ. Sci., 2018, 11, 881–892 RSC.
- P. He, G. B. Zhang, X. B. Liao, M. Y. Yan, X. Xu, Q. Y. An, J. Liu and L. Q. Mai, Adv. Energy Mater., 2018, 8, 1702463 CrossRef.
- P. He, M. Y. Yan, G. B. Zhang, R. M. Sun, L. N. Chen, Q. Y. An and L. Q. Mai, Adv. Energy Mater., 2017, 7, 1601920 CrossRef.
- B. Sambandam, V. Soundharrajan, S. Kim, M. H. Alfaruqi, J. Jo, S. Kim, V. Mathew, Y. K. Sun and J. Kim, J. Mater. Chem. A, 2018, 6, 3850 RSC.
- Y. S. Cai, F. Liu, Z. G. Luo, G. Z. Fang, J. Zhou, A. Q. Pan and S. Q. Liang, Energy Storage Materials, 2018, 13, 168–174 CrossRef.
- H. N. He, G. H. Jin, H. Y. Wang, X. B. Huang, Z. H. Chen, D. Sun and Y. G. Tang, J. Mater. Chem. A, 2014, 2, 3563–3570 RSC.
- P. Hu, T. Zhu, X. P. Wang, X. J. Wei, M. Y. Yan, J. T. Li, W. Luo, W. Yang, W. C. Zhang, L. Zhou, Z. Q. Zhou and L. Q. Mai, Nano Lett., 2018, 18, 1758–1763 CrossRef CAS PubMed.
- V. Soundharrajan, B. Sambandam, S. Kim, M. H. Alfaruqi, D. Y. Putro, J. Jo, S. Kim, V. Mathew, Y. K. Sun and J. Kim, Nano Lett., 2018, 18, 2402–2410 CrossRef CAS PubMed.
- Q. Pang, C. L. Sun, Y. H. Yu, K. N. Zhao, Z. Y. Zhang, P. M. Voyles, G. Chen, Y. J. Wei and X. D. Wang, Adv. Energy Mater., 2018, 8, 1800144 CrossRef.
- F. Hu, W. Jiang, Y. D. Dong, X. Y. Lai, L. Xiao and X. Wu, RSC Adv., 2017, 7, 29481–29488 RSC.
- G. L. Li, Z. Yang, Y. Jiang, C. H. Jin, W. Huang, X. L. Ding and Y. H. Huang, Nano Energy, 2016, 25, 211–217 CrossRef CAS.
- C. Xia, J. Guo, P. Li, X. X. Zhang and H. N. Alshareef, Angew. Chem., Int. Ed., 2018, 57, 3943–3948 CrossRef CAS PubMed.
- D. Wang, Q. Wei, J. Sheng, P. Hu, M. Yan, R. Sun, X. Xu, Q. Y. An and L. Q. Mai, Phys. Chem. Chem. Phys., 2016, 18, 12074–12079 RSC.
- J. Wang, J. Polleux, A. J. Lim and B. Dunn, J. Phys. Chem. C, 2017, 111, 14925 CrossRef.
- W. Weppner and R. A. Huggins, J. Electrochem. Soc., 1977, 124, 1569–1578 CrossRef CAS.
- X. H. Rui, N. Ding, J. Liu, C. Li and C. H. Chen, Electrochim. Acta, 2010, 55, 2384–2390 CrossRef CAS.
- G. P. Chen, S. B. Sang, K. L. Huang, Y. G. Tang, Z. Q. Tang and Z. H. Yang, Trans. Nonferrous Met. Soc. China, 2004, 14, 456–458 CAS.
| This journal is © The Royal Society of Chemistry 2019 |

