 Open Access Article
Experimental data revealing explosion characteristics of methane, air, and coal mixtures
Jun Dengab,
Jiao Qu *ab,
Qiu-Hong Wangab,
Yang Xiao
 ab,
Yu-Chi Chengc and
Chi-Min Shu
 *c
*c
aSchool of Safety Science and Engineering, Xi'an University of Science and Technology, No. 58, Yanta Mid. Rd., Xi'an, Shaanxi 710054, PR China. E-mail: qujiao3131@163.com
bShaanxi Key Laboratory of Prevention and Control of Coal Fire, No. 58, Yanta Mid. Rd., Xi'an, Shaanxi 710054, PR China
cGraduate School of Engineering Science and Technology, National Yunlin University of Science & Technology, 123, University Rd., Sec. 3, Douliou, Yunlin 64002, Taiwan, Repulic of China. E-mail: shucm@yuntech.edu.tw
First published on 8th August 2019
Abstract
Whenever air and gases mix with pulverised coal, explosions are possible. Such explosions constitute a primary category of safety concerns during coal bed methane mining. This study investigated the explosion parameters and characteristics of methane–air–coal dust mixtures by using an XKWB-1 sealed explosion system. Maximum explosion pressure (Pmax), maximum explosion pressure rise rate (dP/dt)max, and explosion index (K) were recorded and calculated. Findings showed that relative to the maximum explosion pressure of an air–methane gas mix Pmax-G, that of a gas–dust mixture Pmax-GD was elevated when a 7.0 vol% methane–air mixture coexisted with 500.0 g m−3 of coal dust in the explosion. Pmax-GD decreased as CG increased and increased as Vad increased for a methane–air–coal dust mixture. Both Pmax-GD and (dP/dt)max-GD increased first, but were diminished with an increase in CD. The Copt values of five coal samples of HC, KZD, DFS, TC, and YMZ were 400.0, 500.0, 500.0, 500.0, and 600.0 g m−3, respectively. Based on the coal dust explosion pathways, the effects of coal dust volatility on the explosion characteristics were analysed. Finally, with respect to 7.0 vol% methane, the data showed that the explosion index of a gas Kg was consistently lower than the explosion index of a gas–dust mixture Km; that is, Kg < Km.
1. Introduction
Until recently, coal bed methane (CBM) has been considered an unconventional natural gas resource. Data indicate that China has the third highest reserves of CBM globally. CBM is stored in coal seams and belongs to the family of hydrocarbon gases.1,2 Its main component is methane, which is closely associated with the raw coal mineral resource. During the mining and processing of CBM, coal rock shrinks due to changes in the matrix stress, micro-cracks appear, and coal particles emerge, which in turn produce coal powder.3,4 This fine coal powder enters the CBM gathering system with nearby airflows and forms a gas–solid two-phase flow, which is prone to accidental ignition. This likelihood of explosion due to air/coal powder/methane mixing has caused numerous accidents, some severe, during mining operations; research is required to discover possible remedial and preventative measures.For methane–air mixture, the characteristics, flame propagation and mechanism of explosion have been studied in the last decades, and some representative results have been achieved.5–10 The explosion of methane–air–coal dust mixture belongs to a gas–solid two-phase system, which is different from a methane–air mixture. The degree of violence was far greater than methane–air mixture.11–13 However, the explosion characteristics of the methane–air–coal dust mixture were found to be affected by numerous co-factors. Kundu et al.14 and Ajrash et al.15 analysed the enhanced effects of the ignition energy on explosion parameters of methane–coal dust hybrid mixtures. Li et al.16 experimentally studied the influence of initial pressure on explosion of methane–coal dust mixtures. It can be concluded that the maximum explosion overpressure and maximum rate of overpressure rise increased with the increasing of the initial pressure. Zhou et al.17 and Xu et al.18,19 researched into the effects of obstacle on methane–coal dust hybrid explosion. Other studies had examined powder suppression such as ABC, SiO2, and rock dust powder, that had prominent inhibiting effects on methane–coal dust–air mixture explosions.20 Other than powder suppression, water mist had an analogous effect.18,19,21
In addition to the explosion characteristics, the ignitability, flame deflagration and propagation properties of methane–air–coal dust mixture were explored.22–28 However, little attention has been paid to the effect of coal dust volatility on explosion characteristics of methane–air–coal dust mixtures.
The major goal of this work was to investigate the explosion characteristics of methane–air mixing with different volatility coal dusts using an XKWB-1 sealed explosion system. Based on the coal dust explosion pathways, the effect of volatility on the explosion characteristics were analysed. These data and research results could be useful for better understanding the mechanism of methane–air–coal dust mixtures.
2. Experimental
2.1. Experimental equipment
An XKWB-1 sealed explosion system was used. The device was designed and manufactured in accordance with the German Engineers' Association VDI2263 Standards and was provided by the Chongqing Branch of the Coal Science Research Institute. The experimental device was similar to a 1 m3 device, which was approved by the International Organization for Standardization and had been identified as the international general test device by the International Electrotechnical Commission.29–31The system's primary components are a sealed explosion tank, with a 30 cm inner diameter and 35 cm maximum height, a mixed gas preparation system, an ignition control system, a dust dispersal system, a data acquisition system, and a cleaning system. The experimental apparatus is depicted in Fig. 1. Explosion pressure–time curves and data were obtained. The maximum explosion pressure (Pmax) and maximum explosion pressure rise rate (dP/dt)max were obtained by analyzing the explosion pressure–time curve. The explosion index K was calculated using eqn (1):32–34
 | (1) |
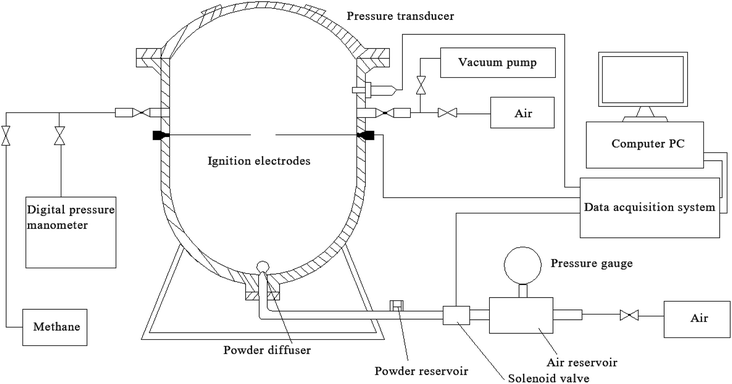 | ||
| Fig. 1 XKWB-1 sealed explosion system.29–31 | ||
2.2. Experimental method
Experimental tests on methane–air and methane–air–coal dust mixtures were conducted. The partial pressure fitting method was used to directly distribute the gas in the explosion tank. According to the ideal gas partial pressure law, the ratio of the partial pressure to the total pressure was equal to the ratio of the volume of the component gas to the total volume, as seen in eqn (2):
 | (2) |
First, a certain amount of methane and air was flushed into the explosion tank. As the methane–air mixture detonated at atmospheric pressure, a vacuum of 36.5 kPa was observed in the explosion tank. The methane–air mixture was premixed fully within 5.0 min. An initial ignition source of 10.0 kJ was delivered in the container center with a delay time of 60.0 ms. The chemical group of igniters was divided into 40.0 mass% zirconium, 30.0 mass% barium nitrate, and 30.0 mass% barium peroxide.35
At the same experimental condition, a certain mass of coal dust was added in the powder reservoir. Coal dust was dispersed into the vessel by high-pressure air through a powder diffuser and formed a coal dust cloud. The dust dispersion pressure was 1.0 MPa. As planned, the methane–air–coal dust mixture was detonated with an ignition energy of 10.0 kJ after a delay time of 60.0 ms.
2.3. Experimental samples
Methane gas was placed in a gas cylinder with a purity greater than 99.99 mass%. Five coal samples, namely HC, KZD, DFS, TC, and YMZ, were used as experimental materials, as listed in Table 1. Before conducting the experiment, the coal samples were dried at 70.0 °C for 6.0 h under controlled atmospheric conditions provided by a DZF-6050D vacuum drying oven.| Name of coal sample | Source of coal sample |
|---|---|
| HC | Yan'an formation 3–1 coal seam in Hongce coal mine in Inner Mongolia, China |
| KZD | Shihezi formation 13–1 coal seam in Kouzidong coal mine in Anhui Province, China |
| DFS | Yan'an formation no. 4 coal seam in Dafo Temple coal mine in Shaanxi Province, China |
| TC | Taiyuan formation no. 15 coal seam in Tianchi coal mine in Shanxi Province, China |
| YMZ | Shanxi formation coal seam in Yanmazhuang coal mine in Henan Province, China |
3. Results and discussion
3.1. Basic parameters of coal samples
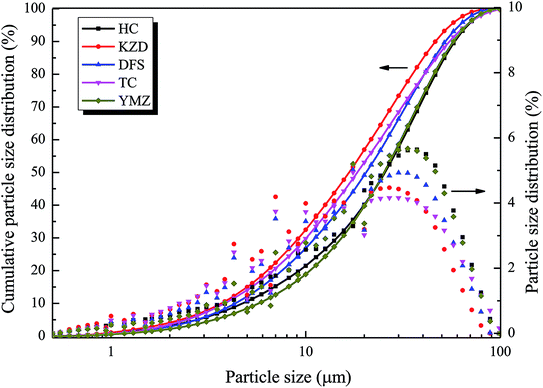
Coal is a natural polymeric material with a complex structure. The basic parameters are indispensable to further research. Laser particle size analysis can obtain the parameters, such as the median particle size (d50) and specific surface area (Sv) of the coal samples. d50 can best reflect the particle size of the dust. The particle size distribution of the coal samples was determined through MS3000 laser particle size analysis (Malvern, UK). The granulometric properties are presented in Table 2. The particle size distribution is presented in Fig. 2. As shown in Table 2, d50 of HC, KZD, DFS, TC, and YMZ measured 25.5, 16.7, 20.4, 18.4, and 25.2 μm, respectively.| Coal sample | Sv (m2 kg−1) | d(3,2) (μm) | d(4,3) (μm) | d10 (μm) | d50 (μm) | d90 (μm) | σ |
|---|---|---|---|---|---|---|---|
| HC | 563.7 | 10.6 | 28.8 | 4.75 | 25.5 | 58.2 | 2.093 |
| KZD | 731.7 | 8.2 | 21.3 | 3.69 | 16.7 | 46.4 | 2.559 |
| DFS | 614.2 | 9.8 | 24.7 | 4.35 | 20.4 | 52.1 | 2.336 |
| TC | 667.9 | 8.9 | 24.5 | 3.83 | 18.4 | 54.8 | 2.770 |
| YMZ | 497.9 | 12.1 | 28.8 | 5.73 | 25.2 | 57.2 | 2.041 |
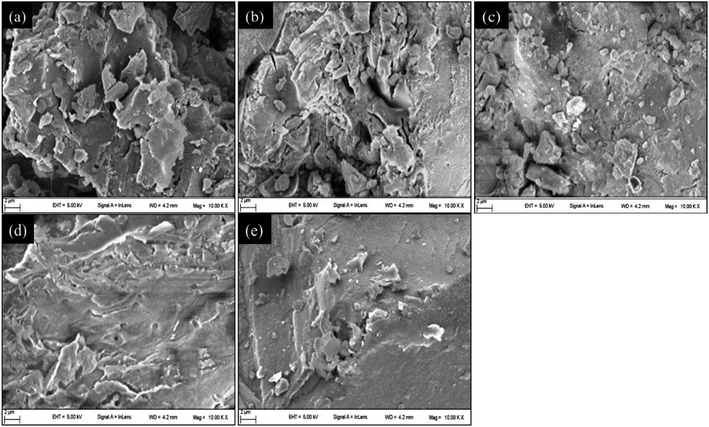
Scanning electron microscopy (SEM) was used to observe the microscopic morphology of the coal samples. To increase the conductivity of the coal samples, their surfaces were subjected to a gold plating treatment before observation, which was performed under a low vacuum state. Fig. 3 presents five images, one of each of the five samples, captured through SEM of a single coal particle (size 2 μm); images are magnified 10![[thin space (1/6-em)]](https://www.rsc.org/images/entities/char_2009.gif) 000 times. From Fig. 3, it can be seen that all the coal particles had irregular shapes and that the surfaces had pores that provided convenient passages for oxygen adsorption.
000 times. From Fig. 3, it can be seen that all the coal particles had irregular shapes and that the surfaces had pores that provided convenient passages for oxygen adsorption.
Both proximate and ultimate analyses of the five coal samples were measured using an elemental analyzer and a 5E-MAG6700 automatic industrial analyzer, respectively under air-dried conditions, the results of which are presented in Table 3. The ultimate analysis included Nad, Cad, and Had. The proximate analysis consisted of Mad, Vad, Aad, and FCad.
| Data results | HC | KZD | DFS | TC | YMZ | |
|---|---|---|---|---|---|---|
| Ultimate analysis | Nad | 0.38 | 0.54 | 0.36 | 0.32 | 0.27 |
| Cad | 68.14 | 72.33 | 72.77 | 75.71 | 66.50 | |
| Had | 4.81 | 4.81 | 4.23 | 3.76 | 3.23 | |
| Proximate analysis | Mad | 10.53 | 2.19 | 3.76 | 1.05 | 2.11 |
| Aad | 5.62 | 20.92 | 22.33 | 30.25 | 35.83 | |
| Vad | 37.25 | 31.16 | 26.52 | 18.58 | 13.59 | |
| FCad | 46.60 | 45.73 | 47.39 | 50.12 | 48.47 | |
3.2. Explosion characteristics of methane–air mixture before and after mixing with coal dust
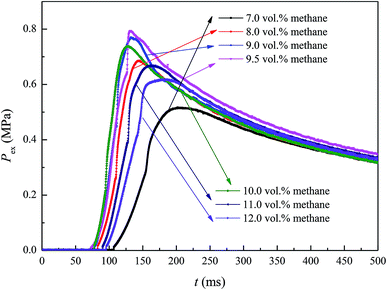
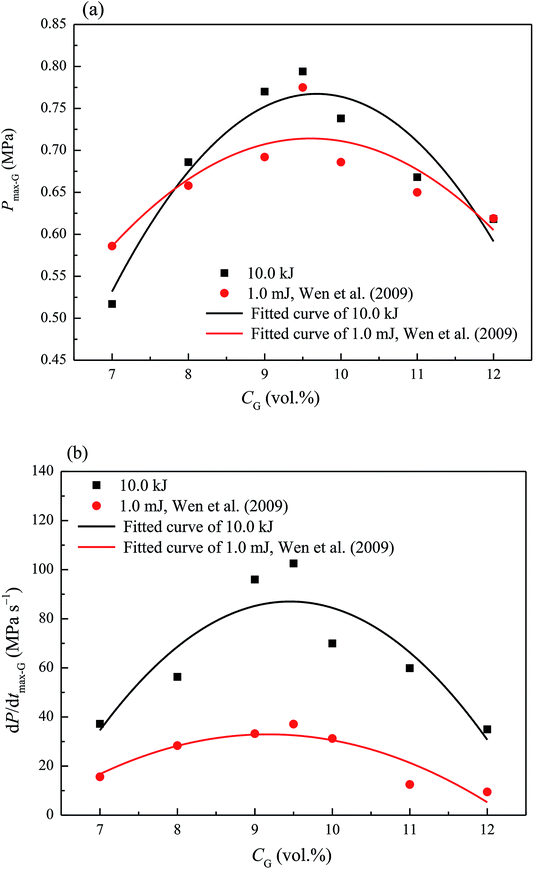
Methane concentration (CG) is a key parameter affecting methane–air mixture explosions. In the experiment, CG was in the range 7.0–12.0 vol%. The explosion pressure–time (Pex–t) curves of the methane explosion are illustrated in Fig. 4. In addition, the Pex–t curves can be divided into three stages. First, during the increase stage of Pex, the heat released by the methane explosion was higher than the heat loss around it within the tank; moreover, it continuously accumulated, resulting in an increase in Pex. Second, at the peak of Pex, the heat released by the methane explosion was equivalent to the heat loss around it. Pex reached the maximum explosion pressure Pmax, which is related to the chemical kinetics and thermodynamics. Third, the decay stage of Pex began due to the cooling effect of the vessel wall and gas leakage. From the curves shown in Fig. 4, the maximum explosion pressure of methane (Pmax-G) and maximum explosion pressure rise rate of methane (dP/dt)max-G were obtained for different methane concentrations.The evolutions of Pmax-G and (dP/dt)max-G versus CG are presented in Fig. 5. For methane–air mixtures using 7.0, 8.0, 9.0, 9.5, 10.0, 11.0, and 12.0 vol% methane volume fractions, as graphed in Fig. 5(a), Pmax-G went up first and then down with the increase in CG. An inverted “U” shape was generated in the graph. When CG was 9.5 vol%, Pmax-G reached its peak. A similar trend was noted for the influence of CG on (dP/dt)max-G (Fig. 5(b)). Any methane concentration within the range of 7.0–12.0 vol% had the potential to explode given an ignition energy of 10.0 kJ. When the methane concentration was 9.5 vol%, the methane–air explosion was the most dangerous.18 The optimal explosive volume concentration of methane was 9.5 vol% (the stoichiometric condition). The results were consistent with the results by Mittal.6 The nonlinear relationship of Pmax-G and (dP/dt)max-G versus CG can be expressed using eqn (3) and (4), respectively:
 | (3) |
 | (4) |
The ignition energy exerted a notable influence on the explosion characteristics of Pmax-G and (dP/dt)max-G. In the context of the article36 that mentioned 1.0 mJ of ignition energy, the present study discovered that the Pmax-G and (dP/dt)max-G of methane/air mixture were greater under an ignition energy of 10.0 kJ. The ignition energy played a crucial role in the initial stage of methane–air mixture explosion. The greater the ignition energy was, the greater the energy was released from the methane gas molecules, the more readily the chemical bonds of methane were broken, and the more free radicals were generated. These factors served to alleviate the time for detonation; thus, Pmax-G and (dP/dt)max-G of the methane–air mixture explosion were affected.
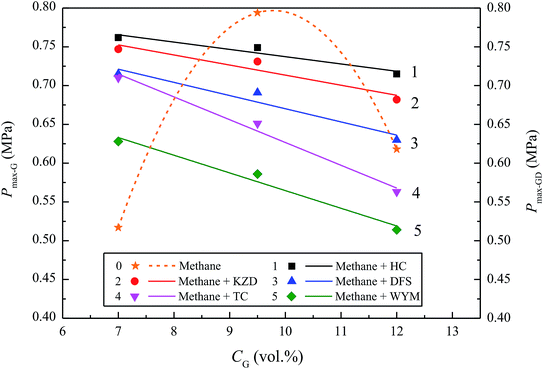
To explore the effects of the presence of coal dust on the optimal methane concentration, methane/air mixtures were mixed with HC, KZD, DFS, TC, and YMZ, sequentially and individually. The coal dust concentration was 500.0 g m−3, and the methane concentrations ranged from 7.0–12.0 vol%. The variations in Pmax with CG are shown in Fig. 6. Fig. 6 compares Pmax-G under 7.0 vol% methane and Pmax-GD when 7.0 vol% methane coexists with 500.0 g m−3 of coal dust in the explosion. Methane was first detonated, and, in turn, released an enormous amount of energy that promoted the pyrolysis of coal dust particles, which enhanced the explosive power of the coal dust. Therefore, the explosion characteristics of the coal dust were enhanced. Relative to Pmax-G, at its optimal methane concentration of 9.5 vol%, Pmax-GD was decreased when 9.5 vol% methane coexisted with 500.0 g m−3 coal dust in the explosion.
Furthermore, Pmax-GD decreased with an increase in CG in the methane–air–coal dust mixture. In the experiments, the optimal explosive concentration of methane declined from 9.5 to 7.0 vol% when mixed with coal dust, which obeyed the results of Kundu et al. The maximum explosion pressure of methane–coal dust–air mixture produced much lower than stoichiometric methane–air mixture. Moreover, for the methane concentration in 3.5–15.5 vol% discussed, it can be concluded that 6.5 vol% methane and coal dust produced an optimum hybrid mixture which generated the maximum explosion pressure.14 Examining these causes, it appears that when the methane was excessive, the oxygen was insufficient in the explosion tank, which contributed to the presence of insufficient chemical reactants, thereby inhibiting the explosion.
Apart from methane concentration and coal dust volatility, coal dust concentration also had a remarkable effect on the explosive characteristics of methane–air–coal dust mixtures.
3.3. Effects of coal dust volatility on methane–air–coal dust mixture explosion
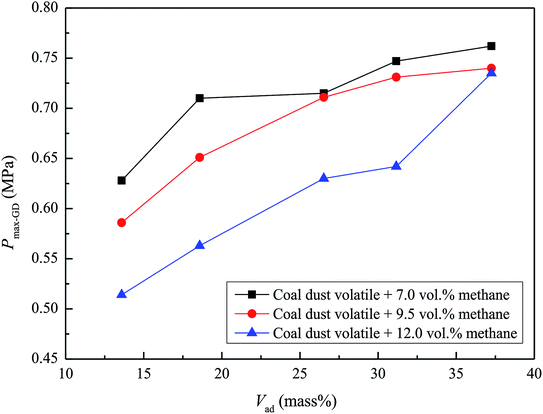
The ash in coal is an incombustible substance that tends to absorb heat, block heat radiation, destroy chain reactions, and attenuate the explosiveness of coal powder. In this study, the ash content increased in accordance with HC, KZD, DFS, TC, and YMZ. However, the volatile content also increased similarly. After the coal dust had been heated and had reached its combustion point, it began to soften. Simultaneously, the coal decomposed into liquid and flammable gas (i.e., volatile matter), which mainly consisted of water, ethane, carbon monoxide, methane, nitrogen, oxygen, hydrogen, and tar.37,38 The amount of flammable gas generated by coal decomposition dictated the speed and potential difficulty of coal combustion.39 Therefore, the volatile content of coal dust was the most crucial factor affecting the explosion of coal dust. From Table 3, the volatility of HC, KZD, DFS, TC, and YMZ was 5.62, 20.92, 22.33, 30.25, and 35.83 mass%, respectively.The Pmax-GD was tested for the mixtures of methane and 500.0 g m−3 coal dust in the air. The variations in Pmax-GD with the coal dust volatility Vad are shown in Fig. 7. As can be seen, Pmax-GD increased with an increase in Vad in a methane–air–coal dust mixture. This phenomenon was further analysed. In methane–air–coal dust mixture explosion system, the ignition energy of methane was lower than coal dust. Therefore, methane initially participated in the explosion phenomenon. The burning of methane therefore provided energy to coal dust. However, different from metal dust, coal dust can participate in the explosion by two pathways, including heterogeneous and homogeneous combustions,41–43 as shown in Fig. 8. The larger the volatile matter of coal dust, the greater the energy generated by the explosion of flammable gas of volatile matter. On the other hand, the volatile matter separated out and changed the internal structure of coke, which made the coke porous. The larger the volatile matter, the larger the surface area of the coke, the larger the area of contacted with the air, and the more readily the coke was ignited.
 | ||
| Fig. 8 Schematic diagram of the coal dust explosion pathways.40–42 | ||
3.4. Effects of coal dust concentration on methane–air–coal dust mixture explosion
Pmax-GD and (dP/dt)max-GD of the methane–air–coal dust mixture were obtained for the mixtures of 7.0 vol% methane mixed with a coal dust concentration CD of 200.0–800.0 g m−3. The variations of Pmax-GD and (dP/dt)max-GD versus CD are illustrated in Fig. 9.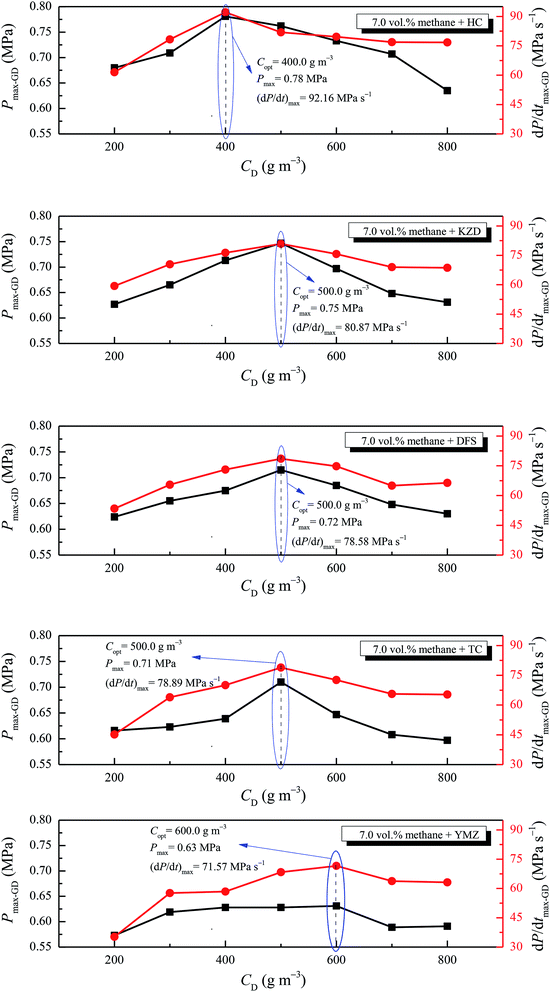 | ||
| Fig. 9 Pmax-GD and (dP/dt)max-GD of 7.0 vol% methane–air–coal dust mixture versus different coal dust concentrations. | ||
From Fig. 9, it can be observed that with the increase in CD, Pmax-GD, (dP/dt)max-GD rose gradually and reached the pressure peak at the optimal dust concentration Copt, and then Pmax-GD and (dP/dt)max-GD decreased. Furthermore, Copt values of HC, KZD, DFS, TC, and YMZ were 400.0, 500.0, 500.0, 500.0, and 600.0 g m−3, respectively. The values of Pmax-GD and (dP/dt)max-GD at the optimal dust concentration were 0.78 MPa, 92.22 MPa s−1; 0.75 MPa, 80.87 MPa s−1; 0.72 MPa, 78.58 MPa s−1; 0.71 MPa, 78.89 MPa s−1; and 0.63 MPa, 71.57 MPa s−1 for HC, KZD, DFS, TC, and YMZ, respectively. The experimental results were consistent with the results of Xu et al. Pmax-GD and (dP/dt)max-GD were peak when 7.0 vol% methane and 500.0 g m−3 coal dust were mixed.19 In their study, the mass fraction volatility of the coal dust in dry-ash-free basis (Vdaf) was 38.72 mass%, the mass fraction of ash in air-dry basis (Aad) was 8.57 mass%. According to eqn (5), the mass fraction of volatility in air-dry basis (Vad) was 35.40 mass%. Therefore, the coal sample chosen by Xu et al. belongs to a kind of bituminous coal.
 | (5) |
When coal dust concentration was Copt, the oxygen content of the system was sufficient for combustion and explosion. When methane was added, the oxygen content in the system abated, but as methane participated in the reaction, the oxidation rate of coal was improved and the heat of the system changed slightly. Accordingly, the maximum explosion pressure of the mixtures was still at its peak when the coal dust concentration was Copt. These experimental data are helpful for hazard evaluation and designing loss prevention strategies.
3.5. Explosion index of methane–air and methane–air–coal dust mixtures
The explosion index K was used as a parameter of explosion risk. It was calculated using eqn (1), as shown in Fig. 10. The Kg of 7.0 vol% methane/air mixture was 101.06 MPa m s−1. When 7.0 vol% methane/air mixture was admixed with 400.0 g m−3 HC, 500.0 g m−3 KZD, and 600.0 g m−3 YMZ, the respective Km values were 250.17, 219.52, and 194.26 MPa m s−1. It could be concluded that the explosion index followed the equation Kg < Km. Km exceeding Kg by 147.5%, 117.2%, and 92.2%, accordingly.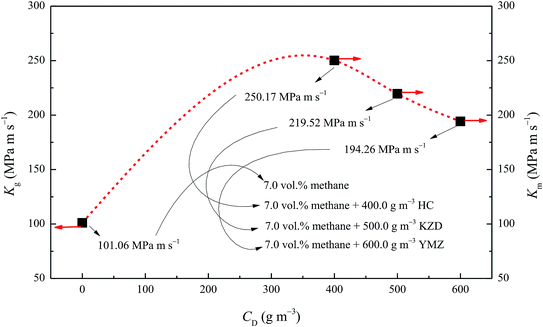 | ||
| Fig. 10 Explosion index of 7.0 vol% methane–air and 7.0 vol% methane–air–coal dust mixtures versus coal dust concentrations. | ||
From Fig. 10, it can be seen that a regular decrease in Km of methane–air–coal dust mixtures was observed by increasing the concentration of coal dust.
4. Conclusions
The methane–air and methane–air–coal dust mixtures were detonated in an XKWB-1 sealed explosion system with an ignition energy of 10.0 kJ after a 60.0 ms delay. The detailed conclusions are summarised as follows:• With the increase in CG, Pmax-G, and (dP/dt)max-G of the methane–air mixture first increased and then decreased. The optimal explosion concentration of methane was 9.5 vol%. Relative to Pmax-G, Pmax-GD increased when a 7.0 vol% methane–air mixture coexisted with 500.0 g m−3 coal dust in the explosion.
• Pmax-GD was linearly related to CG and Vad, decreased with an increase in CG, and increased with Vad for a methane–air–coal dust mixture. In the experiments, the optimal explosion concentration of methane decreased from 9.5 to 7.0 vol% when methane was mixed with coal dust.
• With the increase in CD, Pmax-GD and (dP/dt)max-GD first increased and then decreased. At the optimal dust concentration Copt, the explosive power was the strongest. The Copt values of HC, KZD, DFS, TC, and YMZ were 400.0, 500.0, 500.0, 500.0, and 600.0 g m−3, respectively.
• For a methane concentration of 7.0 vol%, it can be concluded that the explosion index obeyed the formula Kg < Km. With an increase in CD, Km decreased.
Conflicts of interest
There are no conflicts to declare.Nomenclature
| (dP/dt)max-G | Maximum explosion pressure rise rate of gas (MPa s−1) |
| (dP/dt)max-GD | Maximum explosion pressure rise rate of gas–dust mixture (MPa s−1) |
| Aad | Mass fraction of ash of coal in air-dry basis (mass%) |
| Cad | Mass fraction of carbon element of coal in air-dry basis (mass%) |
| CD | Coal dust concentration (g m−3) |
| CG | Methane volume concentration (vol%) |
| Copt | Optimal coal dust concentration for methane–air–coal dust mixture explosion (g m−3) |
| d(3,2) | Surface area mean particle size (μm) |
| d(4,3) | Volume average diameter (μm) |
| d50 | Median particle size (μm) |
| FCad | Mass fraction of fixed carbon of coal in air-dry basis (mass%) |
| Had | Mass fraction of hydrogen element of coal in air-dry basis (mass%) |
| Kg | Explosion index of gas (MPa m s−1) |
| Km | Explosion index of gas–dust mixture (MPa m s−1) |
| Mad | Mass fraction of moisture of coal in air-dry basis (mass%) |
| Nad | Mass fraction of nitrogen element of coal in air-dry basis (mass%) |
| P | Ambient atmospheric pressure (kPa) |
| Pi | Partial pressure of methane (kPa) |
| Pex | Explosion pressure of gas or dust (MPa) |
| Pmax-G | Maximum explosion pressure of gas (MPa) |
| Pmax-GD | Maximum explosion pressure of gas–dust mixture (MPa) |
| R2 | Fitting degree |
| Sv | Specific surface area (m2 kg−1) |
| V | Internal volume of explosion tank (cm3) |
| Vi | Partial volume of methane (cm3) |
| Vad | Mass fraction of volatility of coal in air-dry basis (mass%) |
| Vdaf | Mass fraction volatility of the coal dust in dry-ash-free basis (mass%) |
| σ | Particle diameter distribution width |
Acknowledgements
This study was supported by National Key Research and Development Plan (No. 2018YFC0807900), National Natural Science Foundation of China (No. 51774232, 51674193, and 51504190).References
- Z. Sun, X. F. Li, J. T. Shi, P. L. Yu, L. Huang and J. Xia, et al., A semi-analytical model for drainage and desorption area expansion during coal-bed methane production, Fuel, 2017, 204, 214–226 CrossRef CAS
.
- Y. G. Geng, D. Z. Tang, H. Xu, S. Tao, S. L. Tang and L. Ma, et al., Experimental study on permeability stress sensitivity of reconstituted granular coal with different lithotypes, Fuel, 2017, 202, 12–22 CrossRef CAS
.
- Z. Tang, S. Yang and G. Wu, Occurrence mechanism and risk assessment of dynamic of coal and rock disasters in the low-temperature oxidation process of a coal-bed methane reservoir, Energy Fuels, 2017, 31, 3602–3609 CrossRef CAS
.
- Y. Meng and Z. P. Li, Experimental study on diffusion property of methane gas in coal and its influencing factors, Fuel, 2016, 185, 219–228 CrossRef CAS
.
- M. Gieras, R. Klemens, G. Rarata and P. Wolanshi, Determination of explosion parameters of methane–air mixtures in the chamber of 40 dm3 at normal and elevated temperature, J. Loss Prev. Process Ind., 2006, 19, 263–270 CrossRef
.
- M. Mittal, Explosion pressure measurement of methane-air mixtures in different sizes of confinement, J. Loss Prev. Process Ind., 2017, 46, 200–208 CrossRef CAS
.
- S. K. Kundu, J. Zanganeh, D. Eschebach, N. Mahinpey and B. Moghtaderi, Explosion characteristics of methane–air mixtures in a spherical vessel connected with a duct, Process Saf. Environ. Prot., 2017, 111, 85–93 CrossRef CAS
.
- S. K. Kundu, J. Zanganeh and B. Moghtaderi, A review on understanding explosions from methane–air mixture, J. Loss Prev. Process Ind., 2016, 40, 507–523 CrossRef CAS
.
- M. Faghih, X. L. Gou and Z. Chen, The explosion characteristics of methane, hydrogen and their mixtures: a computational study, J. Loss Prev. Process Ind., 2016, 40, 131–138 CrossRef CAS
.
- M. Mitu, V. Giurcan, D. Razus, M. Prodan and D. Oancea, Propagation indices of methane–air explosions in closed vessels, J. Loss Prev. Process Ind., 2017, 47, 110–119 CrossRef CAS
.
- C. H. Bai, G. D. Gong, Q. M. Liu, Y. H. Chen and G. T. Niu, The explosion overpressure field and flame propagation of methane/air and methane/coal dust/air mixtures, Saf. Sci., 2011, 49, 1349–1354 CrossRef
.
- Q. Z. Li, B. Q. Lin, H. Dai and S. Zhao, Explosion characteristics of H2/CH4/air and CH4/coal dust/air mixtures, Powder Technol., 2012, 229, 222–228 CrossRef CAS
.
- S. R. Rockwell and A. R. Rangwala, Influence of coal dust on premixed turbulent methane–air flames, Combust. Flame, 2013, 160, 635–640 CrossRef CAS
.
- S. K. Kundu, J. Zanganeh, D. Eschebach and B. Moghtaderi, Explosion severity of methane–coal dust hybrid mixtures in a ducted spherical vessel, Powder Technol., 2018, 323, 95–102 CrossRef CAS
.
- M. J. Ajrash, J. Zanganeh and B. Moghtaderi, Effects of ignition energy on fire and explosion characteristics of dilute hybrid fuel in ventilation air methane, J. Loss Prev. Process Ind., 2016, 40, 207–216 CrossRef CAS
.
- Y. Li, H. L. Xu and X. S. Wang, Experimental study on the influence of initial pressure on explosion of methane–coal dust mixtures, Procedia Eng., 2013, 62, 980–984 CrossRef CAS
.
- Y. H. Zhou, M. S. Bi and F. Qi, Experimental research into effects of obstacle on methane–coal dust hybrid explosion, J. Loss Prev. Process Ind., 2012, 25, 127–130 CrossRef
.
- H. L. Xu, X. S. Wang, Y. Li, P. Zhu, H. Y. Cong and W. X. Qin, Experimental investigation of methane/coal dust explosion under influence of obstacles and ultrafine water mist, J. Loss Prev. Process Ind., 2017, 49, 929–937 CrossRef CAS
.
- H. L. Xu, X. S. Wang, R. Gu and H. P. Zhang, Experimental study on characteristics of methane–coal–dust
mixture explosion and its mitigation by ultra-fine water mist, J. Eng. Gas Turbines Power, 2012, 134, 061401 CrossRef
.
- Q. M. Liu, Y. L. Hu, C. H. Bai and M. Chen, Methane/coal dust/air explosions and their suppression by solid particle suppressing agents in a large-scale experimental tube, J. Loss Prev. Process Ind., 2013, 26, 310–316 CrossRef CAS
.
- H. You, M. G. Yu, L. G. Zheng and A. An, Study on suppression of the coal dust/methane/air mixture explosion in experimental tube by water mist, Procedia Eng., 2011, 26, 803–810 CrossRef CAS
.
- P. R. Amyotte, K. J. Mintz, M. J. Pegg and Y. H. Sun, The ignitability of coal dust-air and methane-coal dust-air mixtures, Fuel, 1993, 72, 671–679 CrossRef CAS
.
- G. V. R. Landman, Ignition behaviour of hybrid mixtures of coal dust, methane, and air, J. South. Afr. Inst. Min. Metall., 1995, 58, 45–50 Search PubMed
.
- J. G. Torrent and J. C. Fuchs, Flammability and explosion propagation of methane/coal dust hybrid mixtures, 23rd Int. Conf. Safe Min. Res. Institute, Washington, DC, USA, 1989 Search PubMed
.
- M. J. Ajrash, J. Zanganeh and B. Moghtaderi, Methane–coal dust hybrid fuel explosion properties in a large scale cylindrical explosion chamber, J. Loss Prev. Process Ind., 2016, 40, 317–328 CrossRef CAS
.
- M. J. Ajrash, J. Zanganeh and B. Moghtaderi, Impact of suspended coal dusts on methane deflagration properties in a large-scale straight duct, J. Hazard. Mater., 2017, 338, 334–342 CrossRef CAS PubMed
.
- M. J. Ajrash, J. Zanganeh and B. Moghtaderi, The flame deflagration of hybrid methane coal dusts in a large-scale detonation tube (LSDT), Fuel, 2017, 194, 491–502 CrossRef CAS
.
- Y. Liu, J. H. Sun and D. L. Chen, Flame propagation in hybrid mixture of coal dust and methane, J. Loss Prev. Process Ind., 2007, 20, 691–697 CrossRef CAS
.
- Z. M. Luo, T. Wang, J. Y. Ren, J. Deng, C. M. Shu and A. Q. Huang, et al., Effects of ammonia on the explosion and flame propagation characteristics of methane–air mixtures, J. Loss Prev. Process Ind., 2017, 47, 120–128 CrossRef CAS
.
- Z. M. Luo, T. Wang, Z. H. Tian, F. M. Cheng, J. Deng and Y. T. Zhang, Experimental study on the suppression of gas explosion using the gas–solid suppressant of CO2/ABC powder, J. Loss Prev. Process Ind., 2014, 30, 17–23 CrossRef CAS
.
- J. Deng, F. M. Cheng, Y. Song, Z. M. Luo and Y. T. Zhang, Experimental and simulation studies on the influence of carbon monoxide on explosion characteristics of methane, J. Loss Prev. Process Ind., 2015, 36, 45–53 CrossRef CAS
.
- E. V. D. Bulck, Closed algebraic expressions for the adiabatic limit value of the explosion constant in closed volume combustion, J. Loss Prev. Process Ind., 2005, 18, 35–42 CrossRef
.
- A. E. Dahoe, J. F. Zevenbergen, S. M. Lemkowitz and B. Scarlett, Dust explosions in spherical vessels: The role of flame thickness in the validity of the “cube-root law”, J. Loss Prev. Process Ind., 1996, 9, 33–44 CrossRef
.
- R. K. Eckhoff, Dust explosions in the process industries, J. Hazard. Mater., 1991, 54, 266–267 Search PubMed
.
- Q. Z. Li, K. Wang, Y. N. Zheng, M. L. Ruan, X. N. Mei and B. Q. Lin, et al., Experimental research of particle size and size dispersity on the explosibility characteristics of coal dust, Powder Technol., 2016, 292, 290–297 CrossRef CAS
.
- H. Wen, Q. H. Wang, Z. M. Luo, L. Ma and J. J. Tang, Experiment Al(OH)3 ultrafine powder suppressing methane explosion, J. Xi'an Univ. Sci. Technol., 2009, 29, 388–390 CAS
.
- Y. Xiao, S. J. Ren, J. Deng and C. M. Shu, Comparative analysis of thermokinetic behavior and gaseous products between first and second coal spontaneous combustion, Fuel, 2018, 227, 325–333 CrossRef CAS
.
- J. Deng, C. K. Lei, Y. Xiao, K. Cao, L. Ma and W. F. Wang, et al., Determination and prediction on “three zones” of coal spontaneous combustion in a gob of fully mechanized caving face, Fuel, 2018, 211, 458–470 CrossRef CAS
.
- J. Deng, L. F. Ren, L. Ma, C. K. Lei, G. M. Wei and W. F. Wang, Effect of oxygen concentration on low-temperature exothermic oxidation of pulverized coal, Thermochim. Acta, 2018, 653, 102–111 CrossRef
.
- A. Di Benedetto and P. Russo, Thermo-kinetic modelling of dust explosions, J. Loss Prev. Process Ind., 2007, 20, 303–309 CrossRef CAS
.
- Q. Z. Li, C. Zhai, H. J. Wu, B. Q. Lin and C. J. Zhu, Investigation on coal dust explosion characteristics using 20L explosion sphere vessels, J. China Coal Soc., 2011, S1, 119–124 Search PubMed
.
- S. Xu, J. Liu, W. Cao, Y. Li and W. Cao, Experimental study on the minimum ignition temperature and combustion kinetics of coal dust/air mixtures, Powder Technol., 2017, 317, 154–161 CrossRef CAS
.
- J. Deng, J. Qu, Q. H. Wang, X. W. Zhai, Y. Xiao, Y. Cheng and C. M. Shu, Minimum ignition temperature of aluminium dust clouds via the Godbert–Greenwald furnace, Process Saf. Environ. Prot., 2019, 129, 176–183 CrossRef CAS
.
| This journal is © The Royal Society of Chemistry 2019 |

