 Open Access Article
Preparation of new adsorbent-supported Fe/Ni particles for the removal of crystal violet and methylene blue by a heterogeneous Fenton-like reaction†
Jiwei Liuab,
Yufeng Dua,
Wuyang Suna,
Quanchao Changa and
Changsheng Peng *ac
*ac
aThe Key Lab of Marine Environmental Science and Ecology of Ministry of Education, Ocean University of China, Qingdao 266100, China. E-mail: pcs005@ouc.edu.cn
bSchool of Environment, Tsinghua University, Beijing, 100084, China
cSchool of Environmental and Chemical Engineering, Zhaoqing University, Zhaoqing, 526061, China
First published on 22nd July 2019
Abstract
Prepared material-supported Fe/Ni particles (PM-Fe/Ni) were produced and applied as an adsorbent, reductant and Fenton-like catalyst for removing methylene blue (MB) and crystal violet (CV) from aqueous solutions. Fe/Ni particles were prepared by reducing ferric chloride with sodium borohydride and supported on the produced porous material. Various techniques including X-ray diffraction (XRD), Brunauer–Emmett–Teller (BET), Fourier transform infrared spectroscopy (FTIR) and scanning electron microscopy analysis (SEM) were employed to characterize the crystal phase, surface area, surface morphology and functional groups. Removal experiments were conducted to study the effects of different factors such as PM-Fe/Ni dosage, initial pH, H2O2 concentration, initial concentrations and temperature on MB and CV removal. The removal efficiency of CV and MB by PM-Fe/Ni/H2O2 were 91.86% and 61.41% under the conditions of dye concentration of 1000 mg L−1, H2O2 concentration of 50 mM, PM-Fe/Ni dosage of 0.20 g and temperature of 293 K. The analysis of the degradation kinetics showed that the degradation of MB and CV followed well pseudo-first-order kinetics. A possible mechanism of removal of MB and CV was proposed, including the adsorption, reduction and dominating Fenton oxidation. The regeneration experiments of PM-Fe/Ni demonstrated that PM-Fe/Ni with H2O2 still showed a high removal efficiency after six reaction cycles.
Introduction
Crystal violet and methylene blue are two types of synthetic chemical dyes with complex aromatic structures, which are extensively applied in leather, textile and tanning industries.1 They are stable and toxic, which pose a potential risk for the environment and humans. Membrane techniques, biodegradation and adsorption are used for the removal of dyes.2 However, because of the low efficiency and high cost of these methods, there is an urgent need to develop new methods to remove these dyes.Advanced oxidation processes (AOPs) have drawn attention in recent decades and been found to be more effective for the oxidation of organic pollutants.3 Fenton process was considered to be one of the most effective AOPs for the removal of organic pollutants, which can oxidize persistent and non-biodegradable organic pollutants.4 Heterogeneous Fenton reaction includes adsorption and oxidation. Compared with traditional technologies, adsorption has some advantages such as ease of operation, low-cost and non-toxic which is widely applied for the removal of inorganic and organic pollutants from aqueous solutions. In the Fenton system, ferrous ions as a heterogeneous catalyst were used to activate H2O2 as oxidant to generate hydroxyl radicals, which own the strong oxidation power and can degrade organic pollutants to CO2 and H2O.5 However, there are still some drawbacks such as the acidic pH requirement, loss of Fe ions and production of ferric iron sludge. Various Fe-based catalysts such as Fe0 and Fe3O4 have been developed to overcome these issues.6,7
Nanoscale zero-valent iron (nZVI) is applied to remove organic pollutants and heavy metals in recent years due to its high surface energy, strong reducing activity and high surface area.8 NZVI can act as a source of dissolved Fe2+, which can activate H2O2 to produce hydroxyl radicals for Fenton-like oxidation of organic pollutants.9,10 Fenton reaction occurred when H2O2 was activated by nZVI to generate hydroxyl radicals as described in eqn (1)–(5). However, the aggregation and oxidization of nZVI make it easy to lose its reactivity and have adverse impact on Fenton oxidation rate.11 Therefore, the application of nZVI in wastewater treatment is limited. To reinforce the activation of nZVI, various supporting materials such as zeolite, activated carbon and biochar have been developed to stabilize and disperse nZVI.12 Furthermore, to improve the reactivity of nZVI, zero valent nickel is introduced as a catalyst.13 Zero valent nickel has higher reducibility toward Fe3+ and promotes the cycling of iron species in Fenton-like system. Moreover, nZVI could also promote the Fe3+/Fe2+ cycle to provide abundant Fe2+ for Fenton reaction. In addition, the photo-Fenton process can also accelerate the reduction of Fe3+ into Fe2+ which produces a large number of ·OH radicals.
| Fe0 + 2H+ → Fe2+ + H2 | (1) |
| Fe2+ + H2O2 → Fe3+ + HO˙ + OH− | (2) |
| Fe3+ + H2O2 → Fe2+ + HOO˙ + H+ | (3) |
| Fe3+ + HOO˙ → Fe2+ + O2 + H+ | (4) |
| Fe0 + 2Fe3+ → 3Fe2+ | (5) |
In this study, a kind of porous adsorbent-Fe/Ni particles was prepared as an adsorbent, reductant and Fenton-like catalyst for MB and CV removal. The porous adsorbent was prepared with solid wastes such as Enteromorpha prolifera as pore-making agent, bentonite as agglomerant and fly ash as skeletal material, which displayed large surface area, high chemical stability and high adsorption capacity. More Fe/Ni particles could attach to the pores and surface of PM. To evaluate the effectiveness of the removal of CV and MB by PM-Fe/Ni combined Fenton oxidation process, the main objective of this research includes as follows: (1) prepare and characterize PM and PM-Fe/Ni; (2) compare the effectiveness of H2O2, PM-Fe/Ni and PM-Fe/Ni with H2O2; (3) investigate the influences of vital factors like material dosage, pH, H2O2 concentration, initial concentrations and temperature on MB and CV removal; (4) probe the removal mechanisms of CV and MB; (5) evaluate the reusability of PM-Fe/Ni.
Materials and methods
Materials and reagents
Enteromorpha prolifera, bentonite and fly ash were collected from Qingdao city, China. Crystal violet (C25H30ClN3), methylene blue (C16H18ClN3S), ethanol (C2H6O), ferric chloride hexahydrate (FeCl3·6H2O), hydrogen peroxide (H2O2), sodium borohydride (NaBH4), hydrochloric acid (HCl), nickel sulfate hexahydrate (NiSO4·6H2O) and sodium hydroxide (NaOH) were purchased from Sinopharm Chemical Reagent Corporation (Beijing, China).PM-Fe/Ni preparation
The PM-Fe/Ni was made by the following method of Liu.14 The bentonite and fly ash were washed several times with distilled water and oven-dried at 85 °C for 24 h. They were crushed to pass through a 200-mesh sieve. After oven-dried at 105 °C, Enteromorpha prolifera was crushed into to pass through a 60-mesh sieve. 10 wt% Enteromorpha prolifera, 60 wt% fly ash and 30 wt% bentonite were mixed in a blender with distilled water for 30 min. Subsequently, the mixtures were made into rod-like particles using a granulator and the particles were oven-dried at 105 °C. The rod-like particles were sintered in atmosphere sintering furnace at 600 °C for 60 min with the heating rate of 10 °C min−1. We could get a prepared porous material (PM).PM-Fe/Ni was synthesized through the liquid-phase reduction method using PM as a supported material.15 In the first step, 4.52 g of FeCl3·6H2O and 0.28 g of NiSO4·6H2O were dissolved to 10 mL of distilled water and 40 mL of absolute ethanol. 3.00 g of PM was put in the above mixed solution and shaken for 24 h. Then, PM was washed with absolute ethanol. In the second step, PM was put in 50 mL of 4.00 g L−1 NaOH and 42.80 g L−1 NaBH4 mixed solution under N2 atmosphere and shaken for about 12 h. In the third step, the produced PM-Fe/Ni was washed with absolute ethanol and vacuum-dried at 65 °C. The preparation procedure of PM-Fe/Ni is displayed in Fig. S1.†
Analytical methods
The elemental analysis, the microstructure and surface morphology of PM-Fe/Ni and PM were observed by an X-ray energy dispersive spectrometer and a scanning electron microscope (SEM/EDS, JSM-6700F). The crystal structure of PM-Fe/Ni and PM were characterized by X-ray diffraction (XRD, Rigaku-Ultima IV). PM and PM-Fe/Ni were screened for surface functional groups on the PM and PM-Fe/Ni using Fourier Transform Infrared Spectroscopy (FTIR, Bruker Vertex 70). The pore size distribution and the specific surface areas of PM-Fe/Ni and PM were measured following the multipoint N2-BET adsorption method (Micromeritics' ASAP 2020). The amount of Fe0 in PM-Fe/Ni was measured by ICP.Batch experiments
In order to assess the capability of H2O2 alone, PM-Fe/Ni alone and PM-Fe/Ni with H2O2 in MB and CV removal, all batch experiments were conducted using H2O2 (50 mM), PM-Fe/Ni (0.2 g) and PM-Fe/Ni (0.2 g) with H2O2 (50 mM) put into 100 mL of 1000 mg L−1 CV and MB solutions (pH = 4.58 and 4.76) at 303 K and 120 rpm for 72 h.The influence of pH of the solution (1, 3, 5, 7), PM-Fe/Ni dosage (0.05, 0.10, 0.20, 1.00 g), H2O2 concentration (10, 50, 100, 500 mM), initial CV and MB concentration (200, 600, 1000 mg L−1) and reaction temperature (293, 303, 313 K) on MB and CV removal by PM-Fe/Ni with H2O2 were studied.
To verify the reproducibility of PM-Fe/Ni, the regeneration experiment was conducted by adding PM-Fe/Ni (0.2 g) with H2O2 (50 mM) to 100 mL 1000 mg L−1 CV and MB solutions (pH = 4.58 and 4.76) at 303 K and 120 rpm for 12 h. Afterwards, PM-Fe/Ni was separated, washed with the ethanol and vacuum-dried at 65 °C for 12 h. Fe/Ni particles were supported on PM-Fe/Ni after removal experiment once again by the liquid-phase reduction method. These procedures were repeated for four times.
The concentration of MB and CV solutions was detected by a UV-vis spectrophotometer. The removal capacity qt and efficiency R of CV and M were calculated as follows:
 | (6) |
 | (7) |
Results and discussion
Characterization of PM and PM-Fe/Ni
The morphology of PM-Fe/Ni and PM was analyzed by SEM and the result is presented in Fig. S2(a and b).† It depicts that the morphology of PM and PM-Fe/Ni had highly porous structure formed by the pyrolysis of Enteromorpha prolifera and the residual carbon as the pore-forming agent. In addition, compared to the SEM image of PM, it can be obviously seen that Fe and Ni particles successfully attach to the surface or pores of PM. Element mapping images further demonstrates the presence of Fe and Ni particles in PM-Fe/Ni (Fig. S2(c and d)†). The loading amount of Fe0 in PM-Fe/Ni was measured to be 20.36 mg g−1 by ICP. They were a spherical structure with sizes ranging from several nanometers to several microns.16 Due to the natural magnetic of ZVI, few Fe/Ni particles had a low agglomeration.17In order to confirm the presence of Fe and Ni particles and identify the crystalline phases, the XRD patterns of PM and PM-Fe/Ni samples were obtained as described in Fig. S2(e).† As observed from the XRD patterns, the main crystal phases of PM and PM-Fe/Ni were silicon dioxide. In addition, the characteristic peak of Fe0 at 44.9° in the XRD pattern of PM-Fe/Ni was observed, which indicated the existence of Fe particles and confirmed that Fe particles were successfully deposited onto the surface of PM.18 However, no diffraction peak of Ni0 in the XRD pattern of PM-Fe/Ni was observed, which may be due to the lower content of Ni particles in PM-Fe/Ni.
To examine the surface properties of PM and PM-Fe/Ni samples, the FTIR spectra of PM and PM-Fe/Ni are displayed in Fig. S2(f).† The band around 3400 cm−1 implied the existence of the OH groups on PM and PM-Fe/Ni. Furthermore, compared to the FTIR spectra of PM, the band around 3400 cm−1 became broad in the FT-IR spectra of PM-Fe/Ni, indicating the formation of hydroxyl oxidize iron layer. This also proved that Fe particles were successfully deposited onto PM. The characteristic peak around 1420 cm−1 and 1620 cm−1 were related to the COOH groups. Moreover, a new peak at 583 cm−1 was observed, which was attributed to Fe–O.19 This demonstrated that Fe particles were successfully coated onto the surface of PM and Fe particles was slightly oxidized.
To determine the pore diameter and surface area, pore size distribution and N2 adsorption–desorption isotherm were analyzed as presented in Fig. S2(g and h).† The specific surface areas of PM-Fe/Ni and PM were determined to be 20.63 m2 g−1 and 36.72 m2 g−1. According to IUPAC classifications, PM and PM-Fe/Ni exhibited a typical type IV isotherm with a narrow type H1 hysteresis loop which was caused by the mesoporous structure.20 The mean pore size of PM and PM-Fe/Ni was measured to be 3.04 nm and 2.89 nm. Pore size distribution curves indicated that PM and PM-Fe/Ni were mesoporous materials. By comparing the pore diameter and the specific surface area of PM, the pore size and specific surface area of PM-Fe/Ni decreased. The reason for this was that Fe particles occupied the pore volume after modification.21
Removal of CV and MB using H2O2 alone, PM-Fe/Ni alone, PM-Fe/Ni with H2O2
To evaluate the performance of H2O2 alone, PM-Fe/Ni alone, PM-Fe/Ni with H2O2 for MB and CV removal, the removal experiments were conducted to study the removal of CV and MB by H2O2, PM-Fe/Ni, PM-Fe/Ni with H2O2 and the results are presented in Fig. 1. Fig. 1 shows that 91.86% of CV and 61.41% of MB were removed using PM-Fe/Ni with H2O2 while 53.02% of CV and 30.78% of MB were removed using PM-Fe/Ni alone, and 16.04% of CV and 10.84% of MB were degraded using H2O2 alone. The lower removal efficiency of MB and CV using H2O2 alone was attributed to the fact that CV and MB were hardly degraded by H2O2 alone because of the weak oxidation ability of H2O2.22 The result demonstrated that the removal of CV and MB by PM-Fe/Ni was effective due to the adsorption of MB and CV onto PM-Fe/Ni and the reduction of CV by Fe and Ni particles. The CV and MB removal efficiency by PM-Fe/Ni with H2O2 was higher than that of CV and MB using H2O2 alone and PM-Fe/Ni alone. This was because that Fe2+ from the corrosion of Fe particles could activate H2O2 to generate a large amount of hydroxyl radicals (·OH) owning stronger oxidation ability, and CV and MB could be effectively oxidized into H2O and CO2 by hydroxyl radicals.23 This indicated that heterogeneous Fenton-like oxidation of CV and MB using PM-Fe/Ni with H2O2 was more effective than that of adsorption and reduction because of their different removal mechanisms. Under the same conditions, the removal efficiency of CV by PM-Fe/Ni with H2O2 was higher than that of MB. The phenomenon was explained by the fact that CV was reduced by Fe particles and Fe2+ was quickly released from the corrosion of Fe particles could quickly activate H2O2 to generate hydroxyl radicals.24 However, MB was not reduced by Fe particles and Fe2+ was only released via the corrosion of Fe particles in acidic condition.25 In addition, the other reason for this was that the structures of CV and MB were different, meaning that CV was easily degraded and MB was hardly degraded. The above PM-Fe/Ni was prepared under the optimal conditions. The effect of PM/Fe mass ratio on the removal of CV and MB by PM-Fe/Ni/H2O2 was investigated as shown in Fig. S3.† The optimal mass ratio of PM/Fe was 3![[thin space (1/6-em)]](https://www.rsc.org/images/entities/char_2009.gif) :
:![[thin space (1/6-em)]](https://www.rsc.org/images/entities/char_2009.gif) 1. This indicated that excess iron could not be loaded to PM. In addition, a comparison had been made between PM-Fe/Ni and previously reported catalyst for CV and MB removal. As can be seen Table S1,† PM-Fe/Ni as a catalyst showed excellent catalytic ability as compared to other catalysts.
1. This indicated that excess iron could not be loaded to PM. In addition, a comparison had been made between PM-Fe/Ni and previously reported catalyst for CV and MB removal. As can be seen Table S1,† PM-Fe/Ni as a catalyst showed excellent catalytic ability as compared to other catalysts.
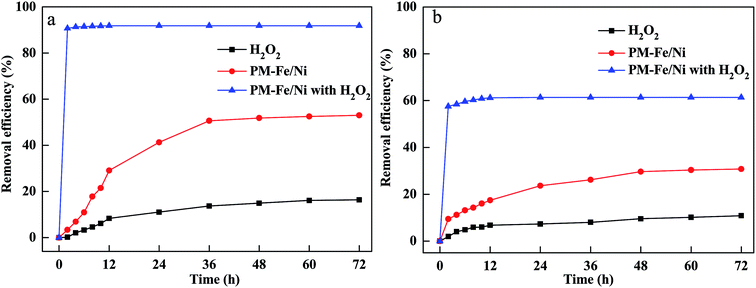 | ||
| Fig. 1 (a) Removal efficiency of CV in various processes; (b) removal efficiency of MB in various processes. | ||
Effect of some parameters on CV and MB removal by PM-Fe/Ni with H2O2
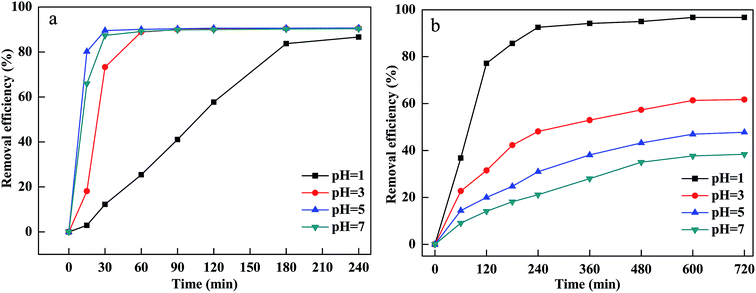
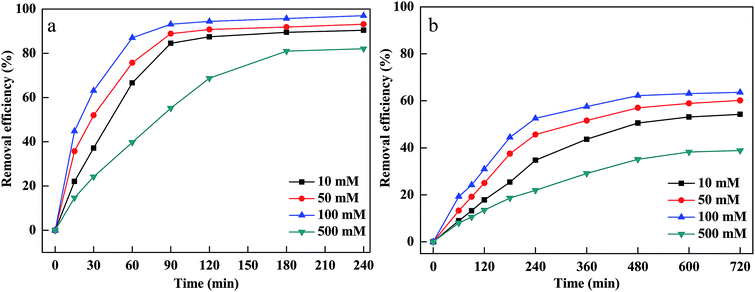
The pH of the solution affected the CV and MB removal efficiency via influencing the adsorption of MB and CV onto PM-Fe/Ni, the reduction of CV by Fe particles, the dissolution of Fe2+ from Fe particles and the activity and stability of hydrogen peroxide.26,27 Generally, pH ≤ 3 of the solution was considered to be appropriate pH value for Fenton process.28 To investigate the pH influence, the experiment was carried out at different initial pH of the solutions ranging from 1 to 7 and the results are shown in Fig. 2(a and b). As shown in Fig. 4, the removal efficiency of CV increased from 86.66% to 90.69% as the pH increased from 1 to 5. At low pH, excessive H+ ions competed with positively charged CV for the active sites of PM-Fe/Ni. Furthermore, the negatively charged material tended to absorb the positively charged CV and MB by through electrostatic attraction at high pH.29 However, at higher pH, the precipitation of iron hydroxides was formed, which was deposited onto the PM-Fe/Ni surface and covered the activity sites of PM-Fe/Ni, resulting in the release of less iron ions and restraining the reduction and oxidation of CV.7 However, the removal efficiency of MB decreased as the pH of the solution increased. At acidic conditions, Fe particles could be rapidly dissolved, which resulted in the increase of the release of Fe2+. The released Fe2+ could rapidly activate H2O2 to generate a massive amount of hydroxyl radicals, increasing the degradation rate including the reduction and oxidation rate. In general, the removal of MB was depended on pH of the solution by the dominating Fenton oxidation while the combined PM-Fe/Ni and Fenton oxidation process for removal of CV was not completely depended on pH of the solution.30 This was attributed to the fact that CV was reduced by Fe particles and Fe2+ was quickly released, which could quickly activate H2O2 to generate hydroxyl radicals. However, MB was not reduced by Fe particles and Fe2+ was only released via the corrosion of Fe particles in acidic condition. Therefore, a lower pH favored the oxidation of CV and MB and the reduction of CV. Nevertheless, a higher pH was conductive to the adsorption of CV and MB onto the surface of PM-Fe/Ni. A comprehensive result was shown in Fig. 2(a and b).The oxidant concentration played an important role related to the number of hydroxyl radicals during the Fenton oxidation process.31 The influence of H2O2 concentration was investigated by varying initial H2O2 concentration between 10 and 500 mM. Fig. 3(a and b) indicates that MB and CV removal efficiency and removal rate increased rapidly as the initial H2O2 concentration increased from 10 mM to 100 mM. This was because that a sufficient number of hydroxyl radicals were generated at higher H2O2 concentrations, which was beneficial to the degradation of CV and MB.32 However, the degradation efficiency and rate of CV and MB decreased when H2O2 concentration increased to 500 mM. This was ascribed to the scavenging of hydroxyl radicals by excessive H2O2. When H2O2 concentration exceeded the critical level, excessive H2O2 would react with hydroxyl radicals and produced hydroperoxyl radicals.33
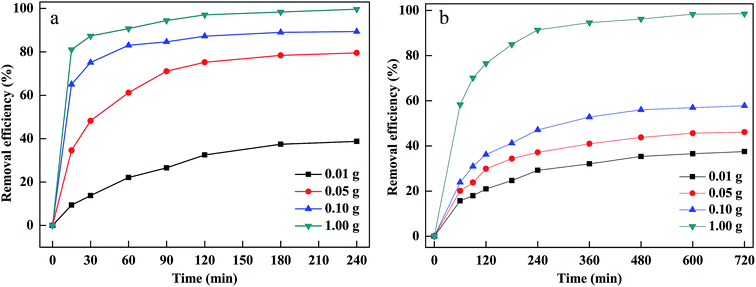
The dosage of PM-Fe/Ni was another vital parameter affecting the removal efficiency. The effect of PM-Fe/Ni dosage was studied by adding different amount of PM-Fe/Ni in range of from 0.01 to 1.00 g and the results are described in Fig. 4(a and b). When the material dosage increased from 0.01 to 1.00 g, dye removal efficiency and removal rate increased. This was due to the fact that increasing the PM-Fe/Ni dosage could provide more active sites and higher surface areas, favoring the adsorption of CV and MB.34 In addition, adding more amount of PM-Fe/Ni could introduce more Fe2+, which allowed for the greater production of hydroxyl radicals and was conductive to the oxidative degradation of CV and MB.35
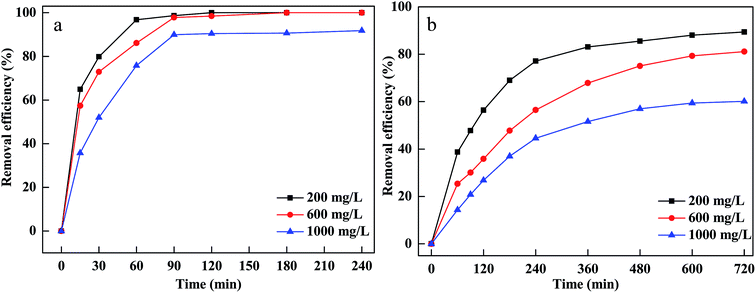
To investigate the influence of initial dyes concentration on MB and CV removal, different concentrations were used and the results are displayed in Fig. 5(a and b). The removal efficiency decreased and the equilibrium time extended when the initial concentrations increased from 200 to 1000 mg L−1. More CV and MB were adsorbed onto the pores and surface of material and occupied lots of active sites of Fe particles at a higher concentration of CV and MB.36 Afterward, the active sites become unavailable for H2O2, leading to less hydroxyl radicals generated on the surface.37
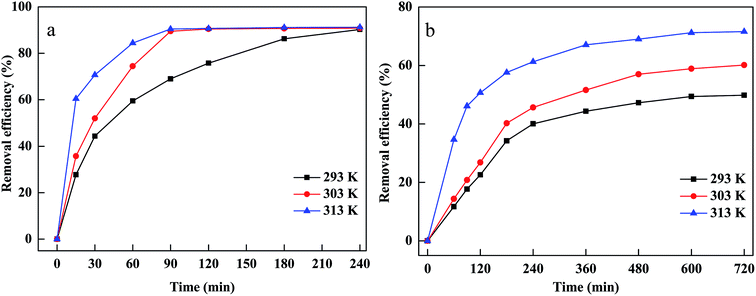
The temperature was considered to be an important parameter affecting the decomposition of H2O2 and the production of hydroxyl radicals. The effects of temperature on CV and MB removal under various temperatures ranging from 293 to 313 K are presented in Fig. 6(a and b). It is clear that CV and MB removal efficiency increased when the temperature rose from 293 to 313 K. This could be explained by the fact that the higher temperature could accelerate to decompose H2O2 to hydroxyl radicals, which meant that the number of hydroxyl radicals increased as reaction temperature increased. Moreover, a higher temperature led to higher collision frequency between hydroxyl radicals and CV and MB, resulting in a rapid degradation rate.38 In addition, MB and CV diffused rapidly from the dye solutions to the surface or the pores of material and interacted effectively with the adsorption sites at a higher temperature, suggesting that a higher temperature was conductive to the adsorption of MB and CV onto PM-Fe/Ni.39
Degradation kinetics
To describe the degradation processes, the degradation kinetics was investigated using the pseudo-first-order kinetics and the pseudo-second-order kinetics model.40The pseudo first-order expression can be presented as follows:
 | (8) |
The Arrhenius equation is given below:
 | (9) |
The pseudo second-order model equation is expressed as follows:26
 | (10) |
Various kinetics parameters were listed in Table 1. The values of R2 for the pseudo-first-order kinetics were greater than that for the pseudo-second-order kinetics, which suggested that the degradation process of CV and MB followed the pseudo-first-order kinetic model. Furthermore, the degradation rate decreased from 0.0158 to 0.0088 min−1 for CV and 0.0026 to 0.0012 min−1 for MB when the dye concentration increased from 200 mg L−1 to 1000 mg L−1.41 This demonstrated that CV and MB competed the active sites with H2O2 on the surface of PM-Fe/Ni and the reaction was through a solid–liquid reaction. On the contrary, it was obvious that a increase in temperature led to a higher degradation rate, which indicated an endothermic process. The Ea of degradation of MB and CV were 14.10 kJ mol−1 and 6.69 kJ mol−1, meaning that the degradation of MB and CV was considered to be a diffusion-controlled degradation process.42
| T (K) | C (mg L−1) | Pseudo-first-order model | Pseudo-second-order model | ||
|---|---|---|---|---|---|
| R2 | k1 (min−1) | R2 | k2 (min−1) | ||
| CV | |||||
| 303 | 200 | 0.9227 | 0.0158 | 0.9273 | 0.0285 |
| 303 | 600 | 0.9740 | 0.0103 | 0.9351 | 0.0131 |
| 303 | 1000 | 0.9073 | 0.0088 | 0.369 | 0.0122 |
| 293 | 1000 | 0.9915 | 0.0083 | 0.9564 | 0.0121 |
| 303 | 1000 | 0.9073 | 0.0088 | 0.8369 | 0.0122 |
| 313 | 1000 | 0.9039 | 0.0099 | 0.8871 | 0.0135 |
![[thin space (1/6-em)]](https://www.rsc.org/images/entities/char_2009.gif) |
|||||
| MB | |||||
| 303 | 200 | 0.9313 | 0.0026 | 0.8891 | 0.0037 |
| 303 | 600 | 0.9809 | 0.0022 | 0.9402 | 0.0035 |
| 303 | 1000 | 0.9181 | 0.0012 | 0.8290 | 0.0031 |
| 293 | 1000 | 0.9081 | 0.0009 | 0.7750 | 0.0027 |
| 303 | 1000 | 0.9181 | 0.0012 | 0.8290 | 0.0031 |
| 313 | 1000 | 0.9122 | 0.0013 | 0.8523 | 0.0033 |
Removal mechanism in Fenton-like system
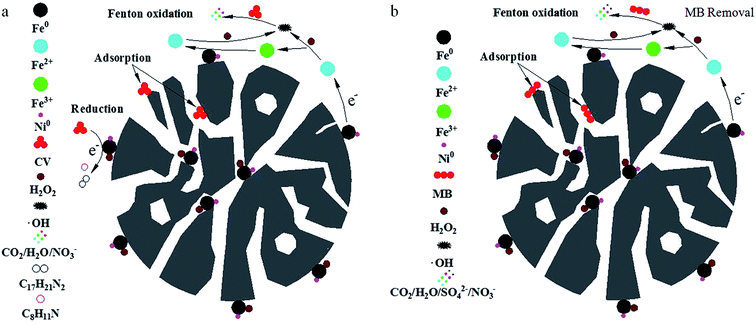
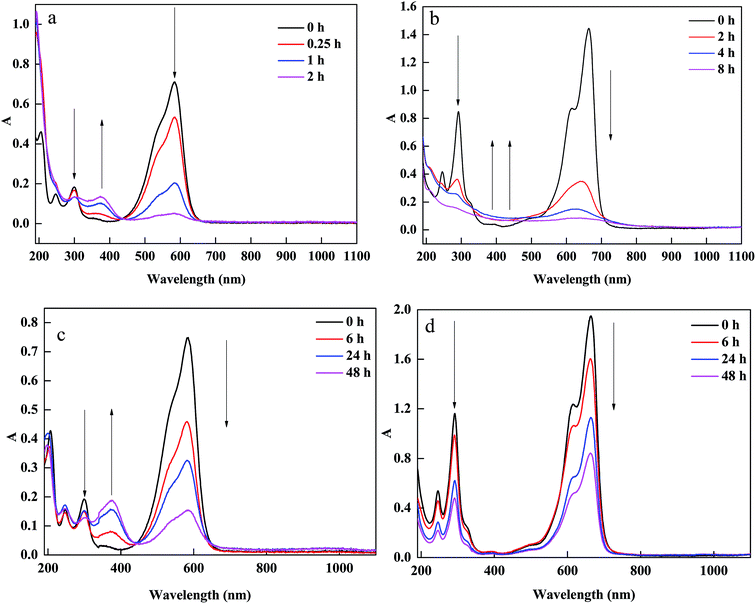
Based on the above analysis, the removal pathways of CV and MB using a combined PM-Fe/Ni and Fenton oxidation process is illustrated in Fig. 7(a and b). Firstly, CV, MB and H2O2 were diffused and subsequently adsorbed to the surface of PM-Fe/Ni and Fe/Ni particles. Secondly, the reduction of CV by Fe particles occurred along with the production of Fe2+. Fe particles were released Fe2+ under acid condition. Fe2+ reacted with H2O2 to produce hydroxyl radicals under the catalysis of Ni0, oxidizing the adsorbed CV and MB into various inorganic species, CO2 and H2O. Subsequently, Fe2+ ions were converted to Fe3+ and Fe3+ transformed to Fe2+ in the presence of Fe/Ni particles. The existence of Fe/Ni particles promoted the Fe2+/Fe3+ cycle to provide abundant Fe2+ for Fenton reaction.43 Therefore, the overall removal process included the adsorption, reduction and dominating oxidation.To further analyze CV and MB removal mechanisms by PM-Fe/Ni with H2O2 and identify the changes in the structural characteristics of MB and CV, UV-vis spectra of MB and CV during the removal process in presence of PM-Fe/Ni with and without H2O2 at different reaction time were presented in Fig. 8(a–d). Fig. 8(a and b) shows that the absorbance peaks of CV at 585 and 290 nm and MB at 464 and 290 nm ascribed to the conjugated structure and benzene ring were observed. The peaks of CV and MB in intensity rapidly diminished and finally disappeared after 120 min and 480 min, which indicated that the conjugated structure and benzene ring were destroyed and eventually degraded to CO2, H2O and inorganic salts.44,45 Possible removal mechanism of CV and MB under Fenton-like processes were described in Fig. S4.† When CV and MB were removed by PM-Fe/Ni alone, a new adsorption band at 370 nm in the spectra of CV appeared while no new band in the spectra of MB were observed (Fig. 8(c and d)). Therefore, the removal process of CV involved the reduction due to the fact that the new products formed while MB may be not reduced by Fe particles.46–50 PM-Fe/Ni after CV and MB removal was characterized by XRD as shown in Fig. S5.† It is seen that the peak of Fe0 disappeared and the peaks of Fe2O3 appeared, which indicated that Fe0 became Fe2+ to activate H2O2.51
Regeneration of PM-Fe/Ni
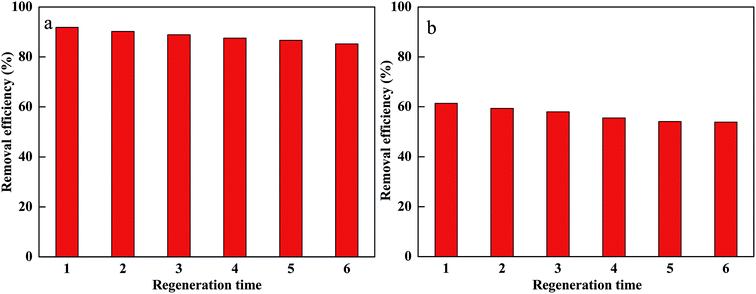
In order to evaluate the reuse of PM-Fe/Ni, the regeneration experiments were conducted for CV and MB removal using PM-Fe/Ni with H2O2.52,53 Afterwards, the material after removal experiment was washed with distilled water and vacuum-dried at 65 °C. Fe/Ni particles were supported onto PM-Fe/Ni once again. The regenerated material was reused in the removal experiment for six times. The result is presented in Fig. 9 and it indicates that there were no significant changes in catalysis capacity of PM-Fe/Ni after six cycles. This also proved that PM-Fe/Ni was a stable and recyclable adsorbent.Conclusion
In the study, Fe/Ni particles were produced by the liquid-phase reduction method and supported on prepared porous PM. PM-Fe/Ni was used as an adsorbent, reductant and catalyst for MB and CV removal. The characterization analysis indicated that Fe/Ni particles were successfully synthesized and supported on PM with sizes ranging from several nanometers to several microns. In addition, PM-Fe/Ni owned higher surface area and various functional groups. pH, PM-Fe/Ni dosage, H2O2 concentration, initial MB and CV concentration and temperature influenced the removal of MB and CV. The degradation process of MB and CV followed well the pseudo-first-order kinetic model, indicating that CV and MB removal mainly included oxidative degradation. A possible mechanism of MB and CV removal using PM-Fe/Ni with H2O2 including adsorption, reduction and dominating oxidation was proposed. PM-Fe/Ni was showed to be reusable and stable. This study demonstrated that PM-Fe/Ni with H2O2 was highly effective in removal of CV and MB.Conflicts of interest
There are no conflicts to declare.Acknowledgements
The authors acknowledge the support of the State Key Laboratory of Environmental Criteria and Risk Assessment (SKLECRA2013FP12) and the Shandong Province Key Research and Development Program (2016GSF115040).References
- J. Wu, H. Gao, S. Yao, L. Chen, Y. Gao and H. Zhang, Sep. Purif. Technol., 2015, 147, 179–185 CrossRef CAS.
- S. Chakraborty, S. Chowdhury and P. D. Saha, Carbohydr. Polym., 2011, 86, 1533–1541 CrossRef.
- E. Basturk and M. Karatas, Ultrason. Sonochem., 2014, 21, 1881–1885 CrossRef CAS PubMed.
- S. Ambika, M. Devasena and I. M. Nambi, Chem. Eng. J., 2017, 181, 847–855 Search PubMed.
- S. Chen, Y. Wu, G. Li, J. Wu, G. Meng, X. Guo and Z. Liu, Appl. Clay Sci., 2017, 136, 103–111 CrossRef CAS.
- G. B. O. D. L. Plata, O. M. Alfano and A. E. Cassano, J. Photochem. Photobiol., A, 2012, 233, 53–59 CrossRef.
- G. Vilardi, D. Sebastiani, S. Miliziano, N. Verdone and L. D. Palma, Chem. Eng. J., 2017, 335, 309–320 CrossRef.
- O. Olea-Mejía, A. Cabral-Prieto, U. Salcedo-Castillo, G. López-Tellez, O. Olea-Cardoso and R. López-Castañares, Appl. Surf. Sci., 2017, 423, 170–175 CrossRef.
- Q. Xia, Z. Jiang, J. Wang and Z. Yao, Catal. Commun., 2017, 100, 57–61 CrossRef CAS.
- X. Zhang, Y. M. Lin and Z. L. Chen, J. Hazard. Mater., 2009, 165, 923–927 CrossRef CAS PubMed.
- F. Suanon, Q. Sun, M. Li, X. Cai, Y. Zhang, Y. Yan and C. P. Yu, J. Hazard. Mater., 2016, 321, 47–53 CrossRef PubMed.
- H. Dong, J. Deng, Y. Xie, C. Zhang, Z. Jiang, Y. Cheng, K. Hou and G. Zeng, J. Hazard. Mater., 2017, 332, 79–86 CrossRef CAS PubMed.
- C. H. Lin, Y. H. Shih, J. Macfarlane and C. H. Lin, Chem. Eng. J., 2015, 262, 59–67 CrossRef CAS.
- J. Liu, M. Dai, S. Song and C. Peng, RSC Adv., 2018, 8, 32063–32072 RSC.
- E. Petala, K. Dimos, A. Douvalis, T. Bakas, J. Tucek, R. Zbořil and M. A. Karakassides, J. Hazard. Mater., 2013, 261, 295–306 CrossRef CAS PubMed.
- X. Li, Y. Zhao, B. Xi, X. Mao, B. Gong, R. Li, X. Peng and H. Liu, Appl. Surf. Sci., 2016, 370, 260–269 CrossRef CAS.
- L. Tang, J. Tang, G. Zeng, G. Yang, X. Xie, Y. Zhou, Y. Pang, Y. Fang, J. Wang and W. Xiong, Appl. Surf. Sci., 2015, 333, 220–228 CrossRef CAS.
- S. Dutta, R. Saha, H. Kalita and A. N. Bezbaruah, Environ. Technol. Innov., 2016, 5, 176–187 CrossRef.
- F. F. Wang, Y. Wu, Y. Gao, H. Li and Z. Chen, Sep. Purif. Technol., 2016, 170, 337–343 CrossRef CAS.
- J. Goscianska, M. Ptaszkowska-Koniarz, M. Frankowski, M. Franus, R. Panek and W. Franus, J. Colloid Interface Sci., 2017, 513, 72–81 CrossRef PubMed.
- A. Hethnawi, A. D. Manasrah, G. Vitale and N. N. Nassar, J. Colloid Interface Sci., 2018, 513, 28–42 CrossRef CAS PubMed.
- H. Fida, G. Zhang, S. Guo and A. Naeem, J. Colloid Interface Sci., 2016, 490, 859–868 CrossRef PubMed.
- S. H. Tian, Y. T. Tu, D. S. Chen, X. Chen and Y. Xiong, Chem. Eng. J., 2011, 169, 31–37 CrossRef CAS.
- B. H. Moon, Y. B. Park and K. H. Park, Desalination, 2011, 268, 249–252 CrossRef CAS.
- B. Yuan, J. Xu, X. Li and M. L. Fu, Chem. Eng. J., 2013, 226, 181–188 CrossRef CAS.
- B. N. Bhadra and S. H. Jhung, J. Hazard. Mater., 2017, 340, 179–188 CrossRef CAS PubMed.
- H. Li, Y. Li, L. Xiang, Q. Huang, J. Qiu, H. Zhang, M. V. Sivaiah, F. Baron, J. Barrault and S. Petit, J. Hazard. Mater., 2015, 287, 32–41 CrossRef CAS PubMed.
- D. Q. He, L. F. Wang, H. Jiang and H. Q. Yu, Chem. Eng. J., 2015, 272, 128–134 CrossRef CAS.
- B. L. Fei, N. P. Deng, J. H. Wang, Q. B. Liu, J. Y. Long, Y. G. Li and X. Mei, J. Hazard. Mater., 2017, 340, 326–335 CrossRef CAS PubMed.
- Y. Liu, G. Zhang, S. Chong, N. Zhang, H. Chang, T. Huang and S. Fang, J. Environ. Manage., 2017, 192, 150–155 CrossRef CAS PubMed.
- X. Wei, H. Wu and F. Sun, J. Colloid Interface Sci., 2017, 504, 611–619 CrossRef CAS PubMed.
- S. Zha, Y. Cheng, Y. Gao, Z. Chen, M. Megharaj and R. Naidu, Chem. Eng. J., 2014, 255, 141–148 CrossRef CAS.
- I. Mikhailov, S. Komarov, V. Levina, A. Gusev, J. P. Issi and D. Kuznetsov, J. Hazard. Mater., 2017, 321, 557–565 CrossRef CAS PubMed.
- H. Zhou, Y. Shen, L. Ping, J. Wang and L. Pu, J. Hazard. Mater., 2015, 284, 241–252 CrossRef CAS PubMed.
- W. Wang, M. Zhou, Q. Mao, J. Yue and X. Wang, Catal. Commun., 2010, 11, 937–941 CrossRef CAS.
- J. Du, W. Guo, X. Li, Q. Li, B. Wang, Y. Huang and N. Ren, J. Taiwan Inst. Chem. Eng., 2017, 81, 232–238 CrossRef CAS.
- J. Wang, C. Liu, J. Li, R. Luo, X. Hu, X. Sun, J. Shen, W. Han and L. Wang, Appl. Catal., B, 2017, 207, 316–325 CrossRef CAS.
- J. Herney-Ramirez, M. A. Vicente and L. M. Madeira, Appl. Catal., B, 2010, 98, 10–26 CrossRef CAS.
- J. H. Park, J. J. Wang, R. Xiao, N. Tafti, R. D. Delaune and D. C. Seo, Bioresour. Technol., 2018, 249, 368–376 CrossRef CAS PubMed.
- I. Grčić, S. Papić, K. Žižek and N. Koprivanac, Chem. Eng. J., 2012, 195–196, 77–90 CrossRef.
- R. Li, G. Ying, X. Jin, Z. Chen, M. Megharaj and R. Naidu, J. Colloid Interface Sci., 2013, 438, 87–93 CrossRef PubMed.
- J. Lin, M. Sun, X. Liu and Z. Chen, Chemosphere, 2017, 184, 664–672 CrossRef CAS PubMed.
- Z. Xie, C. Wang and L. Yin, J. Catal., 2017, 353, 11–18 CrossRef CAS.
- H. J. Fan, S. T. Huang, C. Wenhsin, J. Jenglyan, W. Y. Lin and C. C. Chen, J. Hazard. Mater., 2009, 171, 1032–1044 CrossRef CAS PubMed.
- Q. Wang, S. Tian, J. Long and P. Ning, Catal. Today, 2014, 224, 41–48 CrossRef CAS.
- L. Zhou, Y. Shao, J. Liu, Z. Ye, H. Zhang, J. Ma, Y. Jia, W. Gao and Y. Li, ACS Appl. Mater. Interfaces, 2014, 6, 7275–7285 CrossRef CAS PubMed.
- L. Guz, G. Curutchet, R. M. T. Sánchez and R. Candal, J. Environ. Chem. Eng., 2014, 2, 2344–2351 CrossRef CAS.
- J. Bünger, J. Stork and K. Stalder, Appl. Clay Sci., 2010, 50, 337–341 CrossRef.
- W. Lin, J. Yang, Y. Li, J. Lv and J. Zou, Chem. Eng. J., 2016, 284, 1058–1067 CrossRef.
- Y. Wang, Y. Gao, L. Chen and H. Zhang, Catal. Today, 2015, 252, 107–112 CrossRef CAS.
- L. Lyu, D. B. Yan, G. F. Yu, W. R. Cao and C. Hu, Environ. Sci. Technol., 2018, 52, 4294–4304 CrossRef CAS PubMed.
- Y. Shao, L. Zhou, B. Chao and J. Ma, Carbon, 2015, 89, 378–391 CrossRef CAS.
- W. R. Cao, M. E. Han, L. Lyu, C. Hu and F. Xiao, ACS Appl. Mater. Interfaces, 2019, 11, 16496–16505 CrossRef CAS PubMed.
Footnote |
| † Electronic supplementary information (ESI) available. See DOI: 10.1039/c9ra04710g |
| This journal is © The Royal Society of Chemistry 2019 |

