 Open Access Article
Effects of chain extender on properties and foaming behavior of polypropylene foam†
Do Young Kim,
Ji Hun Cha and
Kwan Ho Seo *
*
Department of Polymer Science and Engineering, Kyungpook National University, Daegu, 41566, Republic of Korea. E-mail: khseo@knu.ac.kr
First published on 15th August 2019
Abstract
Polypropylene (PP) foam offers superior thermal and mechanical properties and versatile applications. However, the linear structure of PP hinders the fabrication of a uniform and fine foam, owing to changes in the melt strength with variations in the temperature. The foamability of the material can be improved by fabricating modified PP by introducing long-chain branches by grafting and chain extension reactions, using glycidyl methacrylate (GMA) and adipic acid (AA). Adding 5 phr GMA to PP optimizes the graft ratio. AA as a chain extender forms a long-chain branched structure, as confirmed by the melt flow index, morphology, and thermal and dynamic viscoelastic properties. Variations in foaming characteristics according to the AA content, temperature, volume expansion ratio, and oven residence time have also been observed. An optimal volume expansion ratio of ∼14 is obtained at an AA content of 1.5 phr and foaming for 11 min at 240 °C.
1. Introduction
Polymeric foams show cellular structures that expand on using a blowing agent. The foams consist of at least two phases: a polymer matrix and gaseous voids or cells.1 Because of this unique structure, polymeric foams are lightweight and allow thermal insulation, energy absorption, and unique properties/weights that make them lucrative replacements for many conventional plastics.2 In addition, foams are widely applied in various fields such as those concerning automobiles and packing and construction materials. As a result the market for polymeric foam products has thus increased rapidly.3 The unique structure and characteristics of polymeric foams are determined by the cell density, cell size distribution, volume expansion ratio, and cell structure formed (open or closed cell). These factors are controlled by the type of polymer and foaming process technology.4 However, it is difficult to fabricate polymeric foams with the exception of those made from polystyrene (PS), polyethylene (PE), and polyurethane (PU) owing to their low melt strength in the melt state, because of the unique properties of the polymers involved, such as their crystallinity or amorphous nature, chain structure, varied molecular weights, molecular weight distribution, and glass transition behavior.5–7Polypropylene (PP) shows superior stiffness for static load in comparison to PE, impact properties than PS. Because PP has outstanding characteristics such as high melting point, tensile modulus, service temperature and excellent chemical resistance.8–10 However, it is difficult to fabricate foams from PP due to its low melt strength, which arises from its linear chain structure and narrow molecular weight distribution.5,6 The weak melt strength and high crystallization rate of PP tend to easily rupture the cells because of the low surface tension and narrow processing temperature range used in the foaming process.11 Therefore, it is necessary to increase the melt strength of PP to improve its foamability. To this end, researchers have attempted many methods such as blending with other polymers or additives, crosslinking using ionizing radiation, use of chemical agents, and introduction of long-chain branches in the main polymer chain.12–15 Among these techniques, the final one improves the melt strength of PP and can be implemented using established equipment.
In this study, PP foam with a high volume expansion ratio (VER) and uniform cells was fabricated by introducing long-chain branch structures for improving the foamability of PP. Grafted PP, made with glycidyl methacrylate (GMA) in the presence of dicumyl peroxide (DCP) and styrene (Sty), was modified with adipic acid (AA), used as a chain extender. The purpose of this study was to obtain an excellent PP foam with a fine cell structure. The mechanism of the grafting and chain extension reaction were investigated by the melt processing, and changes in the PP structure and foamability were evaluated by thermal, rheological, and morphological properties.
2. Experimental
2.1. Materials
Homo-polypropylene (PP, SEETEC H1501, melt flow index: 17 g/10 min, 230 °C, 2.16 kg) was obtained from LG Chem. For the grafting reaction, glycidyl methacrylate (GMA) and styrene (Sty) were used as received from JUNSEI Chemical Co. Ltd and Sigma-Aldrich, respectively. Dicumyl peroxide (DCP), used as an initiator, was purchased from Sigma-Aldrich and the chain extender adipic acid (AA) was received from TCI Chemicals for chain extension of the grafted PP. Phenolic and phosphite antioxidant were used for the blends (SONGNOX 1010 and SONGNOX 1680 from SONGWON). Azodicarbonamide (ADCA, KUMYANG, CELLCOM-AC series), which was used as a chemical blowing agent, was decomposed over the temperature range of ∼200–205 °C to form a 280–300 mL g−1 gas.2.2. Preparation of grafted PP by GMA and modified PP by AA
For the grafting reaction of PP, a PLASTI-CORDER lab-station with mixer W 50 EHT (BRABENDER, Germany), designed with a counter-rotating twin-screw compounder with a bowl volume of 55 cm3 and roller blades, was used. The grafted PP was produced under a barrel temperature of 170 °C with a rotation speed of 50 rpm and residence time of 3 min. After the torque was stabilized, a GMA/Sty solution with DCP was added at the same temperature and rotation speed, with an residence time of 5 min. Finally, the phenolic antioxidant was used for terminating the grafting reaction. The components used for grafting PP, with varied GMA contents, are listed in Table 1.Modified PP by AA were prepared using the grafted PP by 5 phr of GMA at barrel temperature at 170 °C with a rotation speed of 50 rpm and residence time of 5 min. The components used for modifying the PP samples that used different AA contents are given in Table 2. After pelletizing, the grafted PP samples and modified PP samples were analyzed for grafting and chain extension reactions.
| Description | PP (wt%) | GPP5 (wt%) | AA (phr) | Phenolic antioxidant (phr) | Phosphite antioxidant (phr) |
|---|---|---|---|---|---|
| PP | 100 | 0 | 0 | 0.1 | 0.3 |
| GPP | 0 | 100 | 0 | 0.1 | 0.3 |
| MPP0.5 | 0 | 100 | 0.5 | 0.1 | 0.3 |
| MPP1.0 | 0 | 100 | 1.0 | 0.1 | 0.3 |
| MPP1.5 | 0 | 100 | 1.5 | 0.1 | 0.3 |
| MPP2.0 | 0 | 100 | 2.0 | 0.1 | 0.3 |
2.3. Preparation of modified PP foam samples
Foam samples were fabricated from the modified PP samples with 10 phr ADCA using a PLASTI-CORDER with Mixer W 50 EHT (BRABENDER, Germany) at 170 °C and 50 rpm over 5 min, as shown in Table 3. The samples were cut into small pieces and compression molding was performed using a Fred S. Carver hot press to obtain circular specimens with diameters of 15 mm and thicknesses of 2 mm. The molding was carried out at 170 °C using a preheating time of 4 min and pressure of 2000 psi for 1 min and subsequent cooling.| Description | PP (wt%) | GPP5 (wt%) | AA (phr) | ADCA (phr) | |||||||||||||||||||||||||||||||||||||||||||||||||||||||||||||||||||||||||||||||||||||||||||||||
|---|---|---|---|---|---|---|---|---|---|---|---|---|---|---|---|---|---|---|---|---|---|---|---|---|---|---|---|---|---|---|---|---|---|---|---|---|---|---|---|---|---|---|---|---|---|---|---|---|---|---|---|---|---|---|---|---|---|---|---|---|---|---|---|---|---|---|---|---|---|---|---|---|---|---|---|---|---|---|---|---|---|---|---|---|---|---|---|---|---|---|---|---|---|---|---|---|---|---|---|
| a First antioxidant: 0.1 phr; second antioxidant: 0.3 phr. | |||||||||||||||||||||||||||||||||||||||||||||||||||||||||||||||||||||||||||||||||||||||||||||||||||
| PP-A5 | 100 | 0 | 0 | 5 | |||||||||||||||||||||||||||||||||||||||||||||||||||||||||||||||||||||||||||||||||||||||||||||||
| MPP-A5 | 0 | 100 | 0 | 5 | |||||||||||||||||||||||||||||||||||||||||||||||||||||||||||||||||||||||||||||||||||||||||||||||
| MPP0.5-A5 | 0 | 100 | 0.5 | 5 | |||||||||||||||||||||||||||||||||||||||||||||||||||||||||||||||||||||||||||||||||||||||||||||||
| MPP1.0-A5 | 0 | 100 | 1.0 | 5 | |||||||||||||||||||||||||||||||||||||||||||||||||||||||||||||||||||||||||||||||||||||||||||||||
| MPP1.5-A5 | 0 | 100 | 1.5 | 5 | |||||||||||||||||||||||||||||||||||||||||||||||||||||||||||||||||||||||||||||||||||||||||||||||
| MPP2.0-A5 | 0 | 100 | 2.0 | 5 | |||||||||||||||||||||||||||||||||||||||||||||||||||||||||||||||||||||||||||||||||||||||||||||||
2.4. Foaming process
The as-prepared samples were foamed using a hot-air chamber at three different temperatures (220, 230, and 240 °C) at a disk rotational speed of 30 rpm. The ORTs were 5, 7, 9, 11, 13, 15, and 18 min. For all samples, the average values of three different measurements obtained under the same foaming conditions were used.2.5. Instrumentation and equipment
Validation of the grafting and chain extension reactions was performed using Fourier transform infrared spectroscopy (FT-IR, PerkinElmer, Frontier). The grafted PP and modified PP were dissolved in xylene at 100 °C for removing unreacted monomers and various impurities and then precipitated using acetone. The precipitated samples were washed with ethanol and distilled water and dried for 24 h at 30 °C under vacuum. The graft ratio of the grafted PP specimen was compared with the constituent ratio of the PP/GMA mixture using FT-IR absorbance peaks. The components of the PP/GMA mixture are listed in Table S1.† The mixtures was produced under same conditions without initiator. After pelletizing, the mixtures were analyzed using FT-IR and determined calibration curve using linear regression analysis. As seen in Fig. S1,† the graft ratio was calculated as the ratio between constituents as indicated by the absorbance peaks corresponding to the carbonyl stretch of GMA (1730 cm−1) measured before and after the reaction:
 | (1) |
Dynamic rheological experiments were performed using a strain-controlled AR 2000ex (Ta instrument) with a 13 mm parallel plate geometry at 180 °C using a gap size of 1 mm at 0.01–100 Hz. The samples were formed into sheets by hot pressing at 170 °C. Sample discs with a diameter of 25 mm and thickness of 2 mm were prepared.
An MFI tester (MFI-10, DAVENPORT) was used to measure the melt strength of the modified PP at five different temperatures (200, 210, 220, 230, and 200 °C) with a 2.16 kg load. All the samples were cut every 30 s, and average values of five measurements were used.
The thermal properties of the modified PP were determined using differential scanning calorimetry (DSC; Q2000, TA instrument) and thermogravimetric analysis (TGA, Q500, TA instrument). For the DSC study, the samples were first heated to 200 °C at 10 °C min−1 and kept at that temperature for 1 min in a nitrogen atmosphere to eliminate previous thermal history. Then, the samples were cooled and heated from 25 to 200 °C at the rate of 10 °C min−1. The degree of crystallinity (Xc) was calculated using eqn (2),
 | (2) |
The density of the samples was acquired on an electronic densimeter (MD-200S, Mirage) by the water displacement method. The VER was calculated as the ratio between sample densities measured before (ρb) and after foaming (ρa):
 | (3) |
For all the samples, the average values of three measurements were used.
The cross-sectional morphologies of the modified PP foams were observed using a digital single lens translucent camera (DSLT, Sony α6000) and a micro-lens (Sony SEL30M35).
3. Results and discussion
3.1. Mechanism of grafting and chain extension reactions of PP
Generally, the radical grafting reaction of PP is carried out in the melt state using peroxide as an initiator. The radical is generated as the peroxide decomposes under heat, and then react with the hydrogen atoms of the PP backbone to form new radicals in the PP backbone. The radicals in PP are unstable to steric hindrance offered by the methyl groups and therefore may undergo a β-decomposition reaction, grafting reaction of the monomer and a crosslinking reaction, or partial polymerization of the monomers due to side reactions.17–19Glycidyl methacrylate (GMA) is a bifunctional monomer having both an epoxy group and an acrylic group. The acrylic group of GMA participates in the grafting reaction with other acrylic groups or vinyl groups, but the epoxy group remains in the polymer chain. Thus, it is possible to bond to other polymers or monomers having amine groups, carboxyl groups, and hydroxyl groups.20 It is known that the graft ratio is as low as 10–12% and the molecular weight of PP is greatly reduced when GMA reacts with PP in the presence of peroxide because it is difficult to react the radical of the PP backbone with GMA due to the large-size of GMA molecular.21,22 On the other hand, the graft rate and molecular weight of PP is greatly increased when GMA reacts with PP in the presence of peroxide and Sty because Sty reacts with the radicals of PP, which contributes to the generation of styryl radicals, which are more stable than the radicals in PP. The styryl radical not only stabilizes the PP radicals by resonance within the styrene benzene rings, but also reacts before the radicals of PP.23 According to reported studies, the graft efficiency of GMA is best when the ratio of GMA to styrene monomer is 1![[thin space (1/6-em)]](https://www.rsc.org/images/entities/char_2009.gif) :
:![[thin space (1/6-em)]](https://www.rsc.org/images/entities/char_2009.gif) 1.17,21,24
1.17,21,24
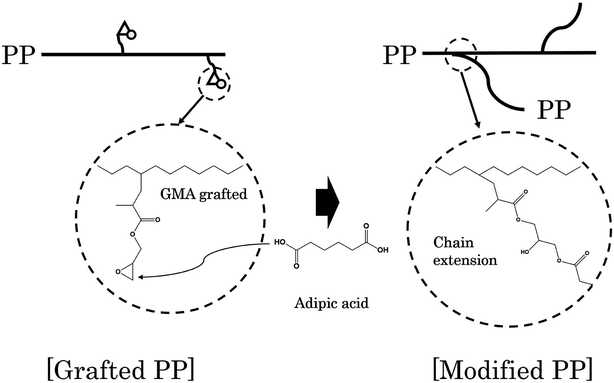
Adipic acid (AA) acts as a bifunctional monomer in chain extension, with two carboxyl groups, and can be used to bond the two polymer chains having an epoxy group and a hydroxyl group. In other words, AA reacts with the epoxy group grafted to the PP chain to form an ester group and forms a bond between the chains. A schematic diagram representing the generation of branched PP through a reaction between grafted PP and AA is shown in Fig. 1.
3.2. Characterization of grafted PP and modified PP by FT-IR
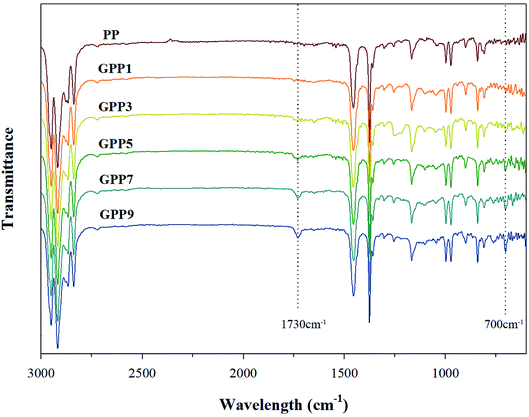
Fig. 2 shows characterization of the grafted PP with various GMA contents using FT-IR. The peaks at 1730 cm−1 and 700 cm−1 represent characteristic peaks of GMA and Sty, respectively. The peak at 1730 cm−1 in GMA, assigned to the stretching motion of the carbonyl group (C![[double bond, length as m-dash]](https://www.rsc.org/images/entities/char_e001.gif) O) in the grafted PP, was compared with that of PP.19 The obvious absorption peak at 700 cm−1 signifies the stretching motion of hydrogen atoms in the aromatic ring of styrene.17
O) in the grafted PP, was compared with that of PP.19 The obvious absorption peak at 700 cm−1 signifies the stretching motion of hydrogen atoms in the aromatic ring of styrene.17
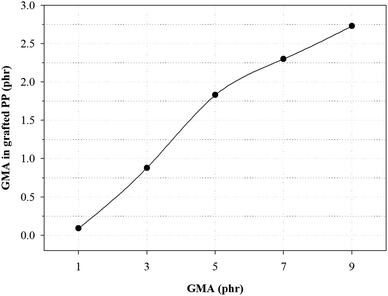
Fig. 3 and Table 4 show the variation of GMA contents and the graft ratio in the grafted PP with varying initial GMA contents for the determination of the optimal amount of GMA for the grafting reaction. With increasing GMA amount, the graft ratio of the grafted PP is increased because of increase in the grafting reaction with PP. However, the graft ratio on the grafted PP showed that when the GMA content was 5 phr, the graft ratio was the highest. As the amount of GMA increased up to 7 phr, the probability of polymerization of the GMA monomers increased.25 These results indicate that GMA and Sty were successfully grafted onto the PP and the optimal GMA content of the grafted PP was 5 phr.
| GMA (phr) | GMA in grafted PP (phr) | Graft ratio (%) |
|---|---|---|
| 1.0 | 0.09 | 9 |
| 3.0 | 0.88 | 29 |
| 5.0 | 1.83 | 37 |
| 7.0 | 2.30 | 33 |
| 9.0 | 2.73 | 30 |
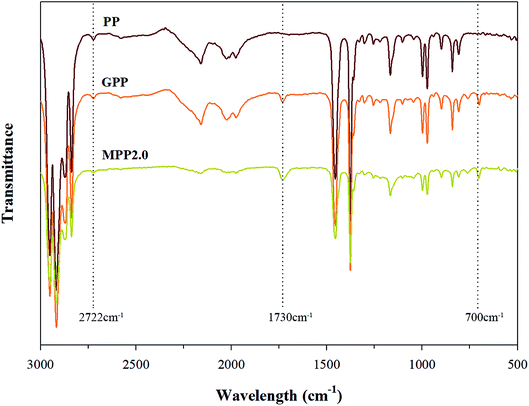
The FT-IR spectra shown in Fig. 4 confirms that MPP2.0 showed that a chain extension reaction occurred, when its results were compared to those of PP and MPP. The ester group peak close to 1730 cm−1 was assigned to the stretching motion of the carbonyl group (C![[double bond, length as m-dash]](https://www.rsc.org/images/entities/char_e001.gif) O), owing to the chain extension reaction of the epoxy group in the grafted PP with the carboxyl group of AA.26 Thus, changes in the peak was investigated for verifying the chain extension reaction of the modified PP. The absorption peak of ester group was relatively notable in MPP2.0. The 1730 cm−1 peak ratio of the ester group increased, but the ratio shown by the 700 cm−1 peak corresponding to Sty showed no difference. The result indicates that the grafted PP reacted with AA in the chain extension reaction.
O), owing to the chain extension reaction of the epoxy group in the grafted PP with the carboxyl group of AA.26 Thus, changes in the peak was investigated for verifying the chain extension reaction of the modified PP. The absorption peak of ester group was relatively notable in MPP2.0. The 1730 cm−1 peak ratio of the ester group increased, but the ratio shown by the 700 cm−1 peak corresponding to Sty showed no difference. The result indicates that the grafted PP reacted with AA in the chain extension reaction.
3.3. Rheological properties of modified PP
The linear viscoelastic behavior of polymers is strongly influenced by the molecular weight distribution, molecular chain length, and topological structure of the polymer.27 The linear viscoelastic behavior of a polyolefin polymer is related to the chain structure. To evaluate the changes in the structure occurring because of the chain extension reaction, all samples of the modified PP were analyzed using the van Gurp–Palmen plot, shear viscosities, the Cole–Cole plot, Han plot, and loss factor (tan![[thin space (1/6-em)]](https://www.rsc.org/images/entities/char_2009.gif) δ). Generally, as the structure of polymer changes from linear to branched or partially crosslinked and the molecular weight increases, the elastic property of the polymer improves.28 Furthermore, in the case of the linear polymer, when a shear force is applied, the chain of the polymer is elongated partially in the shear direction, whereas the chain of a branch and partially crosslinked polymer is loosened by chain entanglement and arranged in the shear direction. Therefore, the degree of shear thinning is remarkably affected by the relaxation of and decrease in the shear resistance and is close to 1 in the case of a linear structure.29,30 The degree of shear thinning was calculated by substituting the complex viscosity in the frequency range of 0.01–0.1 rad s−1:
δ). Generally, as the structure of polymer changes from linear to branched or partially crosslinked and the molecular weight increases, the elastic property of the polymer improves.28 Furthermore, in the case of the linear polymer, when a shear force is applied, the chain of the polymer is elongated partially in the shear direction, whereas the chain of a branch and partially crosslinked polymer is loosened by chain entanglement and arranged in the shear direction. Therefore, the degree of shear thinning is remarkably affected by the relaxation of and decrease in the shear resistance and is close to 1 in the case of a linear structure.29,30 The degree of shear thinning was calculated by substituting the complex viscosity in the frequency range of 0.01–0.1 rad s−1:
 | (4) |
In addition, the Cole–Cole plot, Han plot, and loss factor (tan![[thin space (1/6-em)]](https://www.rsc.org/images/entities/char_2009.gif) δ) demonstrated a similar a change in the viscoelastic behavior, as shown in Fig. S2–S4.†29,31
δ) demonstrated a similar a change in the viscoelastic behavior, as shown in Fig. S2–S4.†29,31
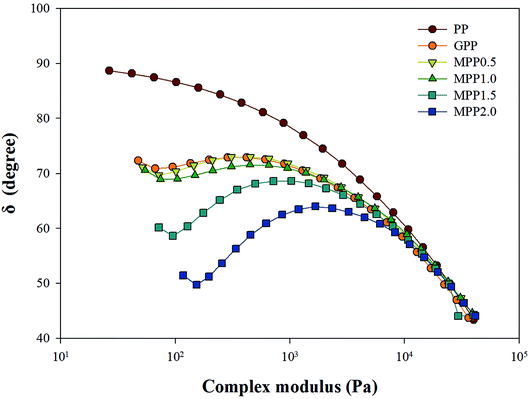
As seen in Fig. 5, all the samples showed linear viscoelastic behavior, as demonstrated by the storage modulus (G′), loss modulus (G′′), and the complex viscosity (η*). As seen in Fig. 5, it can be observed that the storage modulus (G′), loss modulus (G′′), and complex viscosity (η*) of GPP and MPP increased to a greater extent than those of PP. Additionally, the storage and loss moduli increased gradually as the AA content increased; the storage modulus (G′), in particular, increased more than the loss modulus (G′′). As for the degree of shear thinning, as shown in Table 5, for PP, it was 1.08, suggesting that it was close to a linear structure. However, with increasing AA content, the degree of shear thinning increased on introducing a branched structure. The van Gurp–Palmen plot for PP, GPP, and MPP is shown in Fig. 6. The phase difference for PP was close to  in the low-frequency range whereas it was small for GPP and MPP, confirming that the value gradually decreased as the AA content increased. The van Gurp–Palmen plot demonstrates that PP showed the viscosity behavior of a fluid and GPP and MPP exhibited more elastic behavior at 180 °C. This could be attributed to the long-chain branched and partially crosslinked structure formed through grafting and chain extension reactions.27 In other words, it was confirmed that long-chain branched and partially crosslinked structure were generated in PP by the grafting and chain extension reactions and the elastic properties were improved.27–30,32
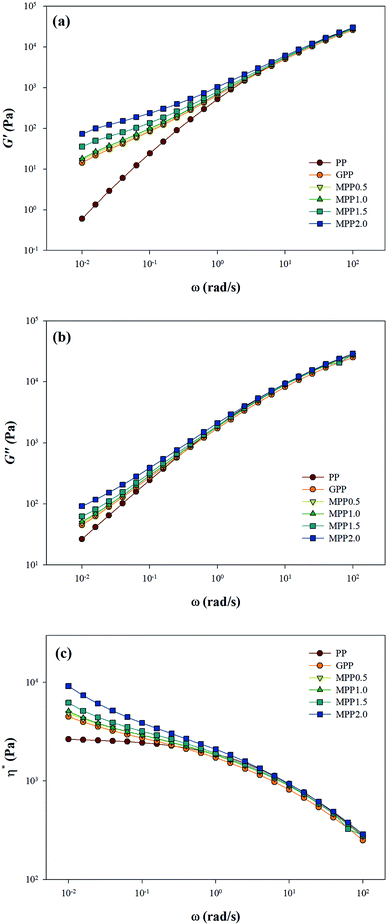 | ||
| Fig. 5 Linear viscoelastic behavior of PP, grafted PP, and modified PP samples: (a) storage modulus G′, (b) loss modulus G′′, and (c) complex viscosity, η*. | ||
| Description | Degree of shear thinning |
|---|---|
| PP | 1.08 |
| GPP | 1.64 |
| MPP0.5 | 1.67 |
| MPP1.0 | 1.75 |
| MPP1.5 | 1.95 |
| MPP2.0 | 2.36 |
3.4. Structural properties of modified PP in terms of melt flow index
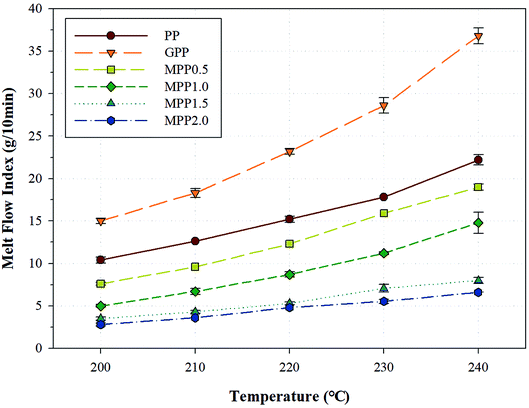
The melt strength of a polymer changes according to various factors such as the temperature, molecular weight, molecular weight distribution, addition of fillers and plasticizers, and structure of the polymer chain.33 One method for evaluating the melt flow is observing changes in the melt flow index (MFI). The change in MFI (ΔMFI) is defined as the difference between MFI values obtained at different temperatures.34,35Fig. 7 shows the MFI results obtained for PP, GPP, and MPP at various temperatures and Table S2† shows the ΔMFI values obtained between 240 and 200 °C. For PP, the MFI increased sharply due to low chain entanglement, which could be attributed to the linear chain structure and high crystallinity in the melt state. Moreover, GPP exhibited higher MFI values than PP, because of the short chains formed by β-decomposition and unreacted monomers which behaved like plasticizers during the grafting reaction.36 On the other hand, as the content of AA increased, the MFI of MPP decreased. The chain extension reaction of AA led to increase in the chain entanglement owing to the high molecular weight and the formation of a long-chain branched and partially crosslinked structure.37 This change in the value of MFI could be attributed to not only the chain structure of PP formed by AA, but the effect of the melt strength and temperature range used in the foaming process. In other words, a PP foam could be fabricated by controlling the content of AA.
3.5. Thermal properties of modified PP determined by TGA and DSC
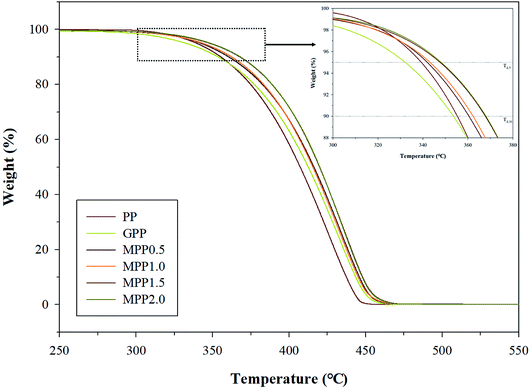
We observed the effect of the AA content by thermal analysis using DSC and TGA to confirm the crystallization and thermal stability. The TGA results are shown in Fig. 8 and Table S3,† which indicate the 5% (Td,5), 10% (Td,10), and maximum (Td,max) weight loss temperatures. All samples show a single peak in Fig. 8: the Td,5 and Td,10 of GPP is 331.5 and 352.9 °C, as shown in Table S3,† which are smaller than those of PP. This could be related to early decomposition by β-decomposition reaction (chain scission) and unreacted monomers. On the other hand, the Td,5 and Td,10 of MPP were high for high AA contents. This suggests improved thermal stability due to decreased amounts of unreacted monomers owing to the reacting AA and GMA and the formation of the partially crosslinked structure.38The DSC thermograms are shown in Fig. 9 and the crystallization temperature (Tc), melting temperature (Tm), heat of fusion (ΔHf), and degree of crystallization (Xc) are listed in Table S4.† The Tc of GPP is higher than that of PP due to the nucleating effect of GMA and the unreacted monomers. In addition, a higher Tc was observed for MPP than for GPP for higher AA contents. This could also be due to the heterogeneous nucleating effect of the long-chain branched PP.38,39 The Tm showed broad and low peaks for GPP and MPP, which could be because of changes in the size of the lamella structure and crystal structure due to restriction of movement of the isotactic PP by the long-chain branch.40 The Xc decreased with the addition of AA up to 1.5 phr (MPP1.5), because it interfered with the crystal formation by hindering the chain mobility of PP.41 However, when the content of AA was 2.0 phr, the Xc increased again. It was considered that the unreacted AA affects the nucleating agent.42 This result is in good agreement with previous findings on PP reacting with GMA and AA.
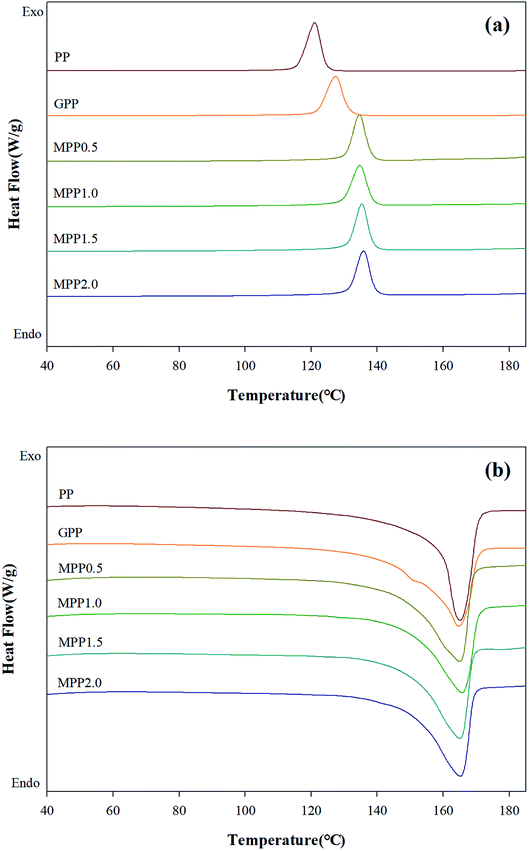 | ||
| Fig. 9 DSC thermograms of PP, grafted PP, and modified PP samples: (a) non-isothermal cooling curves and (b) heating curves. | ||
3.6. VER and cross-sectional morphology of modified PP foam
Generally, a chemical foaming process is used to fabricate foams with a chemical blowing agent and involve the steps of nucleation, growth, and stabilization.43 In the nucleation and growth steps, decomposition of the chemical blowing agent leads to an exothermic reaction, which influences the melt strength of the polymer.2,4,44–46 For this reason, the chemical foaming process is an important factor to optimize conditions such as the foaming temperature and the oven residence time (ORT).One method to optimize the foaming processing conditions in terms of the AA content is to measure the VER and cross-section morphology. To investigate the effect of the AA content on the foam characteristics, all samples were foamed using varying AA contents, temperatures (220, 230, and 240 °C), and ORTs (5, 7, 9, 11, 13, 15, and 18 min) at a fixed content of 5 phr ADCA (Fig. S5†). Fig. 10 shows the relationship between the maximum VER and the AA content at different temperatures. The VER at 220 °C increased with increasing ORT, but the maximum VER values were not reached by the PP foam, the grafted PP foam, or the modified PP foam. The VER at 240 °C increased rapidly with increasing ORT and showed a decreasing tendency beyond the maximum VER. It is widely known that the surface tension of the cell decreases for a low melt strength of the polymer at high foaming temperatures. In addition, the internal pressure of cell is higher than the surface tension, because the degradation of the blowing agent induces gas generation and pressure per unit time.22,47 Therefore, an increase in the foaming temperature could be attributed to the ORT required to reach the maximum VER decreasing. In the case of the PP foam, the maximum VER was observed to be ∼6.5 independent of the process conditions. However, for the grafted PP, the maximum VER increased to ∼11; the addition of 1.5 phr AA improved the maximum VER by ∼14. As mentioned earlier, the melt strength of the modified PP increased owing to the long-chain branched and partially crosslinked structure and held the generated gas inside the foam. However, when 2.0 phr of AA was added, the maximum VER was lower. It could be assumed that the thermal degradation of PP chain is promoted by an increase in the ORT and an excess of AA.
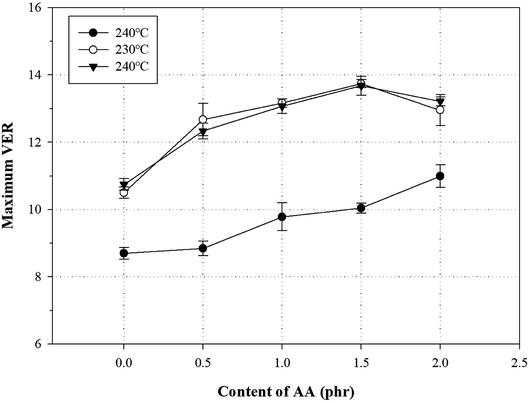 | ||
| Fig. 10 Variation of VER with AA content in grafted PP and modified PP samples at different temperatures and specific ORT. | ||
The cross-sectional morphologies at different foaming temperatures and ORTs are shown in Fig. 11. The MPP1.5 foam was compared to the PP foam in terms of the size and shapes of the cell for a fixed ADCA content of 5 phr. For the PP foam shown in Fig. 11(a), the cell size increased with the ORT and foaming temperature and the cells finally ruptured rapidly by releasing the internal gas from the foam. Furthermore, the cells appeared to be non-spherical and were unevenly shaped and fewer in number than in the MPP1.5 foam. MPP1.5 behaved similarly, as shown in Fig. 11(b), but the cell size and shapes were different and the cell ruptured slowly. In addition, the cells in the MPP1.5 foam were more regular, spherical, evenly shaped, and higher in number than in the PP foam. The difference arose from the low melt strength, owing to which the cells combined to lower the free energy of the polymer.22 Therefore, the cell size, shapes, and number in the foam were determined by the structure of the polymer at the cell growth and stabilization steps.
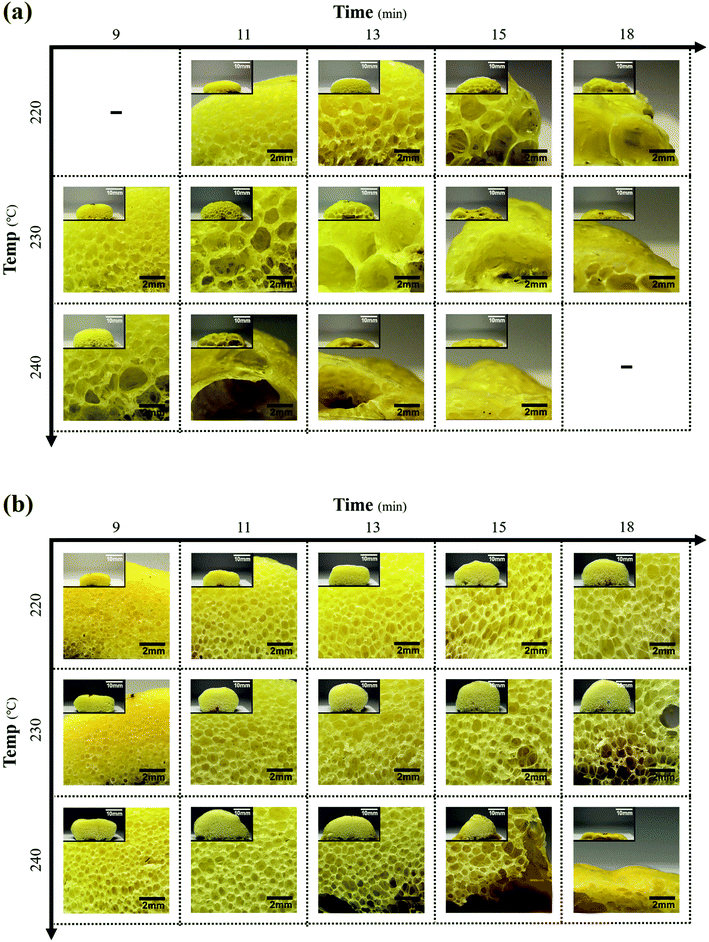 | ||
| Fig. 11 Cross-sectional microphotographs at different ORTs and temperatures for (a) PP foam and (b) MPP1.5 foam (scale bar: 2 mm; inset scale bar: 10 mm). | ||
4. Conclusions
In this study, we discussed the characterization and various properties of modified PP foams with varying contents of AA. To this end, we performed a melt mixing process with grafting and chain extension reactions and achieved uniform foams with fine cells. The chemical reactions occurred in the melt state, and the grafting reaction was confirmed by the graft ratio given by the calibration curve obtained using FT-IR. The chain extension reaction was verified by FT-IR, rheometry, MFI, TGA, and DSC. The modified PP foam was characterized according to the ORT in terms of the VER and the cross-sectional morphology. It was found that a suitable amount of AA on modified PP plays a critical role in the fabrication of the PP foam, as it affects the cell and maximum VER of the foam according to the ORT and foaming temperature.The FT-IR results showed that GMA and St were successfully grafted onto the PP and the optimal GMA content of the grafted PP was 5 phr. Furthermore, the grafted PP reacted with AA in the chain extension reaction. With increasing AA content, the storage and loss moduli of the modified PP increased gradually, owing to the formation of a long-chain branched and partially crosslinked structure of the PP. It was also confirmed that the modification affected the PP structure using van Gurp–Palmen plot analysis and MFI. TGA and DSC demonstrated that the weight loss temperature and crystallization temperature of the modified PP increased due to the heterogeneous nucleating effect of the long-chain branched PP. Further, effects of the AA content, foaming temperature, and ORT on the VER as well as the cross-sectional morphology of the modified PP foams were investigated. The maximum VER increased significantly except for MPP2.0, which could be attributed to not only the effect of the long-chain branched and partially crosslinked structure of PP, but better capture of the generated gas in the polymer matrix. In conclusion, we fabricated a PP foam using chemical reactions to change the structure and could suggest that the cell size and shapes and quantity of the PP foams were significantly affected by the foaming process. Therefore, we demonstrated a suitable method for improving the foamability of PP, which could find widespread application in research and industry.
Conflicts of interest
The authors declare that they have no competing interests.Acknowledgements
This research was supported by the National Research Foundation of Korea (NRF) grant funded by the Ministry of Science and ICT for First-Mover Program for Accelerating Disruptive Technology Development (2018M3C1B9069743).References
- C. Maier and T. Calafut, Polypropylene: The Definitive User's Guide and Databook, William Andrew, New York, 1998 Search PubMed.
- S. T. Lee, Foam Extrusion: Principles and Practice, CRC Press, Boca Raton, 2000 Search PubMed.
- Grand view research, Polymer Foam Market Size, Share & Trends Analysis Report By Type, By Application, By Region, and Segment Forecasts 2018-2025, Grand View Research, Inc., San Francisco, 2018 Search PubMed.
- S. T. Lee, C. B. Park, and N. S. Ramesh, Polymeric Foams: Science and Technology, CRC Press, Boca Raton, 2006 Search PubMed.
- S. K. Goyal, Plast. Eng., 1995, 51, 25 CAS.
- C. B. Park and L. K. Cheung, Polym. Eng. Sci., 1997, 37, 1 CrossRef CAS.
- S. Li and M. Xiao, Polymer, 2009, 50, 25 Search PubMed.
- M. Plastics, Plastics Handbook, McGraw-Hill, New York, 1994 Search PubMed.
- J. S. Colton, Mater. Manuf. Processes, 1989, 4, 253 CrossRef.
- J. K. Kocsis, Polypropylene Structure, Blends and Composites: Volume 2 Copolymers and Blends, Springer Netherlands, Dordrecht, 1995 Search PubMed.
- C. Liu, D. Wei, A. Zheng, Y. Li and H. Xiao, J. Appl. Polym. Sci., 2006, 101, 4114 CrossRef CAS.
- C. Chen and H. Pang, J. Appl. Polym. Sci., 2013, 130, 2 Search PubMed.
- G. J. Nam and J. H. Yoo, J. Appl. Polym. Sci., 2005, 96, 5 Search PubMed.
- J. Ding and W. Ma, J. Mater. Sci., 2013, 48, 6 Search PubMed.
- S. H. Shin and S. Petrov, Radiat. Phys. Chem., 2004, 69, 3 Search PubMed.
- A. K. Ahmed and M. Atiqullah, RSC Adv., 2017, 7, 67 RSC.
- L. Hou and M. Zhao, Express Polym. Lett., 2008, 2, 1 CrossRef.
- C. Rustal, PhD thesis, University of Stuttgart, 2008.
- J. G. Kim, Int. Polym. Sci. Technol., 2016, 27, 118 Search PubMed.
- X. Xu and L. Zhag, J. Macromol. Sci., Part B: Phys., 2015, 54, 32 CrossRef CAS.
- Y. J. Sun, G. H. Hu and M. Lambla, Angew. Makromol. Chem., 1995, 229, 1 CrossRef CAS.
- N. Liu and C. Xie, Polymer, 1993, 24, 22 Search PubMed.
- S. A. Malaika, Reactive Modifiers for Polymers, Springer Netherlands, Dordrecht, 1997 Search PubMed.
- Y. Rui and S. Chen, Adv. Mater. Res., 2013, 652, 418 Search PubMed.
- L. F. Chen and B. Wong, Polym. Eng. Sci., 1997, 13, 27 Search PubMed.
- Y. Li and S. Jia, Waste Manag., 2018, 76, 172 CrossRef CAS PubMed.
- H. Liu and X. Wang, Cell. Polym., 2015, 34, 2 CrossRef PubMed.
- S. G. Ku and Y. S. Kim, Appl. Chem. Eng., 2017, 28, 1 Search PubMed.
- S. J. Choi and K. H. Yoon, Polymer, 2011, 35, 4 Search PubMed.
- Y. H. Song and K. Hyun, Int. Polym. Sci. Technol., 2017, 28, 5 Search PubMed.
- M. Sugimoto, Y. Suzuki, K. Hyun, K. H. Ahn, T. Ushioda, A. Nishioka, T. Taniguchi and K. Koyama, Rheol. Acta, 2006, 46, 33 CrossRef.
- W. Zhao and G. Wu, Polymer, 2012, 51, 7 Search PubMed.
- C. Steve and W. S. Kurt, Prog. Polym. Sci., 2008, 33, 797 CrossRef.
- K. C. Seavey, Y. A. Liu and N. P. Khare, Ind. Eng. Chem. Res., 2003, 42, 5354 CrossRef CAS.
- H. C. Lau, S. N. Bhattacharya and G. Field, Int. Polym. Process., 1996, 11, 14 CrossRef.
- T. P. Russell and L. H. Sperling, Interfacial aspects of multicomponent polymer materials, Plenum Press, New York, 1997 Search PubMed.
- B. Guo and C. M. Chan, J. Appl. Polym. Sci., 1999, 71, 11 CrossRef.
- H. G. Kim, D. S. Kim and J. H. Kim, J. Text. Sci. Eng., 2010, 47, 117 CAS.
- J. Tian and W. Yu, J. Appl. Polym. Sci., 2007, 104, 6 CrossRef.
- F. O. M. S. Abreu and M. M. C. Forte, J. Appl. Polym. Sci., 2005, 95, 254 CrossRef CAS.
- S. H. Tabatabaei, Chem. Eng. Sci., 2009, 64, 16 CrossRef.
- Y. Liu and C. Zhang, J. Wuhan Univ. Technol., 2013, 28, 5 Search PubMed.
- J. H. Saunders, Handbook of Polymeric Foams and Foam Technology, Book News, Portland, 2004 Search PubMed.
- J. L. Throne, Thermoplastic Foam Extrusion, Hanser Gardner Publications, Ohio, 2004 Search PubMed.
- K. Ashida and K. Iwasaki, Handbook of Plastic Foams, Noyes, New Jersey, 1995 Search PubMed.
- H. Hurnik, Plastics Additives, Hanser, New York, 1990 Search PubMed.
- D. Y. Kim, G. H. Kim, D. Y. Lee and K. H. Seo, J. Appl. Polym. Sci., 2017, 134, 45201 CrossRef.
Footnote |
| † Electronic supplementary information (ESI) available. See DOI: 10.1039/c9ra04824c |
| This journal is © The Royal Society of Chemistry 2019 |

