DOI:
10.1039/C9RA04959B
(Paper)
RSC Adv., 2019,
9, 26676-26684
Chitosan-based activated carbon as economic and efficient sustainable material for capacitive deionization of low salinity water†
Received
1st July 2019
, Accepted 19th August 2019
First published on 27th August 2019
Abstract
Capacitive deionization (CDI) is a novel low-energy green desalination technology that has attracted much attention in recent years, especially for the desalination of low salinity water. One of the key issues in CDI is the electrode materials, and many efforts have been devoted to developing materials with high specific surface areas, appropriate pore distributions, and good electronic conductivity, in order to obtain a high salt adsorption capacity. In this study, chitosan was selected as a precursor for the preparation of high-performance chitosan-based activated carbon (CTS-AC) for use in CDI electrodes via pyrolysis and KOH activation. The results show that CTS-AC800 (activated at 800 °C) has the largest BET specific surface area (2727 m2 g−1), and exhibits an appropriate pore size distribution (<10 nm), nitrogen doping (2.0%) and good electronic conductivity (2.09 S cm−1). The CDI performance results show that the CTS-AC800 electrode has a saturated salt adsorption capacity of 14.12 mg g−1 in a 500 mg L−1 NaCl solution and retains 95% capacity after 150 adsorption–desorption cycles. Thus, chitosan is a promising, sustainable precursor for CDI electrode materials.
1. Introduction
There is significant need for the development of desalination technologies that meet the requirements of sustainability, limited discharge and improve the recovery of brine water. Traditional desalination techniques include reverse osmosis, electrodialysis, multi-stage flash distillation and multi-effect evaporation,1 which typically require high energy consumption. Capacitive deionization (CDI) is a novel alternative approach that is considered to be a clean technology for dealing with low salinity water, due to its absence of pollution, reproducibility, long service life and low energy consumption.2,3 CDI is an electric adsorption process based on forming electric double layer capacitance (EDLC).4 In the CDI charging process, salt ions are sequestered and stored in the porous electrode under voltage, while in the discharging process, salt ions are released by the short circuiting of the two electrodes. Although similar operational conditions and electric fields are needed, CDI is more attractive compared to the electro-membrane method, since the concentration polarization of the membranes induces rapid increase in the resistance, resulting in high energy consumption when low-concentration solutions are processed using electro-membrane separation.5 Therefore, CDI is more attractive than electro-membrane methods mainly due to its lower energy consumption.
The salt adsorption capacity (SAC) of a CDI electrode mainly depends on the physico-chemical properties of the electrode material,6 including its surface morphology and chemical composition, which provide reproducible capacitance for the electrosorption of ions. Recently, significant efforts have been made to develop high-performance electrode materials for capacitive deionization.7,8 Thus far, carbon materials have been most widely applied in CDI electrodes,6,9 due to their low cost, broad precursor availability, excellent capacitance, sustainability and stability. A wide variety of carbon materials such as activated carbon (AC) powders,10 AC fibres,11 mesoporous carbon,12 carbon nanotubes,13 carbon nanofibers,14 carbon aerogels,15 graphene or graphene oxide16 and their composites17,18 have been investigated for CDI applications. Biomass such as cotton,11 cocoon,19 bittertea and palm shell,20 biochar,21 sugar cane bagasse fly ash,22 coffee bean23 and fungi,24 has been widely used as a precursor for preparing AC-based materials. However, the hydrophobicity of AC repels the water solution, reducing the contact surface area of the electrode.25 Previous studies have demonstrated that doping nitrogen atoms into the carbon matrix enlarges the accessible electrode area and enhances charge accumulation, which is helpful for transferring charge during the electrosorption process and improves the specific capacitance.26,27
Chitosan, a naturally abundant polysaccharide obtained from crustacean seafood, a rich biomass source, is an excellent carbonaceous precursor.28 Source abundancy makes it not only less costly than other precursors but also environmentally friendly. Additionally, the chemical structure of chitosan contains amine groups (N-containing) and hydroxyl groups that can improve the wettability of AC products. Previous studies have demonstrated that chitosan is a suitable precursor for porous carbon materials that have been applied in supercapacitors29–37 and lithium ion batteries.34,36 However, the electrosorption behaviour of chitosan-based AC (CTS-AC) for salt ions during CDI is still unknown and worthy of study.
In this study, CTS-AC was prepared by pyrolysis and activation with KOH. The physico-chemical properties of the AC products were characterized and analyzed. The optimal activation temperature was then determined. Then, the desalination performance of CTS-AC electrodes for CDI was examined, including their SAC, average salt adsorption rate (ASAR) and stability. Finally, an economic assessment of CTS-AC production for CDI with CTS-AC electrodes was performed.
2. Experimental
2.1. Preparation of CTS-ACx and the CDI electrodes
Chitosan (degree of deacetylation, ≥95%, Aladdin Corp) was initially washed with ultrapure water and dried at 60 °C, and was then pyrolyzed at 400 °C for 2 h with a ramping rate of 5 °C min−1 under N2 atmosphere. After pyrolysis, the obtained product (denoted CTS-C) was mixed with KOH with a weight ratio of 1![[thin space (1/6-em)]](https://www.rsc.org/images/entities/char_2009.gif) :
:![[thin space (1/6-em)]](https://www.rsc.org/images/entities/char_2009.gif) 4 in ultrapure water. The mixture was then sintered for another 2 h at a temperature of 600, 700, 800 or 900 °C under N2 atmosphere with a warming-up time of 2 h. After KOH activation, the product was washed with hydrochloric acid and ultrapure water until a pH of >6 and a conductivity of <5 μS cm−1 was reached. Then the product was dried for over 24 h in an oven at 60 °C and finally chitosan-based AC, denoted CTS-ACx (where x represents the activation temperature: 600, 700, 800 and 900 °C), was obtained. The CDI electrodes were prepared by brush coating a mixture of CTS-ACx (∼50 mg) and polyvinylidene fluoride (PVDF, Alfa Aesar, Tianjin) with a weight ratio of 9
4 in ultrapure water. The mixture was then sintered for another 2 h at a temperature of 600, 700, 800 or 900 °C under N2 atmosphere with a warming-up time of 2 h. After KOH activation, the product was washed with hydrochloric acid and ultrapure water until a pH of >6 and a conductivity of <5 μS cm−1 was reached. Then the product was dried for over 24 h in an oven at 60 °C and finally chitosan-based AC, denoted CTS-ACx (where x represents the activation temperature: 600, 700, 800 and 900 °C), was obtained. The CDI electrodes were prepared by brush coating a mixture of CTS-ACx (∼50 mg) and polyvinylidene fluoride (PVDF, Alfa Aesar, Tianjin) with a weight ratio of 9![[thin space (1/6-em)]](https://www.rsc.org/images/entities/char_2009.gif) :
:![[thin space (1/6-em)]](https://www.rsc.org/images/entities/char_2009.gif) 1 onto a titanium mesh (3 × 3 cm2).
1 onto a titanium mesh (3 × 3 cm2).
2.2. Physico-chemical characterization of CTS-ACx
Thermogravimetric analyses (TGA) were performed with a thermogravimeter (TGA8000, PerkinElmer) under N2 atmosphere. The morphology of CTS-ACx was characterized with a scanning electron microscope (SEM, JSM-5800, JEOL). N2 adsorption and desorption isotherms were measured using a physisorption analyzer (ASAP-2460, Micrometrics). The specific surface area of CTS-ACx was calculated using the Brunauer–Emmett–Teller (BET) equation. The pore size distribution in CTS-ACx was calculated using a Density Functional Theory (DFT) model from the N2 sorption isotherm. The surface wettability of CTS-ACx was characterized via contact angle measurements (OCA40Micro, Dataphysics). Raman spectra were obtained using a microscopic confocal Raman spectrometer (HR800, LabRAM) with laser excitation at 633 nm. The chemical composition of CTS-ACx was analyzed using X-ray photoelectron spectroscopy (XPS, ESCALAB 250Xi, ThermoFisher Scientific) with Al Kα radiation at 1486.6 eV. The electronic conductivity measurement of powdered AC was conducted under pressure in a two-electrode system by linear sweep voltammetry (LSV) using an electrochemical workstation (VersaSTAT 4, AMETEK). The conductivity of AC was also compared with that of commercial acetylene black (AB).
The electrochemical properties of CTS-ACx were evaluated by galvanostatic charging–discharging (GC) and cyclic voltammetry (CV) using an electrochemical workstation (760E, CH Instruments) in NaCl solution. A glassy carbon electrode (GCE) was loaded with a mixture of CTS-ACx (100 μg) and PVDF (11.1 μg), denoted CTS-ACx/GCE. CTS-ACx/GCE was tested in a three-electrode system. An Ag/AgCl electrode and a platinum wire were used as the reference electrode and the counter electrode, respectively. The electrochemical properties of the CDI electrodes were evaluated by electrochemical impedance spectroscopy (EIS) and CV analyses using an electrochemical workstation (VersaSTAT 4, AMETEK). Another three-electrode system was established in 1 M NaCl solution, where the CTS-ACx electrode, a saturated calomel electrode (SCE) and a graphite sheet were used as the working electrode, the reference electrode and the counter electrode, respectively.
The specific capacitance (CS, F g−1) was calculated from the GC curve, CV curve and EIS Nyquist curve at low frequency, using the following equations (eqn (1)–(3)):
| |
 | (1) |
| |
 | (2) |
| |
 | (3) |
where
I is the current (A), Δ
t is discharge time, Δ
V is the potential range (V),
ν is the scan rate of the potential (V s
−1),
m is the total weight of the electrode materials (g),
f is the frequency (Hz) and
Z′′ is the imaginary part of the impedance (Ω). In the impedance diagram, the capacitance is calculated from the imaginary part of the impedance in the low frequency area (less than 1 Hz).
2.3. Electrosorption experiments
The CDI performance was investigated in a continuous system composed of a CDI unit, a feed tank and a peristaltic pump (BT100-2J, Longer Pump). The CDI cell had two end plates, an anode, a cathode and separators. Non-woven fabrics were used as the separators for CDI. In each test, a 50 mL NaCl solution in a water tank was circulated with a flow rate of 5 mL min−1. The conductivity of the NaCl solution was continuously monitored using a conductivity meter (856 Conductivity Module, Metrohm). An electrochemical workstation was used to supply DC power. In adsorption–desorption cycles test, two parallel sets of experiments were carried out in batch modes, with a 60 mL NaCl solution (500 mg L−1) and a flow rate of 8 mL min−1, for 150 adsorption–desorption cycles, under an applied voltage of 1 V/0 V/−1 V/0 V. One set of experiments was used to analyze the conductivity variations and the other was used to monitor pH fluctuations. The working area of the electrode was 3 × 3 cm2, and the distance between the two electrodes was 0.2 mm. The NaCl concentration obtained based on a standard calibration curve between the conductivity and the concentration of NaCl solutions.
The SAC (mg g−1) and the ASAR (mg g−1 min−1) of the electrode materials were obtained from the following eqn (4) and eqn (5):
| |
 | (4) |
| |
 | (5) |
where
C0 and
Ce are the initial and final concentrations of the NaCl solution (mg L
−1),
V is the volume of the water tank (L),
m is the total weight of the electrode materials (g) and
t is the electrosorption time (min).
3. Results and discussion
3.1. Physico-chemical properties of CTS-ACx
Higher temperature results in a more intense KOH etching process. Thus, the activation temperature has a significant effect on the yield and the physico-chemical properties of the CTS-AC products, including on their total pore volume, BET specific surface area (SBET), pore size distribution, elemental composition and electronic conductivity, all of which are key parameters for the electrosorption behaviour of AC. The KOH etching process includes a series of reactions, which make a significant difference at different temperatures. When the activation temperature is below 400 °C, no reaction is observed between KOH and carbon. When the temperature increases to ∼400–600 °C, two main reactions occur. One is a reaction between KOH and carbon (eqn (6)) and the other is the dehydration of KOH (eqn (7)). At ∼600–700 °C, the reactions of H2O with carbon and CO are also occurred (eqn (8) and (9)). At ∼700–800 °C, K2CO3 is mainly decomposed into K2O and CO2 (eqn (10)). At the same time, K2CO3 and K2O can react with carbon to form K and CO (eqn (11) and (12)). In addition, CO2 also reacts with carbon (eqn (13)) when the temperature exceeds 700 °C.38,39| | |
6KOH + 2C → 2K + 3H2 + 2K2CO3
| (6) |
| | |
K2CO3 + 2C → 2K + 3CO
| (11) |
In this study, as the activation temperature increases, the yield of CTS-ACx decreases. After pyrolysis, the yield of CTS-C is about 40% (Fig. S2†). After activation at different temperatures, the approximate yields of CTS-AC600, CTS-AC700, and CTS-AC800 are 30.0, 20.0 and 12.5%, respectively. The yield of CTS-AC900 is too low to be analyzed. The results of Fig. 1a indicate that the N2 adsorption–desorption of CTS-ACx follows a type I isotherm model. All the isotherm curves initially increase rapidly with increasing pressure, indicating the existence of many micropores (pore size < 2 nm). A microporous structure dominates in CTS-AC600. A micro-mesoporous structure, with a pore width ranging from 0 nm to 4 nm, dominates in CTS-AC700. CTS-AC800 has more mesopores (pore size 2–50 nm), and a pore width of CTS-AC800 ranging from 0 to 10 nm (Fig. 1b). When the temperature exceeds ∼760 °C, reaching the boiling point of K, K also acts as a pore enlarger, resulting in a larger pore size at higher temperature.40 However, because KOH is in excess in this activation system, carbon reacts completely when the temperature is too high. Based on the properties of pores with different widths, micropores are essential for ion storage,41 while macropores (pore size > 50 nm) and mesopores help ion transport and increase the accessible surface area for salt ions.10,42
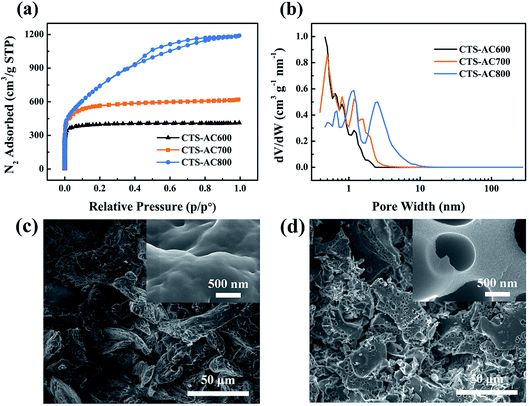 |
| | Fig. 1 N2 adsorption/desorption isotherms (a) and DFT pore diameter distribution (b) of CTS-ACx. SEM surface morphology images of CTS-C (c) and CTS-AC800 (d). | |
The SEM images show that without activation CTS-C has an intact and smooth surface without any surface pores (Fig. 1c). In contrast, CTS-AC800 exhibits an irregular morphology with a large number of macropores and a rough surface (Fig. 1d). In addition, CTS-AC800 has an adequate micropore volume and the highest mesopore volume among the samples (Table 1), indicating that CTS-AC800 may also have the highest SAC.
Table 1 Physical properties of CTS-ACx
| Sample |
SBET (m2 g−1) |
Pore volume (cm3 g−1) |
| Total |
Micropore |
Mesopore |
| CTS-AC600 |
1339 |
0.64 |
0.56 |
0.08 |
| CTS-AC700 |
1929 |
0.96 |
0.75 |
0.21 |
| CTS-AC800 |
2727 |
1.83 |
1.03 |
0.80 |
The ratio of the D band (1350 cm−1) to the G band (1580 cm−1) (ID/IG) in the Raman spectrum reflects the graphitization degree of the sample. From the Raman spectra (Fig. S4†), the ID/IG values for CTS-AC600, CTS-AC700 and CTS-AC800 are 1.22, 1.23 and 1.21, respectively, which indicating that the graphitization degrees of the CTS-ACx samples are very similar. The presence of nitrogen-containing groups and oxygen-containing groups can enhance the hydrophilicity of the material (Fig. S5†). The XPS spectra demonstrate the presence of C, O and N in CTS-ACx (Fig. 2a) and their relative contents are listed in Table 2. The results show that with increasing activation temperature, the C content increased and the heteroatom content decreased, due to an increased amount of pyrolysis at higher temperatures. The N 1s XPS spectra reveal three obvious peaks at binding energies of approximately 398.5, 400.1, and 401.1 eV, corresponding to pyridinic N, pyrrolic N and quaternary N, respectively (Fig. 2b–d).29,43 The relative content of pyrrolic N decreased, but the content of quaternary N increased, indicating that quaternary N sites are more stable than pyrrolic N sites at high temperature, consistent with previous studies.44,45 A higher quaternary N content may enhance the electronic conductivity because of its specific chemical structure.6 In addition, amino cyclization may occur at high temperature.
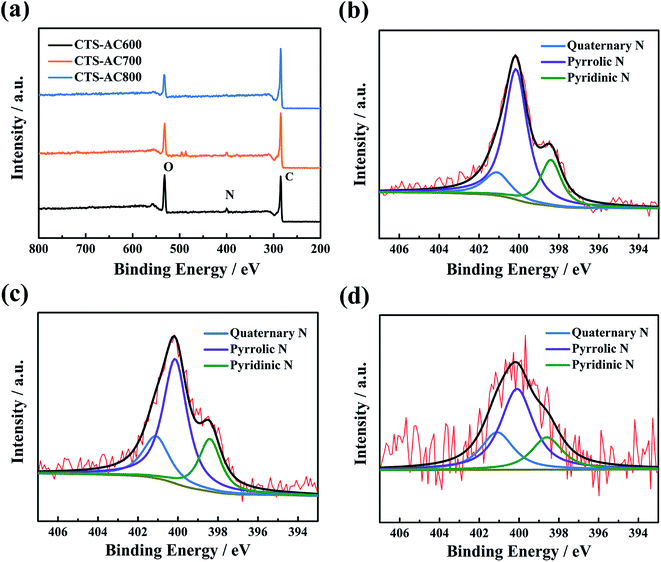 |
| | Fig. 2 XPS spectra (a) of CTS-ACx, and high-resolution N 1s XPS spectra of CTS-AC600 (b), CTS-AC700 (c) and CTS-AC800 (d). | |
Table 2 Chemical composition of CTS-ACx (%: atomic percent)
| Sample |
C (%) |
O (%) |
N (%) |
N 1s deconvolution (%) |
| Pyridinic N |
Pyrrolic N |
Quaternary N |
| CTS-AC600 |
73.2 |
18.2 |
8.6 |
21.4 |
65.3 |
13.3 |
| CTS-AC700 |
79.9 |
12.6 |
7.5 |
21.9 |
56.9 |
21.2 |
| CTS-AC800 |
89.6 |
8.4 |
2.0 |
20.6 |
54.2 |
25.1 |
In the O 1s XPS spectra, the binding energies at 531.4, 532.8 and 534.3 eV are related to quinone groups (C![[double bond, length as m-dash]](https://www.rsc.org/images/entities/char_e001.gif) O), phenol groups (C–OH) or ether groups (C–O–C), and carboxylic groups (COOH), respectively.46 As seen in Fig. 3, the proportion of quinone groups decreases significantly with increasing activation temperature. In addition, the decreased N and O content enhances the electronic conductivity of the CTS-ACx powder (Fig. 4). Under 10 to 100 MPa of pressure, the electronic conductivities of the pressed form of CTS-AC600, CTS-AC700 and CTS-AC800 are 1.93–9.21 × 10⁻⁵, 0.116–0.456 and 0.573–2.09 S cm−1, respectively.
O), phenol groups (C–OH) or ether groups (C–O–C), and carboxylic groups (COOH), respectively.46 As seen in Fig. 3, the proportion of quinone groups decreases significantly with increasing activation temperature. In addition, the decreased N and O content enhances the electronic conductivity of the CTS-ACx powder (Fig. 4). Under 10 to 100 MPa of pressure, the electronic conductivities of the pressed form of CTS-AC600, CTS-AC700 and CTS-AC800 are 1.93–9.21 × 10⁻⁵, 0.116–0.456 and 0.573–2.09 S cm−1, respectively.
 |
| | Fig. 3 High-resolution O 1s XPS spectra of CTS-AC600 (a), CTS-AC700 (b) and CTS-AC800 (c). | |
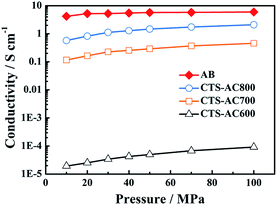 |
| | Fig. 4 Electronic conductivity of CTS-ACx (AB: acetylene black). | |
3.2. Electrochemical characterization of CTS-ACx and the CTS-ACx electrodes
The specific capacitances of CTS-ACx were evaluated from the discharging curve in the GC experiment. Fig. 5a shows that the specific capacitances of CTS-ACx/GCEs are current dependent and decrease with increasing current density. At a current density of 1 A g−1, the specific capacitances of CTS-AC600/GCE, CTS-AC700/GCE and CTS-AC800/GCE are 115, 145 and 185 F g−1, respectively. At 100 A g−1, the capacity retention rates of different CTS-ACx/GCEs dropped to 3, 25 and 54% of their original values. This indicates that CTS-AC800 has the highest adsorption capacity and rapid ion transport, due to its large micropore surface area and high mesopore volume. CTS-AC800/GCE also shows the best rectangular CV pattern and the largest response current (Fig. S6†). Although the CV curve deviates from a rectangular shape because of the large resistance of the solution, it still reflects the largest capacitance and the smallest resistance of CTS-AC800 in a 500 mg L−1 NaCl solution (Fig. 5b).
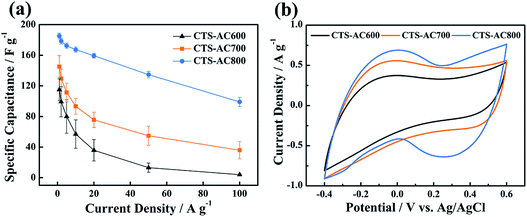 |
| | Fig. 5 Electrochemical properties of CTS-ACx/GCEs in NaCl solution. (a) The specific capacitance of CTS-ACx/GCEs at different current densities in a 1 M NaCl solution. (b) The CV curves of CTS-ACx/GCEs at 5 mV s−1 in a 500 mg L−1 NaCl solution. | |
The electrochemical properties of the CTS-ACx electrodes for CDI were evaluated in a 1 M NaCl solution (Fig. 6). The Nyquist plots of EIS analysis and the equivalent circuit diagram of the CTS-ACx electrodes are shown in Fig. 6a. The X-axis intercept represents the ohmic resistance (Rs), which consists of the electrode, solution and contact resistance.47 The fitted Rs of the CTS-AC600, CTS-AC700 and CTS-AC800 electrodes are 2.56, 0.98 and 0.81 Ω, respectively, indicating that the electrode resistance is consistent with the AC resistance. The semicircle in the high frequency range reveals the charge transfer resistance (Rct) at the interface between the electrode and the electrolyte.48 Thus, Rct indirectly reflects the ion transport inside the electrode. The fitted Rct of the CTS-AC600, CTS-AC700 and CTS-AC800 electrodes are 255.6, 0.15 and 0.05 Ω, respectively, indicating that faster ion transport is associated with a higher proportion of mesopores, generated by a higher activation temperature. Fig. 6b shows the calculated EIS-capacitance curves of the CTS-ACx electrodes, obtained from the frequency and impedance data. The EDLC of CTS-AC800, reflected in the EIS-capacitance curves of CTS-AC800 at 0.01 Hz, is the highest for all the CTS-ACx electrodes. The CV curve of the CTS-AC800 electrode exhibits an optimal rectangle shape (Fig. 6c). In addition, the CTS-AC800 electrode has a good rate performance, indicated by the quasi-rectangular shape of the CV profile at a scan rate of 20 mV s−1 (Fig. 6d).
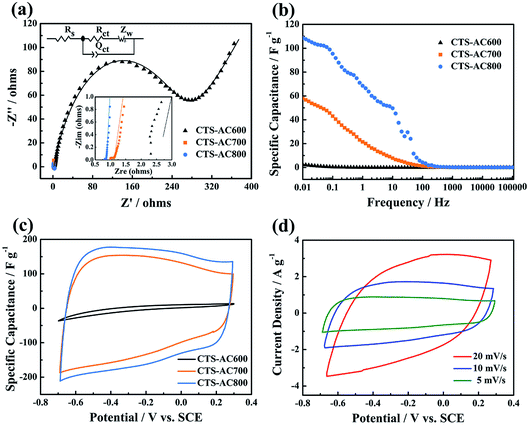 |
| | Fig. 6 Electrochemical properties of the CTS-ACx electrodes in a 1 M NaCl solution: (a) Nyquist plots of EIS (10 kHz to 0.01 Hz) at the open circuit potential and the equivalent circuit diagram. (b) Calculated EIS capacitance curves, (c) CV curves at a scan rate of 5 mV s−1, and (d) CV curves of the CTS-AC800 electrode at different scan rates. | |
3.3. The desalination performance of the CTS-ACx electrodes
The desalination performance of CDI with CTS-ACx electrodes is shown in Fig. 7a, neglecting the CTS-AC600 electrode due to its low capacitance. The CDI Ragone plot (or Kim-Yoon plot) (Fig. 7b) reflects the correlation between ASAR and SAC.49 The CTS-AC800 electrode starts with 0.34 mg g−1 min−1 of ASAR and ends with 7.87 mg g−1 of SAC, which are higher than the 0.22 mg−1 g−1 min−1 of ASAR and 4.46 mg g−1 of SAC for the CTS-AC700 electrode. Fig. 7b shows that the CTS-AC800 electrode is in the upper right region compared to CTS-AC700, indicating that the CTS-AC800 electrode performed better. This result is due to (1) the higher electronic conductivity of CTS-AC800, which can accelerate charge transfer, and (2) the higher proportion of mesopores, which promotes ion transport and increases the accessible surface area of the electrode.
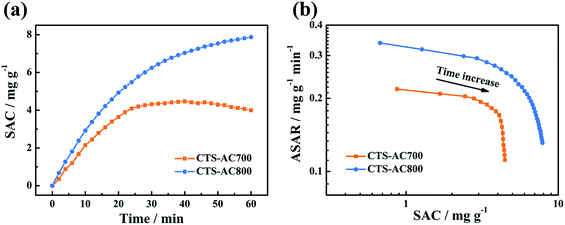 |
| | Fig. 7 Electrosorption processes of the CTS-AC700 and CTS-AC800 electrodes in a 50 mg L−1 NaCl solution at 1.2 V. (a) SACs, (b) CDI Ragone (Kim-Yoon) plots. | |
The desalination performance of CDI with the CTS-AC800 electrode was further investigated under different applied voltages and salt concentrations. The results show that the concentration variation increases from 5.7 to 14.8 mg L−1 when the applied voltage changes from 0.6 to 1.2 V, demonstrating that the electrode material acquires a larger SAC at higher applied voltages (Fig. 8a). Applied voltages higher than the theoretical splitting voltage of water (1.23 V) were not investigated. The SAC of the electrode material is concentration dependent. When the initial concentration of the NaCl solution is increased from 50 to 400 mg L−1, the SAC increases from 6.24 to 12.16 mg g−1 in 30 min (Fig. 8b). The CDI electrosorption process could be further analyzed using the pseudo-first-order adsorption kinetic equation eqn (14):
| |
 | (14) |
where
qe is the saturated SAC (mg g
−1),
qt is the SAC at different times (mg g
−1),
k is the rate constant (min
−1), and
t is the electrosorption time (min). The simulated result in
Table 3 clearly shows that the theoretical saturated SAC and the adsorption rate increase with an increased initial concentration. The SACs of the CTS-AC
x electrodes under different equilibrium concentrations are illustrated in
Fig. 8c. The saturated SAC initially increases and then remains unchanged under higher salt concentrations, indicating that the electrode has a maximum SAC. The saturated SAC of the CTS-AC800 electrode is 14.12 mg g
−1 under 500 mg L
−1 of NaCl. It is exciting to find that the SAC of the CTS-AC800 electrode remains stability over 150 adsorption–desorption cycles (
Fig. 8d). Additionally, there is no significant change in desalination performance, with 95% retention, after 150 cycles compared with the first cycle. During the cycling test, the pH remained in the range of 6 and 8 (Fig. S7
†), indicating that the CTS-AC800 electrode is a promising electrode for CDI applications. Based on the price of the precursor chitosan, the chemicals and the power consumption required for the synthesis, the cost of synthesizing CTS-AC800 is only ∼USD$100 kg
−1.
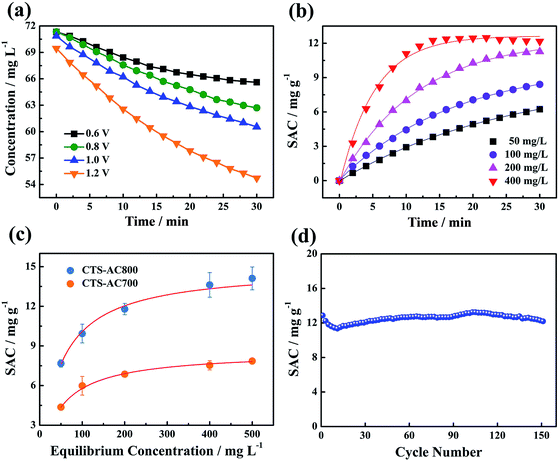 |
| | Fig. 8 (a) The concentration changes during desalination using the CTS-AC800 electrode at different applied voltages, (b) the effect of the initial concentrations on the SACs of the CTS-AC800 electrode at 1.2 V, (c) the SACs of the CTS-AC700 and CTS-AC800 electrode at different NaCl equilibrium concentrations at 1.2 V, (d) the adsorption/desorption stability of the CTS-AC800 electrode in a 500 mg L−1 NaCl solution. | |
Table 3 Pseudo-first-order adsorption kinetics parameters for the CTS-AC800 electrode in NaCl solutions with different initial concentrations at 1.2 V
| Model equation |
Initial concentration (mg L−1) |
qe (mg g−1) |
k (min−1) |
R2 |
 |
50 |
9.12 |
0.089 |
0.9998 |
| 100 |
10.22 |
0.131 |
0.9995 |
| 200 |
12.49 |
0.198 |
0.999 |
| 400 |
13.04 |
0.441 |
0.991 |
As described above, without any additional N-doping step in preparation, the CTS-AC800 based electrode shows good desalination performance with high SAC, high ASAR and extraordinary stability. The SAC of CTS-AC800 in this study is comparable to the capacities of reported N-doped carbonaceous materials (Table 4). Previous studies have also indicated that N-doped carbon-based materials with larger SAC usually have fibrous or multi-layered structures, which can provide larger accessible surface areas and improve ion transport. Thus, further studies on preparing three-dimensional chitosan-based porous carbon are warranted.
Table 4 The SACs of N-doped carbonaceous materials
| Electrode material |
Applied voltage (V) |
Initial concentration (mg L−1) |
SAC (mg g−1) |
Ref. |
| N-AC |
1.2 |
50 |
2.85 |
50 |
| HPC-800 |
1.2 |
580 |
7.75 |
51 |
| MRF(0)-0.5–6 |
1.5 |
1462 |
8.2 |
52 |
| N-PHCS |
1.2 |
500 |
10.28 |
53 |
| NG-CNFs |
1.2 |
500 |
11.55 |
54 |
| AN-CF |
1.2 |
500 |
12.32 |
19 |
| NPCS1000 |
1.2 |
500 |
13.71 |
55 |
| N-HPC |
1.2 |
500 |
13.76 |
26 |
| N-CNFA-800 |
1.2 |
500 |
14.30 |
56 |
| PAC/PTS |
1.4 |
600 |
14.9 |
57 |
| NCPC-900 |
1.6 |
500 |
17.2 |
58 |
| NCNRs |
1.2 |
500 |
17.62 |
59 |
| CTS-AC800 |
1.2 |
500 |
14.12 |
This work |
4. Conclusions
In this study, high-performance CTS-ACx for efficient CDI has been prepared by pyrolysis and KOH activation. The temperature of the activation process has a significant effect on the specific surface area and the pore size of CTS-ACx. Increasing activation temperature enhanced the mesopore ratio, which is beneficial for ion transmission into the interior of the electrode, thus increasing the effective contact and the capacitance of the electrode for electrosorption. However, increasing the activation temperature may cause the loss of nitrogen and oxygen, and has ‘trade-off’ effects on the hydrophilicity and the electronic conductivity of AC. However, 10–30% of the heteroatom content is still present in CTS-ACx because chitosan contains many amino groups and hydroxyl groups. The physico-chemical characteristics of chitosan-based AC result in good electrochemical properties. The saturated SAC of the CTS-AC800 electrode is 14.12 mg g−1 in a 500 mg L−1 NaCl solution at 1.2 V. Considering the high abundance of the natural biological polysaccharide chitosan, the low cost and ease of synthesis of the AC product, and its energy effectiveness, CTS-AC is a desirable electrosorption material for CDI applications.
Conflicts of interest
There are no conflicts of interest to declare.
Acknowledgements
This work was financially supported by National Natural Science Foundation of China (No. 51761145047, No. 51678020).
References
- M. A. Anderson, A. L. Cudero and J. Palma, Electrochim. Acta, 2010, 55, 3845–3856 CrossRef CAS.
- M. E. Suss, S. Porada, X. Sun, P. M. Biesheuvel, J. Yoon and V. Presser, Energy Environ. Sci., 2015, 8, 2296–2319 RSC.
- S. Porada, R. Zhao, A. van der Wal, V. Presser and P. M. Biesheuvel, Prog. Mater. Sci., 2013, 58, 1388–1442 CrossRef CAS.
- F. A. AlMarzooqi, A. A. Al Ghaferi, I. Saadat and N. Hilal, Desalination, 2014, 342, 3–15 CrossRef CAS.
- Y. S. Dzyazko, A. S. Rudenko, Y. M. Yukhin, A. V. Palchik and V. N. Belyakov, Desalination, 2014, 342, 52–60 CrossRef CAS.
- Z. H. Huang, Z. Y. Yang, F. Y. Kang and M. Inagaki, J. Mater. Chem. A, 2017, 5, 470–496 RSC.
- S. Y. Wang, G. Wang, T. T. Wu, Y. Q. Zhang, F. Zhan, Y. W. Wang, J. G. Wang, Y. Fu and J. S. Qiu, J. Mater. Chem. A, 2018, 6, 14644–14650 RSC.
- T. T. Wu, G. Wang, Q. Dong, F. Zhan, X. Zhang, S. F. Li, H. Y. Qiao and J. S. Qiu, Environ. Sci. Technol., 2017, 51, 9244–9251 CrossRef CAS PubMed.
- Y. Liu, C. Y. Nie, X. J. Liu, X. T. Xu, Z. Sun and L. K. Pan, RSC Adv., 2015, 5, 15205–15225 RSC.
- C. L. Yeh, H. C. Hsi, K. C. Li and C. H. Hou, Desalination, 2015, 367, 60–68 CrossRef CAS.
- G. X. Li, P. X. Hou, S. Y. Zhao, C. Liu and H. M. Cheng, Carbon, 2016, 101, 1–8 CrossRef CAS.
- C. Tsouris, R. Mayes, J. Kiggans, K. Sharma, S. Yiacoumi, D. DePaoli and S. Dai, Environ. Sci. Technol., 2011, 45, 10243–10249 CrossRef CAS PubMed.
- D. Y. Ma, Y. Wang, L. W. Zhang, Z. Q. Wang and S. C. Xu, Desalin. Water Treat., 2017, 85, 84–91 CrossRef CAS.
- J. Y. Liu, Z. B. Xiong, S. P. Wang, W. H. Cai, J. M. Yang and H. X. Zhang, Electrochim. Acta, 2016, 210, 171–180 CrossRef CAS.
- R. Kumar, S. Sen Gupta, S. Katiyar, V. K. Raman, S. K. Varigala, T. Pradeep and A. Sharma, Carbon, 2016, 99, 375–383 CrossRef CAS.
- M. S. Zoromba, M. H. Abdel-Aziz, M. Bassyouni, S. Gutub, D. Demko and A. Abdelkader, ACS Sustainable Chem. Eng., 2017, 5, 4573–4581 CrossRef CAS.
- Q. Dong, G. Wang, T. Wu, S. Peng and J. Qiu, J. Colloid Interface Sci., 2015, 446, 373–378 CrossRef PubMed.
- Y. Wimalasiri and L. D. Zou, Carbon, 2013, 59, 464–471 CrossRef CAS.
- L. Zhang, Y. Liu, T. Lu and L. K. Pan, J. Colloid Interface Sci., 2017, 804, 179–184 CAS.
- P. A. Chen, H. C. Cheng and H. P. Wang, J. Cleaner Prod., 2018, 174, 927–932 CrossRef CAS.
- A. M. Dehkhoda, E. Gyenge and N. Ellis, Biomass Bioenergy, 2016, 87, 107–121 CrossRef CAS.
- J. J. Lado, R. L. Zornitta, F. A. Calvi, M. Martins, M. A. Anderson, F. G. E. Nogueira and L. A. M. Ruotolo, J. Anal. Appl. Pyrolysis, 2017, 126, 143–153 CrossRef CAS.
- T. E. Rufford, D. Hulicova-Jurcakova, Z. H. Zhu and G. Q. Lu, Electrochem. Commun., 2008, 10, 1594–1597 CrossRef CAS.
- H. Zhu, X. Wang, F. Yang and X. Yang, Adv. Mater., 2011, 23, 2745–2748 CrossRef CAS PubMed.
- J. B. Lee, K. K. Park, S. W. Yoon, P. Y. Park, K. I. Park and C. W. Lee, Desalination, 2009, 237, 155–161 CrossRef CAS.
- Y. Li, I. Hussain, J. W. Qi, C. Liu, J. S. Li, J. Y. Shen, X. Y. Sun, W. Q. Han and L. J. Wang, Sep. Purif. Technol., 2016, 165, 190–198 CrossRef CAS.
- X. Xu, L. Pan, Y. Liu, T. Lu and Z. Sun, J. Colloid Interface Sci., 2015, 445, 143–150 CrossRef CAS PubMed.
- Y. H. Hu, H. B. Wang, L. F. Yang, X. R. Liu, B. Zhang, Y. L. Liu, Y. Xiao, M. T. Zheng, B. F. Lei, H. R. Zhang and H. G. Fu, J. Electrochem. Soc., 2013, 160, H321–H326 CrossRef CAS.
- F. Gao, J. Y. Qu, Z. B. Zhao, Z. Y. Wang and J. S. Qiu, Electrochim. Acta, 2016, 190, 1134–1141 CrossRef CAS.
- P. Hao, Z. H. Zhao, Y. H. Leng, J. Tian, Y. H. Sang, R. I. Boughton, C. P. Wong, H. Liu and B. Yang, Nano Energy, 2015, 15, 9–23 CrossRef CAS.
- Q. Q. Ji, P. Z. Guo and X. S. Zhao, Acta Phys.-Chim. Sin., 2010, 26, 1254–1258 CAS.
- Q. Y. Liang, H. Su, J. Yan, C. Leung, S. L. Cao and D. S. Yuan, Chin. J. Catal., 2014, 35, 1078–1083 CrossRef CAS.
- Z. Ling, G. Wang, M. Zhang, X. Fan, C. Yu, J. Yang, N. Xiao and J. Qiu, Nanoscale, 2015, 7, 5120–5125 RSC.
- Z. Ling, C. Yu, X. Fan, S. Liu, J. Yang, M. Zhang, G. Wang, N. Xiao and J. Qiu, Nanotechnology, 2015, 26, 374003 CrossRef PubMed.
- A. Sliwak, N. Diez, E. Miniach and G. Gryglewicz, J. Appl. Electrochem., 2016, 46, 667–677 CrossRef CAS.
- Y. Y. Wang, B. H. Hou, H. Y. Lu, F. Wan, J. Wang and X. L. Wu, RSC Adv., 2015, 5, 97427–97434 RSC.
- L. F. Zhu, F. Shen, R. L. Smith and X. H. Qi, Energy Technol., 2017, 5, 452–460 CrossRef CAS.
- J. Wang and S. Kaskel, J. Mater. Chem., 2012, 22, 23710 RSC.
- L. Qie, W. Chen, H. Xu, X. Xiong, Y. Jiang, F. Zou, X. Hu, Y. Xin, Z. Zhang and Y. Huang, Energy Environ. Sci., 2013, 6, 2497 RSC.
- W. Xing, M. J. Zhang and Z. F. Yan, Acta Phys.-Chim. Sin., 2002, 18, 340–345 CAS.
- E. Raymundo-Pinero, K. Kierzek, J. Machnikowski and F. Beguin, Carbon, 2006, 44, 2498–2507 CrossRef CAS.
- X. R. Wen, D. S. Zhang, L. Y. Shi, T. T. Yan, H. Wang and J. P. Zhang, J. Mater. Chem., 2012, 22, 23835–23844 RSC.
- N. D. Kim, W. Kim, J. B. Joo, S. Oh, P. Kim, Y. Kim and J. Yi, J. Power Sources, 2008, 180, 671–675 CrossRef CAS.
- S. Chen, J. Bi, Y. Zhao, L. Yang, C. Zhang, Y. Ma, Q. Wu, X. Wang and Z. Hu, Adv. Mater., 2012, 24, 5593–5597 CrossRef CAS PubMed.
- Y. Li, J. M. Shen, J. S. Li, X. Y. Sun, J. Y. Shen, W. Q. Han and L. J. Wang, Carbon, 2017, 116, 21–32 CrossRef CAS.
- D. Hulicova-Jurcakova, M. Seredych, G. Q. Lu and T. J. Bandosz, Adv. Funct. Mater., 2009, 19, 438–447 CrossRef CAS.
- Y. Liu, T. Lu, Z. Sun, D. H. C. Chua and L. K. Pan, J. Mater. Chem. A, 2015, 3, 8693–8700 RSC.
- Y. Liu, X. Xu, M. Wang, T. Lu, Z. Sun and L. Pan, Chem. Commun., 2015, 51, 12020–12023 RSC.
- T. Kim and J. Yoon, RSC Adv., 2015, 5, 1456–1461 RSC.
- A. S. Yasin, J. Jeong, I. M. A. Mohamed, C. H. Park and C. S. Kim, J. Alloys Compd., 2017, 729, 764–775 CrossRef CAS.
- S. Dutta, S. Y. Huang, C. Chen, J. E. Chen, Z. A. Alothman, Y. Yamauchi, C. H. Hou and K. C. W. Wu, ACS Sustainable Chem. Eng., 2016, 4, 1885–1893 CrossRef CAS.
- G. Rasines, P. Lavela, C. Macias, M. C. Zafra, J. L. Tirado, J. B. Parra and C. O. Ania, Carbon, 2015, 83, 262–274 CrossRef CAS.
- S. S. Zhao, T. T. Yan, H. Wang, G. R. Chen, L. Huang, J. P. Zhang, L. Y. Shi and D. S. Zhang, Appl. Surf. Sci., 2016, 369, 460–469 CrossRef CAS.
- Y. Liu, X. T. Xu, T. Lu, Z. Sun, D. H. C. Chua and L. K. Pan, RSC Adv., 2015, 5, 34117–34124 RSC.
- Y. Liu, T. Q. Chen, T. Lu, Z. Sun, D. H. C. Chua and L. K. Pan, Electrochim. Acta, 2015, 158, 403–409 CrossRef CAS.
- G. Zhu, H. Wang, H. Xu and L. Zhang, J. Electroanal. Chem., 2018, 822, 81–88 CrossRef CAS.
- R. L. Zornitta, F. J. Garcia-Mateos, J. J. Lado, J. Rodriguez-Mirasol, T. Cordero, P. Hammer and L. A. M. Ruotolo, Carbon, 2017, 123, 318–333 CrossRef CAS.
- Y. Li, Y. Liu, J. Shen, J. Qi, J. Li, X. Sun, J. Shen, W. Han and L. Wang, Desalination, 2018, 430, 45–55 CrossRef CAS.
- Y. Liu, X. T. Xu, M. Wang, T. Lu, Z. Sun and L. K. Pan, J. Mater. Chem. A, 2015, 3, 17304–17311 RSC.
Footnote |
| † Electronic supplementary information (ESI) available. See DOI: 10.1039/c9ra04959b |
|
| This journal is © The Royal Society of Chemistry 2019 |
Click here to see how this site uses Cookies. View our privacy policy here.  Open Access Article
 *,
Xiumei Ma,
Shanfu Lu
 and
Yan Xiang
 *
*
![[thin space (1/6-em)]](https://www.rsc.org/images/entities/char_2009.gif) :
:![[thin space (1/6-em)]](https://www.rsc.org/images/entities/char_2009.gif) 4 in ultrapure water. The mixture was then sintered for another 2 h at a temperature of 600, 700, 800 or 900 °C under N2 atmosphere with a warming-up time of 2 h. After KOH activation, the product was washed with hydrochloric acid and ultrapure water until a pH of >6 and a conductivity of <5 μS cm−1 was reached. Then the product was dried for over 24 h in an oven at 60 °C and finally chitosan-based AC, denoted CTS-ACx (where x represents the activation temperature: 600, 700, 800 and 900 °C), was obtained. The CDI electrodes were prepared by brush coating a mixture of CTS-ACx (∼50 mg) and polyvinylidene fluoride (PVDF, Alfa Aesar, Tianjin) with a weight ratio of 9
4 in ultrapure water. The mixture was then sintered for another 2 h at a temperature of 600, 700, 800 or 900 °C under N2 atmosphere with a warming-up time of 2 h. After KOH activation, the product was washed with hydrochloric acid and ultrapure water until a pH of >6 and a conductivity of <5 μS cm−1 was reached. Then the product was dried for over 24 h in an oven at 60 °C and finally chitosan-based AC, denoted CTS-ACx (where x represents the activation temperature: 600, 700, 800 and 900 °C), was obtained. The CDI electrodes were prepared by brush coating a mixture of CTS-ACx (∼50 mg) and polyvinylidene fluoride (PVDF, Alfa Aesar, Tianjin) with a weight ratio of 9![[thin space (1/6-em)]](https://www.rsc.org/images/entities/char_2009.gif) :
:![[thin space (1/6-em)]](https://www.rsc.org/images/entities/char_2009.gif) 1 onto a titanium mesh (3 × 3 cm2).
1 onto a titanium mesh (3 × 3 cm2).


![[double bond, length as m-dash]](https://www.rsc.org/images/entities/char_e001.gif) O), phenol groups (C–OH) or ether groups (C–O–C), and carboxylic groups (COOH), respectively.46 As seen in Fig. 3, the proportion of quinone groups decreases significantly with increasing activation temperature. In addition, the decreased N and O content enhances the electronic conductivity of the CTS-ACx powder (Fig. 4). Under 10 to 100 MPa of pressure, the electronic conductivities of the pressed form of CTS-AC600, CTS-AC700 and CTS-AC800 are 1.93–9.21 × 10⁻⁵, 0.116–0.456 and 0.573–2.09 S cm−1, respectively.
O), phenol groups (C–OH) or ether groups (C–O–C), and carboxylic groups (COOH), respectively.46 As seen in Fig. 3, the proportion of quinone groups decreases significantly with increasing activation temperature. In addition, the decreased N and O content enhances the electronic conductivity of the CTS-ACx powder (Fig. 4). Under 10 to 100 MPa of pressure, the electronic conductivities of the pressed form of CTS-AC600, CTS-AC700 and CTS-AC800 are 1.93–9.21 × 10⁻⁵, 0.116–0.456 and 0.573–2.09 S cm−1, respectively.


