 Open Access Article
A porous reduced graphene oxide/chitosan-based nanocarrier as a delivery system of doxorubicin†
N.
Hazhir
a,
F.
Chekin
 *a,
J. B.
Raoof
b and
Sh.
Fathi
a
aDepartment of Chemistry, Ayatollah Amoli Branch, Islamic Azad University, Amol, Iran
bElectroanalytical Chemistry Research Laboratory, Department of Analytical Chemistry, Faculty of Chemistry, University of Mazandaran, Babolsar, Iran. E-mail: fchekin@yahoo.com; Fax: +98-121-2517087; Tel: +98-121-2517087
First published on 27th September 2019
Abstract
Nowadays, the concept of drug transmission is an important topic in the field of drug delivery research. Drug delivery is the method or process of administering a pharmaceutical compound to achieve a therapeutic effect in humans or animals. In this study, we report the development of a novel platform for the loading and release of doxorubicin (DOX). It is based on porous reduced graphene oxide (prGO) nanosheets and chitosan (CS) biocompatible polymer, where prGO can be dispersed in chitosan through amide linkages. The loading and release of DOX on the CS-prGO nanocomposite were investigated by voltammetry, FE-SEM, and FTIR and UV-Vis spectroscopy methods. We showed that chitosan-modified prGO (CS-prGO) was an extremely efficient matrix. An efficient loading of DOX (86% at pH 7.00, time 3 h and initial concentration of 0.5 mg mL−1) was observed on CS-prGO as compared to the case of prGO due to the presence of the –OH and –NH2 groups of chitosan. At the normal physiological pH of 7.00, approximately 10% of DOX could be released from CS-prGO in a time span of 1 h; however, when exposed to pH 4.00, 25% of DOX was released in 1 h. After 20 h, 18% and 62% of DOX was released at pH 7.00 and 4.00, respectively. This illustrates the major benefits of the developed approach for biomedical applications.
Introduction
Nowadays, the targeting and drug controllable properties are the main concerns in cancer treatment;1,2 although they are highly efficient, anti-cancer drugs are not specific to cancer cells, and therefore, diverse side effects, including hair loss, nausea, vomiting, fatigue and risk of developing infections, may emerge during treatment.3 Drug-delivery systems (DDS) have been created for improving the therapeutic properties of drugs and are often in the form of a drug-containing capsule. These systems release drugs in specific amounts at a specific site; therefore, they affect the pharmacokinetics and distribution of drugs.4Thus, one of the main challenges is to find a suitable delivery carrier.5,6 Currently, among various carriers including polymeric particles,7,8 nanomaterials, microspheres,9 dendrimers10 and liposomes,11 which are used as potential drug carriers, nanomaterials demonstrate advantages for drug delivery.8–13 Nanocarriers can adjust the drug release rate, enhance the permeability of the biological membrane, change drug distribution in vivo, and improve the efficiency of drug through encapsulation, absorption, and even covalent crosslinking.14,15
Recent scientific evidence shows the potential uses of carbon nanomaterials as therapeutic agents, systems for selective and controlled drug release, and contrast agents for diagnosing and locating tumors.3 In recent years, significant efforts have been directed towards the use of porous structures as drug loading matrices due to their high surface area, tunable pore size and well-defined surface architectures.16,17
Graphene oxide (GO) is a two-dimensional layered nanomaterial with high surface area to volume ratio.18 Porous reduced graphene oxide (prGO) nanostructures are ideal platforms for energy storage devices,19,20 electrochemical sensing21,22 and the loading and triggered release of drugs. Their high surface area together with abundant localized π-electrons on the surface of the nanosheets enables π–π interactions with the aromatic part of the drugs, leading to high loading capacity.16
The functionalization of nanomaterials with biocompatible polymers increases their stability under physiological conditions.23–25 Polymeric nanomaterials are biodegradable and have been developed as drug delivery vehicles. They possess some advantages including improved encapsulation or solubilization of drugs to protect and deliver them, the capability to deliver different kinds of therapeutic drugs, biocompatibility, high pharmacokinetics, slight clearance from the body, and high endocytosis efficiency.26–28 Chitosan (CS) is a natural and linear polysaccharide that has amino groups.29 prGO can be evenly dispersed in the chitosan matrix through the formation of amide linkages between them through physical mixing.30
Doxorubicin (DOX) is one of the most effective chemotherapeutic drugs used against solid tumors in the treatment of several cancer types. DOX interacts with DNA through intercalation and causes changes in the chromatin structure.31 DOX can cause side effects such as cardiotoxicity and drug resistance. Moreover, it is difficult to administer the drug intravenously because of its low solubility in aqueous media.32 Thus, a π–π stacking interaction can be formed between the large π-conjugated structure of GO and the quinone structure of DOX. Moreover, a hydrophobic effect contributed to the interaction between GO and DOX.33 In the present study, we reported a novel nanohybrid formed by CS-prGO and DOX and characterized it using cyclic voltammetry, FE-SEM, and FTIR and UV-Vis spectroscopy methods. Furthermore, the loading and release of DOX were investigated by UV-Vis spectroscopy. It is believed that CS-prGO can have great potential as a drug delivery system (Fig. 1).
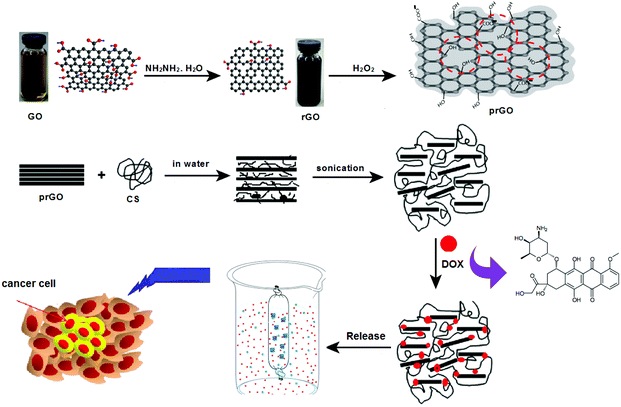 | ||
| Fig. 1 Schematic for the preparation of the DOX/CS-prGO hybrid and its application in a drug delivery system. | ||
Experimental
Materials
Doxorubicin hydrochloride, phosphoric acid, sodium dihydrogen phosphate, disodium hydrogen phosphate, sodium phosphate, hydrazine hydrate, potassium hexacyanoferrate(II) and chitosan were purchased from Sigma-Aldrich and used as received. Graphene oxide powder was purchased from Nanomaterials Pioneers, Iran.Apparatus
Electrochemical measurements were performed using a potentiostat/galvanostat (Metrohm Autolab, The Netherlands). A conventional three-electrode configuration consisting of Ag|AgCl|KCl3 M as the reference electrode, a platinum wire as the auxiliary electrode and a GCE and a DOX/CS-prGO-modified GCE as the working electrode was employed.FE-SEM images were obtained using an electron microscope (MIRATESCAN-XMU, the Czech Republic) combined with an EDS (Energy-Dispersive X-ray Spectroscopy) machine equipped with a thermal field-emission emitter and three different detectors.
UV-Vis spectra of the samples were obtained by a UV-Vis spectrophotometer (UV-1900, Shimadzu Co., Japan). FTIR spectra of GO and prGO were obtained by IR Tracer-100, Shimadzu Co., Japan.
Preparation of the porous reduced graphene oxide-chitosan nanocomposite (CS-prGO)
Reduced graphene oxide (rGO) and porous reduced graphene oxide (prGO) were prepared based on a study reported by Szunerits.22,34 Briefly, 5 mL of graphene oxide (GO) aqueous solution (1 mg mL−1) was sonicated for 3 h at 25 °C. Then, hydrazine hydrate solution (32 M, 1 mL) was added to the GO dispersed solution followed by heating in an oil bath for 24 h at 80 °C. The product was filtered, washed with water and dried in an oven at 100 °C. Next, 5 mg of rGO was sonicated in 5 mL of 30% H2O2 for 30 min and refluxed for 12 h at 60 °C. The product was filtered and washed with water. For the preparation of the CS-prGO nanocomposite, 1 mg of prGO was sonicated in 1 mL water for 1 h. Then, 0.5 mL of CS (0.5 mg mL−1 in 1% acetic acid) was added to the prGO suspension solution and sonicated for 30 min at 25 °C. The product was filtered, washed with water and stored in a fridge for use.Loading of DOX onto the CS-prGO nanocomposite and on-demand release experiments
Herein, 1 mg of the CS-prGO nanocomposite was dispersed in 2 mL of 0.1 M phosphate buffer solution (PBS) for 30 min at 25 °C. Then, 0.5 mg of DOX was added to the CS-prGO dispersed solution, and the mixture was continuously stirred for 3 h at constant temperature and pH. The sample was then centrifuged (relative centrifugal force of 8000 g for 15 min) to separate the solid phase (DOX/CS-prGO). The obtained DOX/CS-prGO hybrid was washed with water, dried overnight at room temperature and stored in the fridge for use. The loading amount of DOX onto the CS-prGO nanocomposite was calculated by the difference between the DOX concentrations of the initial DOX solution and the supernatant solution after loading. The supernatant concentration was determined by UV-Vis spectroscopy at 480 nm.To determine the release of DOX loaded onto CS-prGO, 1 mg of the DOX/CS-prGO hybrid nanocarrier was dispersed in 1 mL of PBS solution and placed in the inner dialysis tube, which was dialyzed in 15 mL of PBS solution at pH 4.00 and 7.00. The released DOX was determined by UV-Vis absorbance at 480 nm.
Preparation of the DOX/CS-prGO hybrid-modified electrode
The as-prepared 1 mg of DOX/CS-prGO hybrid was dispersed in 1 mL of water for 30 min. After polishing the GCE with alumina powder, 5 μL of the DOX/CS-prGO hybrid was drop cast onto the GCE surface and dried in the oven at 60 °C. Then, the DOX/CS-prGO/GCE was immersed in 0.1 M PBS (pH 7.00) for cyclic voltammetry measurements.Results and discussion
Characterization
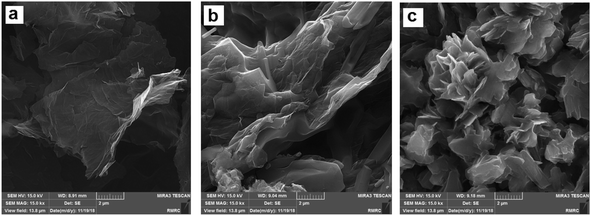
Raman analysis of prGO was performed (see ESI, Fig. S1†), and the results revealed the introduction of defects into the graphene framework. The intensity ratio of D and G bands (ID/IG) of prGO has been determined 0.98; its value for prGO is higher than that for rGO in literature22 due to the presence of unrepaired defects after the removal of oxygen-containing functional groups and the creation of pores. Furthermore, porous structures of prGO were evaluated by a tunneling electron microscope (TEM). As illustrated in Fig. S2,† uniformly distributed nanopores with 4–6 nm diameter were observed, indicating the hydrolysis of epoxy groups to hydroxyl groups, and the breaking of the C–C bonds resulted in porous structures.22The morphology of CS-prGO before and after the loading was characterized by FE-SEM. Fig. 2 displays the FE-SEM images of prGO, CS-prGO, and DOX/CS-prGO. As observed, the surface of prGO is smooth. In contrast, the surface of CS-prGO appears slightly coarse, indicating that most of prGO is relatively well dispersed in the chitosan matrix. Agglomeration was not observed in the case of CS-prGO. It was observed that during the preparation of the CS-prGO composite, the chitosan macromolecule separated the prGO sheets and prevented the agglomeration of prGO. In addition, the electron pair on the nitrogen atom of chitosan in the protonated form strongly interacted with prGO. Similar results have been reported earlier.25,35,36 Moreover, stacking and protuberances were observed on the surface of the DOX/CS-prGO nanohybrid, obviously indicating that DOX had been immobilized onto the CS-prGO composite. The –OH, –NH2 and –COOH groups on the CS-prGO nanocomposite formed hydrogen interactions with the –OH and –NH2 groups of DOX. Moreover, there were π–π stacking interactions and hydrophobic effect between DOX and CS-prGO in the nanohybrid.
Fig. 3A shows a comparison between the cyclic voltammograms of 0.1 mM DOX at the GCE and those of CS-prGO and DOX/CS-prGO-modified GCE in 0.1 M PBS (pH = 7.00). Compared to DOX at the GCE, a pair of well-defined redox peaks with significant enhancement was obtained for the DOX/CS-prGO-modified GCE. It appears that the interaction between the CS-prGO nanocomposite and DOX is because π–π stacking facilities electron transfer. Moreover, Fig. 3B depicts the CV curves of the GCE modified with the DOX/CS-prGO nanohybrid in 0.1 M PBS (pH 7.00) at various scan rates. As observed, the peak currents enhanced with the increasing scan rate. According to the plot of the anodic and cathodic peak currents versus the scan rate (Fig. 3C), the anodic and cathodic peak currents are linearly proportional to the potential sweep rate, indicating that the electrode process is surface-controlled over the selected range of potential scan rate. Therefore, the presence of DOX on the CS-prGO nanocomposite was confirmed.
The real electrochemical active surface area of the prGO/GCE and CS-prGO/GCE was determined by initially plotting the peak current as a function of the square root of the scan rate for [Fe(CN)6]4− (5 mM); then, from the slopes of these graphs and using eqn (1), the active area surface was calculated as follows:
| A = slope/(268.6 × n3/2 × D1/2 × C) | (1) |
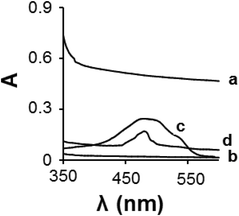
The formation of the DOX/CS-prGO hybrid was confirmed by UV-Vis spectroscopy in the range of 350–600 nm (Fig. 4); no absorption peak was observed for prGO and chitosan in this range, whereas the absorption peak of the free DOX was observed at 476 nm. The DOX/CS-prGO hybrid showed a characteristic absorption peak of DOX at 483 nm; thus, the UV-Vis spectra confirmed the formation of the hybrid. Moreover, the absorption peak of DOX after hybridization with CS-prGO showed a red shift (476 nm shifted to 483 nm) due to the ground-state electron donor–acceptor interaction between DOX and CS-prGO.37–39
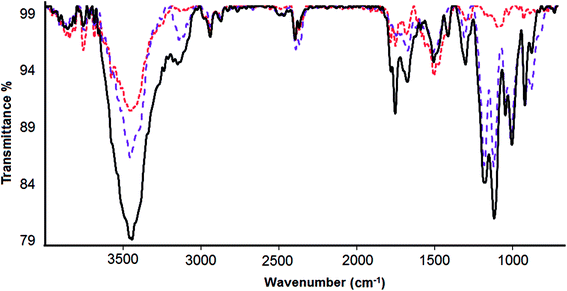
Fourier transform infrared spectroscopy (FTIR) was used to verify the loading of DOX onto CS-prGO (Fig. 5). In the spectrum of prGO, we observed C![[double bond, length as m-dash]](https://www.rsc.org/images/entities/char_e001.gif) O (carbonyl/carboxyl) groups at 1743 cm−1, C
O (carbonyl/carboxyl) groups at 1743 cm−1, C![[double bond, length as m-dash]](https://www.rsc.org/images/entities/char_e001.gif) C (aromatics) at 1642 cm−1, C–O (carboxyl) at 1459 cm−1, (epoxy) C–O group at 1249 cm−1 and C–O (alkoxy) at 1045 cm−1. The broad absorption band at 3442 cm−1 is related to the hydroxyl group. Moreover, in the spectra of CS-prGO, the peaks at 3445, 1633, 1463, 1260 and 1069 cm−1 correspond to the prGO peaks, and dominant peaks were observed at 1069 and 1575 cm−1, corresponding to the absorbance of the glucosidic bond, stretching vibration from C
C (aromatics) at 1642 cm−1, C–O (carboxyl) at 1459 cm−1, (epoxy) C–O group at 1249 cm−1 and C–O (alkoxy) at 1045 cm−1. The broad absorption band at 3442 cm−1 is related to the hydroxyl group. Moreover, in the spectra of CS-prGO, the peaks at 3445, 1633, 1463, 1260 and 1069 cm−1 correspond to the prGO peaks, and dominant peaks were observed at 1069 and 1575 cm−1, corresponding to the absorbance of the glucosidic bond, stretching vibration from C![[double bond, length as m-dash]](https://www.rsc.org/images/entities/char_e001.gif) O of –NHCO– and the N–H bending of NH2. Fig. 5c shows the FTIR spectrum of the DOX/CS-prGO hybrid. The characteristic peaks at 2921, 1712, 1633, 1461, and 1066 cm−1 were assigned to quinone and ketone carbonyl groups.39–41 Moreover, the peaks at 1253, 998 and 886 cm−1 were due to the stretching bands of the C–O–C groups,42,43 the primary amine NH2 wag and the N–H deformation bonds, respectively.44 These dominant peaks overlapped with the peaks of CS and prGO. The peak of the –OH group had a small shift to the lower band and reached a value of 3431 cm−1. The additional absorbance bands and bond width of the peaks in the spectrum of DOX/CS-prGO confirm the effective loading of DOX onto CS-prGO.
O of –NHCO– and the N–H bending of NH2. Fig. 5c shows the FTIR spectrum of the DOX/CS-prGO hybrid. The characteristic peaks at 2921, 1712, 1633, 1461, and 1066 cm−1 were assigned to quinone and ketone carbonyl groups.39–41 Moreover, the peaks at 1253, 998 and 886 cm−1 were due to the stretching bands of the C–O–C groups,42,43 the primary amine NH2 wag and the N–H deformation bonds, respectively.44 These dominant peaks overlapped with the peaks of CS and prGO. The peak of the –OH group had a small shift to the lower band and reached a value of 3431 cm−1. The additional absorbance bands and bond width of the peaks in the spectrum of DOX/CS-prGO confirm the effective loading of DOX onto CS-prGO.
Loading of DOX onto the CS-prGO nanocomposite
The amount of DOX loaded onto the CS-prGO nanocomposite is determined based on the standard curve of DOX absorbance to its concentration at 480 nm (Fig. 6A). The loading percentage of DOX onto the nanocomposite was calculated using the following equation:| Loading% = [(Cint – Cs)/Cint] × 100 |
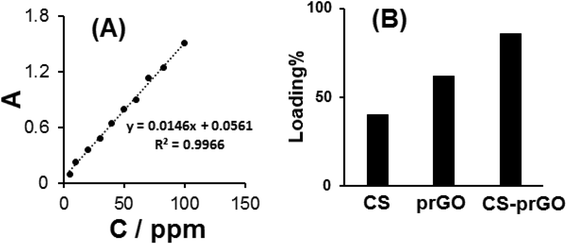 | ||
| Fig. 6 (A) The calibration curve of DOX absorbance vs. its concentration. (B) Comparison of the loaded DOX percent onto prGO and CS-prGO. | ||
Fig. 6B shows the percentage of loaded DOX onto prGO and CS-prGO in 0.1 M PBS (pH 7.00) at room temperature and shaking time of 3 h. As shown, the amount of DOX loaded onto the CS-prGO nanocomposite was high as compared to that in the case of prGO. The result implies that CS-prGO forms stronger hydrogen bonds with DOX than prGO due to the presence of the –OH and –NH2 groups of chitosan.
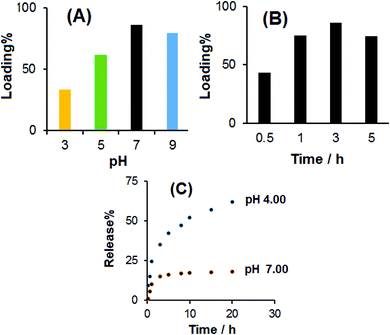
The effect of the pH of the PBS solution on the loading percentage of DOX at room temperature and shaking time of 3 h was investigated, and the results are shown in Fig. 7A. The results showed that in the pH range from 3.00 to 7.00, the loading amount of DOX increased. Therefore, the natural medium is favorable for loading DOX. This may be due to the strongest hydrogen bonding interaction of –OH, –NH2 and –COOH of CS-prGO with –NH2 and –OH of DOX. Under acidic and basic conditions, the loading amount of DOX was decreased due to different degrees of hydrogen bonding attributed to the –NH2 and –COOH groups of CS-prGO and DOX, respectively.
Fig. 7B shows the effect of the shaking time on the loading amount of DOX onto CS-prGO in 0.1 M PBS (pH 7.00) at room temperature. The results showed that in the range of 0.5–5 h shaking time, the loading percent of DOX increased with time. The improvement was observed in the time range of 0.5–3 h and decreased when the shaking time exceeded 3 h due to the degradation of DOX in the aqueous solution. Therefore, the optimum loading time of 3 h was selected for the loading of DOX onto CS-prGO.
On-demand release of DOX from the DOX/CS-prGO hybrid
Fig. 7C shows the release behavior of DOX from CS-prGO at different times in the 0.1 M PBS solution at pH 4.00 and 7.00. As found, 10% of DOX loaded onto CS-prGO was released after 1 h at pH 7.00, whereas 25% of DOX was released at pH 4.00. As discussed in the effect of pH on the loading of DOX, the hydrogen binding between DOX and the CS-prGO nanocomposite at pH 7.00 is strong, and the resulting release of DOX is low. Moreover, in acidic pH, DOX is protonated and water soluble; thus, the release of DOX is much higher than that under neutral conditions. After 20 h, 18% and 62% of DOX was released at pH 7.00 and 4.00, respectively.Conclusions
In this study, a novel and efficient nanocarrier based on porous reduced graphene oxide and chitosan polymer (CS-prGO) was developed. The results showed that the CS-prGO nanocarrier could form the DOX/CS-prGO hybrid due to hydrogen bonding interaction with DOX. An efficient loading of DOX (86% at pH 7.00 and time 3 h) was observed onto CS-prGO as compared to that in the case of prGO. It was found that CS-prGO formed stronger hydrogen bonds with DOX than prGO due to the presence of the –OH and –NH2 groups of chitosan. In addition, the release experiments showed that the release rate of DOX from CS-prGO at pH 7.00 was slow, whereas a faster release rate in an acidic environment at pH 4.00 was observed. Therefore, the design of a novel hybrid nanocarrier based on the CS-prGO composite may provide a successful potential application for many therapeutic drugs, especially DOX, for clinical treatment.Conflicts of interest
There are no conflicts to declare.Acknowledgements
The authors are sincerely grateful for the research facilities provided by the Ayatollah Amoli Branch of the Islamic Azad University.References
- Y. Ye, X. Mao, J. Xu, J. Kong and X. Hu, Int. J. Polym. Sci., 2019, 2019, 356 CrossRef.
- X. Wang, Z. Gao, L. Zhang, H. Wang and X. Hu, J. Nanomater., 2018, 2018, 1 Search PubMed.
- M. L. Casais-Molina, C. Cab, G. Canto, J. Medina and A. Tapia, J. Nanomater., 2018, 2018, 1 CrossRef.
- S. Tanreh, A. Shameli and E. Balali, Journal of Applied Chemical Research, 2018, 12, 79 Search PubMed.
- H. Namazi, M. Babazadeh, A. Sarabi and A. Entezami, J. Polym. Mater., 2001, 18, 301 CAS.
- H. Namazi, R. Rakhshaei, H. Hamishehkar and H. S. Kafil, Int. J. Biol. Macromol., 2016, 85, 327 CrossRef CAS.
- A. E. Brooks, B. D. Brooks, S. N. Davidoff, P. C. Hogrebe, M. A. Fisher and D. W. Grainger, Drug Delivery Transl. Res., 2013, 3, 518 CrossRef CAS.
- H. Namazi, BioImpacts, 2017, 7, 73 CrossRef CAS.
- J. S. Son, M. Appleford, J. L. Ong, J. C. Wenke, J. M. Kim, S. H. Choi and D. S. Oh, J. Controlled Release, 2011, 153, 133 CrossRef CAS.
- H. Namazi and M. Adeli, Biomaterials, 2005, 26, 1175 CrossRef CAS.
- S. A. Abraham, D. N. Waterhouse, L. D. Mayer, P. R. Cullis, T. D. Madden and M. B. Bally, Methods Enzymol., 2005, 391, 71 CAS.
- Z. Karimzadeh, S. Javanbakht and H. Namazi, BioImpacts, 2019, 9, 5 CrossRef.
- Z. Shariatinia and Z. Zahraee, J. Colloid Interface Sci., 2017, 501, 60 CrossRef CAS.
- N. Tyagi, Y. H. Song and R. De, J. Drug Targeting, 2019, 27, 394 CrossRef CAS PubMed.
- J. Zhao, Y. Wang, Y. Ma, Y. Liu, B. Yan and L. Wang, Carbohydr. Polym., 2019, 203, 356 CrossRef CAS.
- S. Boulahneche, R. Jijie, A. Barras, F. Chekin, S. Singh, J. Bouckaert, M. Medjram, S. Kurungot, R. Boukherroub and S. Szunerits, J. Mater. Chem. B, 2017, 5, 6557 RSC.
- P. Horcajada, T. Chalati, C. Serre, B. Gillet, C. Sebrie, T. Baati, J. F. Eubank, D. Heurtaux, P. Clayette, C. Kreuz, J. S. Chang, Y. K. Hwang, V. Marsaud, P. N. Bories, L. Cynober, S. Gil, G. Ferey, P. Couvreur and R. Gref, Nat. Mater., 2010, 9, 172 CrossRef CAS PubMed.
- M. S. Usman, M. Z. Hussein, A. U. Kura, S. Fakurazi, M. J. Masarudin and F. F. Saad, Molecules, 2018, 23, 500 CrossRef.
- L. He, Q. Wang, D. Mandler, M. Li, R. Boukherroub and S. Szunerits, Biosens. Bioelectron., 2016, 75, 389 CrossRef CAS.
- T. H. Han, Y. K. Huang, A. T. L. Tan, V. P. Dravid and J. Huand, J. Am. Chem. Soc., 2011, 133, 15264 CrossRef CAS.
- B. Zareyy, F. Chekin and Sh. Fathi, Russ. J. Electrochem., 2019, 55, 333 CrossRef.
- F. Chekin, S. K. Singh, A. Vasilescu, V. M. Dhavale, S. Kurungot, R. Boukherroub and S. Szunerits, ACS Sens., 2016, 1, 1462 CrossRef CAS.
- M. Peruzynska, K. Cendrowski, M. Barylak, M. Tkacz, K. Piotrowska, M. Kurzawski, E. Mijowska and M. Drozdzik, Toxicol. In Vitro, 2017, 41, 205 CrossRef CAS.
- M. Feito, M. Vila, M. Matesanz, J. Linares, G. Goncalves, P. Marques, M. Vallet-Regi, J. Rojo and M. Portoles, J. Colloid Interface Sci., 2014, 432, 221 CrossRef CAS.
- K. Lategan, H. Alghadi, M. Bayati, M. Fidalgo and E. Pool, Nanomaterials, 2018, 8, 125 CrossRef.
- M. A. Akl, A. Kartal-Hodzic, T. Oksanen, H. R. Ismael, M. M. Afouna, M. Yliperttula, A. M. Samy and T. Viitala, J. Drug Delivery Sci. Technol., 2016, 32, 10 CrossRef CAS.
- F. Farjadian, M. Moghoofei, S. Mirkiani, A. Ghasemi, N. Rabiee, S. Hadifar, A. Beyzavi, M. Karimi and M. R. Hamblin, Biotechnol. Adv., 2018, 36, 968 CrossRef CAS.
- N. Rabiee, S. Deljoo and M. Rabiee, Asian J. Nanosci. Mater., 2018, 2, 66 Search PubMed.
- G. F. Perotti, T. Kijchavengkul, R. A. Auras and V. R. L. Constantino, J. Braz. Chem. Soc., 2017, 28, 649 CAS.
- P. P. Zuo, H. F. Feng, Z. Z. Xu, L. F. Zhang, Y. L. Zhang, W. Xia and W. Q. Zhang, Chem. Cent. J., 2013, 7, 39 CrossRef.
- H. T. Nikerel, M. E. Karabekmez, S. Eraslan and B. Kirdar, Sci. Rep., 2018, 8, 13672 CrossRef.
- E. K. Lim, W. Sajomsang, Y. Choi, E. Jang, H. Lee, B. Kang, E. Kim, S. Haam, J. S. Suh, S. J. Chung and Y. M. Huh, Nanoscale Res. Lett., 2013, 8, 467 CrossRef.
- Y. Liu, J. Peng, S. Wang, M. Xu, M. Gao, T. Xia, J. Weng, A. Xu and S. Liu, NPG Asia Mater., 2018, 10, 458 CrossRef.
- F. Chekin, K. Bagga, P. Subramanian, R. Jijie, S. K. Singhe, S. Kurungote, R. Boukherroub and S. Szunerits, Sens. Actuators, B, 2018, 262, 991 CrossRef CAS.
- D. M. Jaya Seema, B. Saifullah, M. Selvanayagam, S. Gothai, M. Z. Hussein, S. K. Subbiah, N. M. Esa and P. Arulselvan, Pharmaceutics, 2018, 10, 109 CrossRef.
- J. Jagiello, J. Judek, M. Zdrojek, M. Aksienionek and L. Lipinska, Mater. Chem. Phys., 2014, 148, 507 CrossRef CAS.
- D. M. Guldi, M. Marcaccio, D. Paolucci, F. Paolucci, N. Tagmatarchis, D. Tasis, E. Vazquez and M. Prato, Angew. Chem., Int. Ed. Engl., 2003, 42, 4206 CrossRef CAS.
- H. Murakami, T. Nomura and N. Nakashima, Chem. Phys. Lett., 2003, 378, 481 CrossRef CAS.
- X. Yang, X. Zhang, Z. Liu, Y. Ma, Y. Huang and Y. Chen, J. Phys. Chem., 2008, 112, 17554 CAS.
- T. Kuila, S. Bose, P. Khanra, N. H. Kim, K. Y. Rhee and J. H. Lee, Composites, Part A, 2011, 42, 1856 CrossRef.
- D. C. Marcano, D. V. Kosynkin, J. M. Berlin, A. Sinitskii, Z. Z. Sun, A. Slesarev, L. B. Alemany, W. Lu and J. M. Tour, ACS Nano, 2010, 4, 4806 CrossRef CAS.
- R. Mohammad-Rezaei and H. Razmi, Int. J. Nanosci. Nanotechnol., 2016, 12, 233 Search PubMed.
- D. Li, M. B. Muller, S. Gilje, R. B. Kaner and G. G. Wallace, Nat. Nanotechnol., 2008, 3, 101 CrossRef CAS.
- W. L. Zhang and H. J. Choi, Langmuir, 2012, 28, 7055 CrossRef CAS.
Footnote |
| † Electronic supplementary information (ESI) available. See DOI: 10.1039/c9ra04977k |
| This journal is © The Royal Society of Chemistry 2019 |

