 Open Access Article
Fenton's reagent-enhanced supercritical water oxidation of wastewater released from 3-hydroxypyridine production
Junru Bu,
Huan Liu and
Chunmian Lin *
*
College of Environment, Zhejiang University of Technology, Hangzhou 310014, Zhejiang, China. E-mail: lcm@zjut.edu.cn
First published on 17th September 2019
Abstract
A study on Fenton's reagent-enhanced supercritical water oxidation (SCFO) of wastewater released from 3-hydroxypyridine production was carried out in this paper. The effects of temperature, oxidant multiple, residence time, Fe2+ concentration, and pH on the degradation efficiency of wastewater were investigated. The Plackett–Burman test was designed to evaluate various factors, namely, temperature, oxidant multiple, and pH, which were found to significantly affect degradation efficiency. Response surface analysis was performed to optimize the parameter levels of the main influencing factors. The results indicated that the optimal conditions required for the oxidative degradation of wastewater in the SCFO systems were pH of 3, temperature of 473 °C, oxidant multiple of 7, Fe2+ concentration of 0.5 mg L−1, and residence time of 262.6 s (flow rate: 1.5 mL min−1). Under these conditions, the total organic carbon removal rate of the wastewater could reach 98.1%. The activation energy of the wastewater under SCFO conditions was 55.3 kJ mol−1, and the pre-exponential factor A was 52.8 s−1.
1 Introduction
3-Hydroxypyridine is a toxic and volatile nitrogen-containing heterocyclic organic compound, which is miscible in water in any proportion and facilitates the dissolution of most organic compounds in water. Moreover, because of its special properties and structure, it is widely used in coking and in chemical, pharmaceutical, pesticide, and other industries.1–3 With the economic development, wastewater release from 3-hydroxypyridine production is continuously increasing because of the growing demand for 3-hydroxypyridine. In addition, the properties of 3-hydroxypyridine are stability and toxicity. Therefore, technologies are required for the effective treatment of 3-hydroxypyridine wastewater.4–6The supercritical water oxidation (SCWO) technology is an advanced oxidation technique that uses water as a medium and utilizes the characteristics of water in a supercritical state to degrade organic matter.7–12 Under supercritical conditions (T > 374 °C, P > 22.1 MPa), water can be homogeneously mixed with organic matter and oxidants in any ratio to form a homogeneous phase without phase-to-phase mass transfer resistance, which increases the reaction rate.13–15 However, so far, SCWO has not been widely applied mainly because of the problems associated with it such as its temperature and pressure requirements, equipment requirements, corrosion, salt deposition, equipment clogging, and heat recovery.16–18
Fenton's reagent is a combination of ferrous salt and H2O2. Fenton oxidation is an advanced oxidation method that mainly relies on the strong oxidizing properties of the Fenton's reagent to degrade pollutants.19–22 Catalysis by Fe2+ can make H2O2 decompose to produce hydroxyl radicals (HO˙) with extremely strong oxidizing properties, thus effectively oxidizing pollutants in water. Preliminary studies have shown that the introduction of Fe2+ into SCWO with H2O2 as the oxidant (SCFO) can enhance the effect of SCWO on the degradation of organic pollutants, play a synergistic role in the Fenton oxidation and SCWO, or moderate the reaction conditions23.
So far, the research on SCFO has been limited to simulating wastewater.23 The treatment of actual wastewater by SCFO has not been reported, and the optimal conditions for the oxidative degradation of pollutants in the SCFO systems have not been systematically investigated. We first explored the effects of temperature, oxidant multiple, residence time, Fe2+ concentration, and pH on the degradation efficiency of actual organic wastewater released from 3-hydroxypyridine production in SCFO systems and then designed the Plackett–Burman (PB) test to evaluate various factors and screen significant factors affecting degradation. Next, the response surface methodology was used to optimize the reaction conditions of the system, and a quadratic regression equation model was established. The kinetics of the wastewater in SCFO were studied to further clarify the SCFO system and provide basic data for the industrial application of SCWO.
2 Experimental
2.1 Materials and devices
H2O2 (analytical reagent, 30 wt%), purchased from Shanghai Lingfeng Chemical Reagent Limited Company, was applied as an oxidant. FeSO4·7H2O (analytical reagent, ≥98%), purchased from Sinopharm Chemical Reagent Limited Company, was used to provide Fe2+ in SCWO. H2SO4 (analytical reagent, 95.0–98.0%), purchased from Xiqiao Chemical Limited Company, was used to provide H+ in SCWO. Wastewater from 3-hydroxypyridine production was obtained from Zhejiang Supor Pharmaceutical Limited Company (Shaoxing) and filtered before the experiment to prevent the high-pressure constant current pump from being blocked. The basic parameters are shown in Table 1. The deionized water was homemade in the laboratory.| Parameter | TOC (mg L−1) | pH | SS (mg L−1) | Color | Salt (mg L−1) | Odor |
|---|---|---|---|---|---|---|
| Value | 16![[thin space (1/6-em)]](https://www.rsc.org/images/entities/char_2009.gif) 000 000 |
9.3 | 61.6 | Light yellow | 100 | Irritating smell |
A schematic of the device used in this study is shown in Fig. 1. Wastewater, H2O2, Fe2+ solution (1.5 mg L−1), and dilute sulfuric acid were mixed using a low-pressure gradient mixer and continuously driven into a stainless steel tube (316 L) reactor by a high-pressure constant current pump (outer diameter 3.2 mm, inner diameter 1.5 mm, length 30 m). The reactor could be maintained at a specific temperature and pressure by the heating furnace and back pressure valve, respectively, and the organic pollutants in the wastewater were degraded therein. The reaction mixture was cooled through a cooling cell with water. The tail liquid was collected and analyzed using a Shimadzu Total Organic Carbon Analyzer (TOC-V CPH/CPN, Japan).
2.2 Control of conditions
(1) Oxidant multiple: oxidant multiple (n) is defined as the ratio between the amounts of H2O2 supplied to the amounts of H2O2 required based on the reaction stoichiometry; the reaction equation is presented as follows:| 2C5H5NO + 23H2O2 → 10CO2 + 28H2O + N2 | (1) |
(2) Reaction temperature: the temperature range of the experiment was 380–480 °C.
(3) Residence time: under different supercritical conditions (pressure and temperature), the density of water was different. It is difficult to directly control the residence time of the reactants; thus, the residence time is generally regulated by changing the flow rate.
At a given temperature and pressure, the residence time can be calculated by eqn (2):
 | (2) |
(4) Reaction pressure: the experimental reaction pressure was preset at 23.0 MPa.
(5) Fenton condition control: ① the Fe2+ concentration in the wastewater can be controlled by adjusting the ratio of the Fe2+ solution using a low-pressure gradient mixer; ② pH can be controlled by diluting with H2SO4 solution using a low-pressure gradient mixer.
2.3 Analysis methods and experimental design
(1) Total organic carbon (TOC) of the tail liquid was measured using a Shimadzu TOC Analyzer, and the TOC removal efficiency was characterized as the degradation efficiency of the wastewater.(2) Single-factor experimental design: the effects of temperature, oxidant multiple, residence time, Fe2+ concentration, and pH on the TOC removal efficiency of the wastewater were studied in the SCFO system, and the optimal parameters of each factor were roughly determined.
(3) PB test design: the PB test design was the first step in optimization. It was achieved using the Design Expert 8.0 software to screen factors that markedly affect the wastewater TOC removal efficiency. Two levels, low (−1) and high (+1), were taken for each factor, and 12 trials were performed in all. Each test was repeated 3 times, and the average value was taken as the test result.
(4) Response surface test design: according to the experimental results of the PB test, three significant factors were selected for the Box–Behnken response surface test, and the optimal conditions for wastewater degradation in the SCFO system were determined using the Design Expert 8.0 software. The three factors were studied at three levels, and seventeen sets of experiments were carried out.
3 Single-factor experiment
3.1 Effect of temperature on degradation efficiency
The pressure was 23.0 MPa, the oxidant multiple was 4, the flow rate was 2.0 mL min−1 (residence time was 217.3 s), the Fe2+ concentration was 0.30 mg L−1, and the pH was 3.0. The temperature was changed from 380 °C to 480 °C. Fig. 2 shows the effect of temperature on the TOC removal efficiency of the wastewater. It can be seen from Fig. 2 that the TOC removal efficiency increases with the increase in temperature. This indicates that temperature is an important factor affecting the degradation efficiency of wastewater. As S. V. Prasad Mylapilli et al. reported,24 at a near-critical condition (380 °C), water undergoes ionization with a potential to generate hydronium and hydroxide ions, which act as catalysts and exhibit maximum; the organic compounds in the wastewater were degraded into stable intermediates that required a higher temperature to convert them into permanent gases. Moreover, with the increase in temperature, the following reactions occurred:| H2O2 → 2HO˙ | (3) |
 | (4) |
 | (5) |
 | (6) |
 | (7) |
| R + HO˙ → Intermediates + HO˙ → CO2 + H2O | (8) |
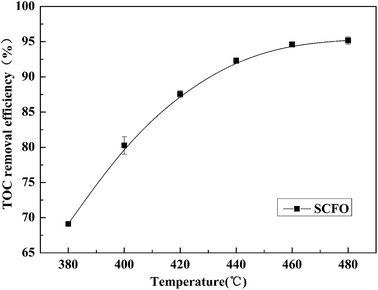 | ||
| Fig. 2 Effect of temperature on TOC removal efficiency of the wastewater (23.0 MPa, oxidant multiple 4, flow rate 2.0 mL min−1, Fe2+ 0.30 mg L−1, pH 3.0). | ||
The generated free active radicals act upon organic molecules to degrade them into simple gases. As the temperature continuously increases, the effect of temperature on the TOC removal efficiency of contaminants gradually decreases. This is because at higher temperatures, the TOC removal efficiency has already reached a higher level and the remaining pollutants are at a lower concentration under a certain residence time condition, which leads to a lower reaction rate. Considering both the pollutant degradation efficiency and the equipment operating cost, 460 °C was considered as the most suitable temperature for degradation.
3.2 Effect of oxidant multiple on the degradation efficiency
Fig. 3 illustrates the change in the TOC removal efficiency of wastewater with oxidant multiple under 420 °C, 23.0 MPa, 2.0 mL min−1 (flow rate), 0.30 mg L−1 (Fe2+ concentration), and 3.0 (pH). It can be seen from the figure that in the SCFO system, when the oxidant multiple changes from 1 to 6, the TOC removal efficiency of the wastewater increases rapidly from 65.8% to 96.2%, respectively. When the oxidant multiple changed from 6 to 10, the increase in the TOC removal efficiency was reduced. This implies that oxidant multiple affects the degradation efficiency but when it reaches a certain point, the influence of the oxidant multiple is no longer obvious. This is because the addition of H2O2 provides more radicals at 420 °C, which act upon the molecules of organic matter. However, excess oxidant results in equilibrium of radicals with H2O2, generating less reactive radicals such as HO2˙ and O2, as mentioned in eqn (4)–(7). Consistent conclusions have also been reported in other research studies.24 Therefore, the following PB test was performed with an oxidant multiple of 6.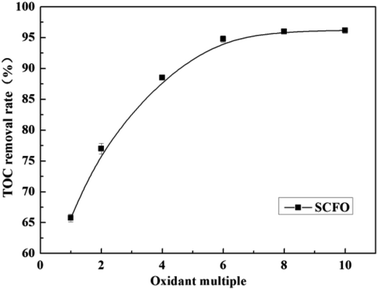 | ||
| Fig. 3 Effect of oxidant multiple on the TOC removal efficiency of the wastewater (420 °C, 23.0 MPa, flow rate 2.0 mL min−1, Fe2+ 0.30 mg L−1, pH 3.0). | ||
3.3 Effect of residence time on the degradation efficiency
The influence of residence time on the TOC removal efficiency of the wastewater is shown in Fig. 4 (temperature 420 °C, pressure 23.0 MPa, oxidant multiple 4, Fe2+ concentration 0.30 mg L−1, pH 3.0, and residence time 98.5–394.0 s). As illustrated in Fig. 4, when the residence time increased, the TOC removal efficiency increased fast and linearly in the early period. Afterwards, the increase in the TOC removal efficiency gradually became gentle. When the residence time increased from 98.5 s to 262.6 s, the TOC removal efficiency rose from 66.1% to 95.0%, respectively, whereas when the residence time changed from 262.6 s to 394.0 s, the TOC removal efficiency did not change much. Because under the conditions the pollutants are almost completely degraded with a residence time of 262.6 s, the low pollutant concentration reduces the reaction rate. This indicates that the residence time is also one of the main factors affecting the complete oxidative degradation of organic matter, but the residence time does not need to increase after the degradation efficiency attains a high level. Therefore, the PB test was performed with a residence time of 262.6 s.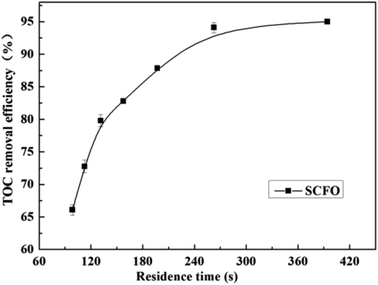 | ||
| Fig. 4 Effect of residence time on the TOC removal efficiency of the wastewater (420 °C, 23.0 MPa, oxidant multiple 4, Fe2+ 0.30 mg L−1, pH 3.0). | ||
3.4 Effect of Fe2+ concentration on degradation efficiency
Fig. 5 shows the changes in TOC removal efficiency under a temperature of 420 °C, pressure of 23.0 MPa, oxidant multiple of 4, residence time of 197.0 s, and pH of 3.0 on changing the Fe2+ concentration. When the Fe2+ concentration was in the lower range, the TOC removal efficiency of the wastewater increased rapidly with the Fe2+ concentration; then, the increase in the TOC removal efficiency became slow. For instance, when the Fe2+ concentration changed from 0.1 mg L−1 to 0.4 mg L−1, the TOC removal efficiency went up rapidly from 69.0% to 91.4%, respectively. However, when the Fe2+ concentration further reached 0.8 mg L−1, the TOC removal efficiency rose slowly to 94.32%. This is because Fe2+ and H2O2 constitute Fenton's reagent, promoting H2O2 to decompose more into HO˙, which has strong oxidation ability, and the following reaction occurs: Fe2+ + H2O2 → Fe3+ + HO˙ + HO−.25 Since the solubility of Fe2+ in SCW is infinite and it catalyzes within a certain concentration range,26 excess Fe2+ plays a negligible role in TOC removal. Therefore, a further increase in the Fe2+ concentration is unnecessary after the TOC removal efficiency attains a high level. The PB test was performed with an Fe2+ concentration of 0.5 mg L−1.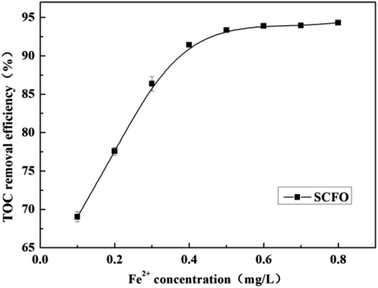 | ||
| Fig. 5 Effect of Fe2+ concentration on the TOC removal efficiency of wastewater (420 °C, 23.0 MPa, oxidant multiple 4, residence time 197.0 s, pH 3.0). | ||
3.5 Effect of pH on the degradation efficiency
The temperature was set at 420 °C, the pressure was 23.0 MPa, the oxidant multiple was 4, the residence time was 197.0 s (2.0 mL min−1), and the Fe2+ concentration was 0.30 mg L−1. As is clear from Fig. 6, when the pH was raised from 1.5 to 3.0, the TOC removal efficiency of the wastewater went up from 75.6% to 93.7%, respectively. However, when the pH increased from 3 to 4.5, the TOC removal efficiency decreased from 93.7% to 68.5%, respectively. This indicates that there is a suitable pH in the SCFO environment for the oxidative degradation of wastewater. On the one hand, when the pH of the solution is too high, H2O2 cannot be catalyzed by Fe2+ to produce HO˙. Furthermore, Fe3+ forms an Fe(OH)3 precipitate with OH−; thus, Fe2+ cannot be regenerated by the reduction reaction of Fe3+, leading to decrease in HO˙ production. On the other hand, low pH inhibits the reaction of H2O2 and Fe2+ to form FeOOH+, which plays a key role in Fe2+ regeneration. Thus, unsuitable pH is unfavorable for the generation of HOFeOOH+, reducing the removal rate of organic matter in wastewater.27,28 The PB test was performed under a pH of 3.0.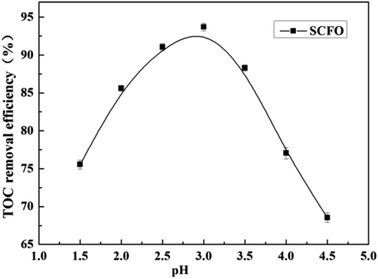 | ||
| Fig. 6 Effect of pH on the TOC removal efficiency of the wastewater (420 °C, 23.0 MPa, oxidant multiple 4, residence time 197.0 s, Fe2+ 0.30 mg L−1). | ||
4 Plackett–Burman test analysis
According to the results of single-factor experiments, low and high levels of the five influencing factors, namely, temperature (460 °C), oxidant multiple (6), residence time (262.6 s), Fe2+ concentration (0.5 mg L−1), and pH (3.0) were considered to design the experiments. The experimental conditions and the detected TOC removal efficiency are shown in Table 2. The effect value and significance of the five factors were analyzed using the Design Expert software 8.0 and are shown in Table 3.| Test number | Temperature (°C) | Oxidant multiple | Residence time (s) | Fe2+ concentration (mg L−1) | pH | TOC removal efficiency (%) |
|---|---|---|---|---|---|---|
| 1 | 440 | 4 | 197.0 | 0.6 | 2 | 92.3 |
| 2 | 480 | 8 | 197.0 | 0.6 | 4 | 96.9 |
| 3 | 440 | 8 | 394.0 | 0.4 | 4 | 91.9 |
| 4 | 480 | 4 | 394.0 | 0.6 | 4 | 93.0 |
| 5 | 480 | 8 | 197.0 | 0.4 | 2 | 97.8 |
| 6 | 440 | 4 | 197.0 | 0.4 | 2 | 90.1 |
| 7 | 440 | 8 | 197.0 | 0.6 | 4 | 93.3 |
| 8 | 440 | 4 | 394.0 | 0.4 | 4 | 92.0 |
| 9 | 480 | 4 | 197.0 | 0.4 | 4 | 95.2 |
| 10 | 480 | 4 | 394.0 | 0.6 | 2 | 93.4 |
| 11 | 480 | 8 | 394.0 | 0.4 | 2 | 98.7 |
| 12 | 440 | 8 | 394.0 | 0.6 | 2 | 95.5 |
| Source | Sum of squares | df | Mean square | F value | p-Value, prob > F |
|---|---|---|---|---|---|
| Model | 62.46 | 5 | 12.49 | 5.60 | 0.0292 |
| A-temperature | 32.74 | 1 | 32.74 | 14.67 | 0.0087 |
| B-oxidant multiple | 27.00 | 1 | 27.00 | 12.10 | 0.0132 |
| C-residence time | 0.087 | 1 | 0.087 | 0.039 | 0.8503 |
| D-Fe2+ concentration | 0.11 | 1 | 0.11 | 0.050 | 0.8301 |
| E-pH | 2.52 | 1 | 2.52 | 1.13 | 0.3288 |
| Residual | 13.39 | 6 | 2.23 | ||
| Cor total | 75.85 | 11 |
In PB analysis, a p-value less than 0.05 indicates significance, while a value greater than 0.1 generally indicates insignificance.29,30 In addition, a smaller p-value and larger F-value indicate a more significant coefficient term.31,32 The data in Table 3 show that the p-value of the model is P < 0.05 and thus, the model is significant. The five factors were ranked as per significance as follows: temperature > oxidant multiple > pH > Fe2+ concentration > residence time; thus, oxidant multiple, temperature, and pH were chosen for the next response surface analysis. Other conditions were set by the optimal conditions of single-factor testing: residence time 262.6 s (1.5 mL min−1) and Fe2+ concentration 0.5 mg L−1.
5 Response surface analysis
5.1 Establishment of response surface model and result analysis
According to the design principle of the response surface center, a three-factor and three-level Box–Behnken response surface test was designed, in which the experimental central point was set to 460 °C, oxidant multiple to 6, and pH to 3. The 3 independent variables and levels are presented in Table 4.| Level | A (temperature)/°C | B (oxidant multiple) | C (pH) |
|---|---|---|---|
| −1 | 440 | 4 | 2 |
| 0 | 460 | 6 | 3 |
| +1 | 480 | 8 | 4 |
Table 5 represents all 17 experiments of the Box–Behnken response surface test. Among them, groups 1–12 were the factorial experiments, and groups 13–17 were the center point repeat experiments. The experimental conditions and the detected TOC removal efficiency are shown in Table 5.
| Number | A: temperature | B: oxidant multiple | C: pH | TOC removal efficiency (%) |
|---|---|---|---|---|
| 1 | 440 | 8 | 3 | 94.9 |
| 2 | 480 | 8 | 3 | 97.8 |
| 3 | 460 | 4 | 2 | 92.6 |
| 4 | 440 | 6 | 2 | 92.9 |
| 5 | 460 | 8 | 4 | 95.1 |
| 6 | 440 | 6 | 4 | 94.0 |
| 7 | 460 | 4 | 4 | 93.5 |
| 8 | 480 | 6 | 2 | 96.4 |
| 9 | 480 | 6 | 4 | 95.3 |
| 10 | 480 | 4 | 3 | 94.5 |
| 11 | 440 | 4 | 3 | 91.7 |
| 12 | 460 | 8 | 2 | 94.2 |
| 13 | 460 | 6 | 3 | 97.7 |
| 14 | 460 | 6 | 3 | 98.0 |
| 15 | 460 | 6 | 3 | 97.9 |
| 16 | 460 | 6 | 3 | 97.5 |
| 17 | 460 | 6 | 3 | 97.2 |
Table 6 shows the results of the analysis of variance (ANOVA) of the TOC removal efficiency. In general, a p-value less than 0.05 indicates that the model terms are significant, whereas values greater than 0.1 are usually considered as insignificant, which is similar to the PB experimental analysis. In addition, the fit of the model can be verified by the calculated coefficient of determination (R2) and adjusted coefficient of determination (Adj R2); R2 should not be less than 0.8 for a reasonable model.33,34 The higher the value of R2, the more the calculated model agrees with the experimental data within the range of experiments.35,36 Moreover, adequate precision (AP) is a measure of the range in a predicted response relative to its associated error. Its desired value is 4 or more.37,38 The value of CV shows the accuracy of the model. The lower the value, the higher the reliability of the model.39,40
| Source | Sum of squares | df | Mean square | F value | p-Value, prob > F |
|---|---|---|---|---|---|
| a R2 = 0.9656, Adj R2 = 0.9214, AP = 12.191, CV = 0.61%. | |||||
| Model | 66.16 | 9 | 7.35 | 21.85 | 0.0003 |
| A-temperature | 13.68 | 1 | 13.68 | 40.65 | 0.0004 |
| B-oxidant multiple | 11.62 | 1 | 11.62 | 34.52 | 0.0006 |
| C-pH | 0.39 | 1 | 0.39 | 1.15 | 0.3190 |
| AB | 4.225 × 10⁻³ | 1 | 4.225 × 10⁻³ | 0.013 | 0.9139 |
| AC | 1.13 | 1 | 1.13 | 3.37 | 0.1090 |
| BC | 2.250 × 10⁻⁴ | 1 | 2.250 × 10⁻⁴ | 6.687 × 10⁻⁴ | 0.9801 |
| A2 | 4.79 | 1 | 4.79 | 14.24 | 0.0069 |
| B2 | 14.83 | 1 | 14.83 | 44.08 | 0.0003 |
| C2 | 15.88 | 1 | 15.88 | 47.18 | 0.0002 |
| Residual | 2.36 | 7 | 0.34 | ||
| Lack of fit | 1.92 | 3 | 0.64 | 5.96 | 0.0587 |
| Pure error | 0.43 | 4 | 0.11 | ||
| Cor total | 68.51 | 16 | |||
As presented in Table 6, the model has an F value of 21.85 and a p-value of less than 0.05 (0.0003), implying that the model for the TOC removal efficiency is significant. Model adequacy is tested through lack-of-fit F-tests.41 The lack-of-fit F-statistic is not considered statistically significant when the p-value is greater than 0.05. The effects of A, B, A2, B2, and C2 on the TOC removal efficiency are extremely significant (P < 0.01), while those of C, AB, AC, and BC are not significant (P > 0.05). Insignificant terms are excluded to improve the model. When all insignificant terms are removed, the modified regression model for TOC removal efficiency can be represented by the following equation:
| Y = 97.66 + 1.31A + 1.21B − 0.22C + 0.032AB − 0.53AC + (7.500 × 10⁻³)BC − 1.07A2 − 1.88B2 − 1.94C2 | (9) |
In addition, the R2 and Adj R2 values were 96.56% and 92.14%, respectively. These values indicated that the model adequately represented the experimental data, and 92.14% of the variations could be covered by the fitted model. The value of AP is 12.191, showing that the model has a strong response signal and high precision, which can reflect the experimental results well. A CV value of 0.61%, which is less than 10%, further illustrated that the model was stable and reproducible. According to the above-mentioned analysis, the model can predict the TOC removal efficiency of the wastewater under different conditions.
The diagnostic details provided by the Design Expert 8.0 software can be used to ensure the adequacy of the model. Fig. 7(a) and (b) show the normal probability plot of residuals and plot of residuals versus predicted response, respectively. All the points in Fig. 7(a) are distributed along a straight line, which shows that the residuals are normally distributed.42 It can be seen from the graph in Fig. 7(b) that all the points are scattered randomly around 0, and the changes are within a constant range of the entire residual, meaning that the data have normally distributed residuals for each value of an independent variable and constant standard deviation.42
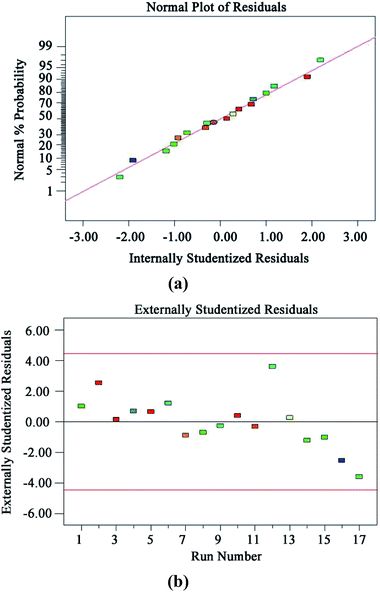 | ||
| Fig. 7 Model diagnosis plots: normal probability plot of residuals (a); plot of residuals vs. predicted response (b). | ||
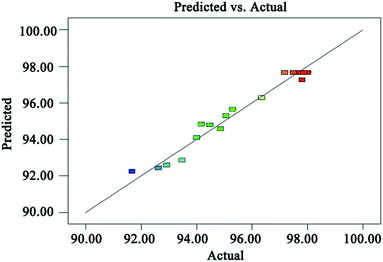
Fig. 8 is a graph showing a comparison of the predicted TOC removal efficiency with the experimental results. It can be seen from Fig. 8 that the relative error between the measured value and the predicted value of the TOC removal efficiency is less than 1%, which indicates that the proposed model is reliable to predict the TOC removal efficiency.
5.2 3D and contour plots for TOC removal efficiency
The 3D response surface and contour plots of the quadratic model were obtained using the Design Expert 8.0 software to evaluate the effect of the interaction of A and B, A and C, and B and C on the TOC removal efficiency (Fig. 9, 10 and 11, respectively).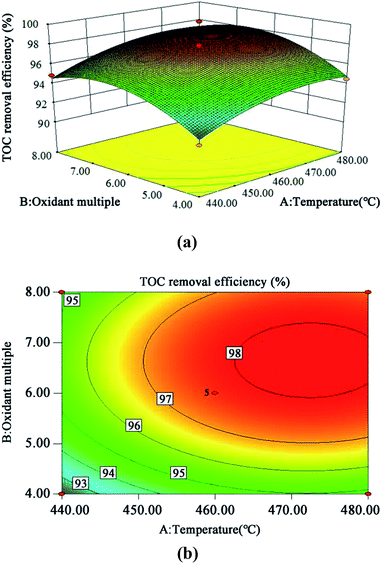 | ||
| Fig. 9 3D (a) and contour plots (b) for TOC removal efficiency as a function of temperature and oxidant multiple interaction (residence time 262.6 s and Fe2+ 0.5 mg L−1). | ||
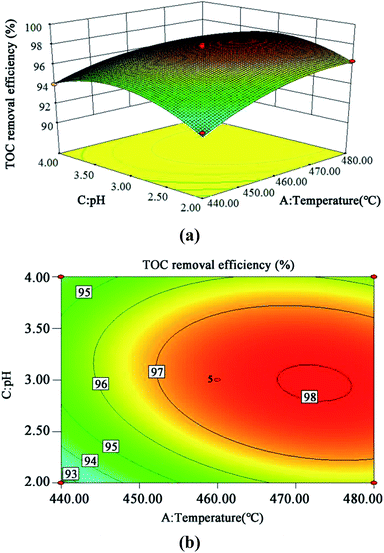 | ||
| Fig. 10 3D (a) and contour plots (b) for TOC removal efficiency as a function of temperature and pH interaction (residence time 262.6 s and Fe2+ 0.5 mg L−1). | ||
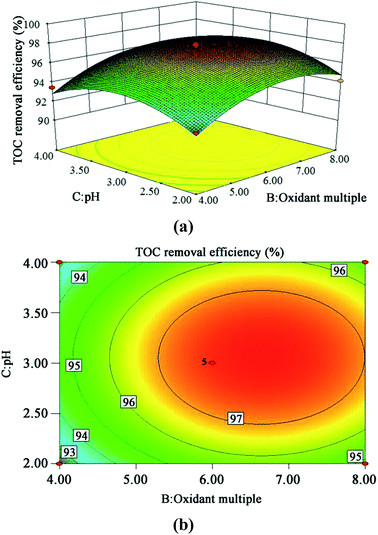 | ||
| Fig. 11 3D (a) and contour plots (b) for TOC removal efficiency as a function of oxidant multiple and pH interaction (residence time 262.6 s and Fe2+ 0.5 mg L−1). | ||
The steeper the slope of a factor in the 3D plot, the greater the influence of this factor on the independent variable (TOC removal efficiency). On the contrary, if the slopes are gentle, the factor has no significant effect.43 If the shape of the contour plot is similar to an ellipse, the interaction between the two factors has a significant effect on the TOC removal efficiency. In contrast, if the shape is similar to a circle, the effect is not significant.43 As is clear from Fig. 9–11, the influence of the three factors on the TOC removal efficiency of the wastewater is in the following order: temperature > oxidant multiple > pH. This is consistent with the result of the PB test analysis. Moreover, the interaction between temperature and pH had the most significant effect on the removal rate of TOC, whereas the interaction between oxidant multiple and pH was slightly larger than the interaction between temperature and oxidant multiple.
5.3 Optimization of process conditions
The experimental results conveyed that except pH, the higher the values of temperature, oxidant multiple, Fe2+ concentration and residence time, the greater the degradation efficiency. However, in practical industrial applications, a very high temperature and oxidant multiple increase equipment requirements and operating cost;44 excess Fe2+ will be deposited, causing the blockage of the reactor, affecting the heat transfer and degradation of pollutants,45 and an additional residence time results in lower processing capacity of the equipment. Therefore, considering the feasibility of the actual operation, results of the PB test and response surface analysis, the optimum conditions were pH of 3, temperature of 473 °C, oxidant multiple of 7, Fe2+ concentration of 0.5 mg L−1, and residence time of 262.6 s (1.5 mL min−1), under which the TOC removal efficiency obtained using the Design Expert 8.0 software was 98.3%.Three parallel tests were performed under the above-mentioned optimized conditions to verify the predicted result. The obtained TOC removal efficiency is presented in Table 7. The data in Table 7 demonstrate that the relative deviation between the predicted value and the experimental data is less than 0.5%, which implies that the model is accurate and effective.
| Data (%) | Experiment 1 | Experiment 2 | Experiment 3 |
|---|---|---|---|
| Predicted values | 98.3 | 98.3 | 98.3 |
| Experimental values | 97.9 | 98.1 | 98.3 |
| Relative error | 0.40 | 0.20 | 0.00 |
6 Kinetics analysis
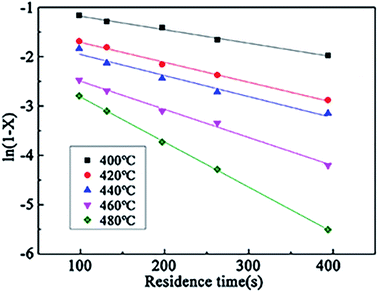
The power exponential equation (eqn (10)) was used to describe the continuous reaction kinetics of the wastewater in the SCFO system:
 | (10) |
In the SCFO system, both H2O and O2 are in excess; thus, the concentration of water and oxidant can be considered to be constant, which means that the corresponding reaction order is 0. According to previous studies,26,46 for most organic compounds, the reaction order is 1 and thus, it is assumed that α is 1. Then, eqn (10) was integrated to get the following equation when X is neither 0 nor 1:
| ln(1 − X) = −kτ | (11) |
According to the experimental data of the wastewater in the SCFO system, ln(1 − X) at different temperatures (400–480 °C) was linearly regressed on changing τ. The results are shown in Fig. 12. It can be seen from Fig. 12 that ln(1 − X) and τ have a linear relationship at different reaction temperatures, and the assumption of the first-order reaction is reasonable. The reaction rate constants at different reaction temperatures can be derived from the figure, as shown in Table 8.
| Temperature/°C | k/S−1 | ln![[thin space (1/6-em)]](https://www.rsc.org/images/entities/char_2009.gif) k k |
|---|---|---|
| 400 | 0.00274 | −5.8998 |
| 420 | 0.00404 | −5.5115 |
| 440 | 0.00427 | −5.4561 |
| 460 | 0.00570 | −5.1673 |
| 480 | 0.00914 | −4.6951 |
According to the logarithmic form of the Arrhenius formula (eqn (12)), a straight line was obtained by linear fitting. The activation energy (Ea) in the range of 400–480 °C was about 55.3 kJ mol−1, the pre-exponential factor (A) was 52.8 s−1, and R2 was 0.99.
ln![[thin space (1/6-em)]](https://www.rsc.org/images/entities/char_2009.gif) k = ln k = ln![[thin space (1/6-em)]](https://www.rsc.org/images/entities/char_2009.gif) k0 − Ea/RT k0 − Ea/RT
| (12) |
7 Conclusion
We analyzed the SCFO system for the treatment of the wastewater released from 3-hydroxypyridine production. A single-factor experiment was designed to study the effects of temperature, oxidant multiple, residence time, Fe2+ concentration, and pH on the TOC removal efficiency. According to the experimental results, the optimal parameters of each factor were roughly determined: temperature of 460 °C, oxidant multiple of 6, residence time of 262.6 s, Fe2+ concentration of 0.5 mg L−1, and pH of 3. A PB test was performed at high and low levels. Then, three significant factors, namely, oxidant multiple, temperature, and pH were screened for response surface analysis, and a quadratic regression equation for the model was established. The results showed that the p-value of the model was less than 0.05, the p-value of lack-of-fit was 0.0587 (>0.05), R2 was 0.9656, Adj R2 was 0.9214, CV was 0.61% (<10%), and AP was 12.191 (>4); all these results demonstrate that the model is stable, adequate, and effective, and it performs well to predict the TOC removal efficiency of the wastewater under different conditions.Response surface analysis showed that the influence of the three factors on the model was ranked as follows: temperature > oxidation multiple > pH. The optimal conditions for the oxidative degradation of the wastewater in the SCFO system are pH of 3, temperature of 473 °C, oxidant multiple of 7, Fe2+ concentration of 0.5 mg L−1, and residence time of 262.6 s (1.5 mL min−1). Under these conditions, the TOC removal efficiency could reach 98.1% on average. The relative errors between the verification experimental data and the predicted values by the model were all within 1%.
The degradation kinetics of the wastewater in the SCFO system was studied by the power exponential equation method. The oxidative degradation conformed to the first order, the activation energy was 55.3 kJ mol−1, and the pre-exponential factor (A) was 52.8 s−1.
Conflicts of interest
There are no conflicts to declare.Acknowledgements
Authors would like to acknowledge the National Natural Science Foundation of China (CN) [Project No. 2137716] for the financial support.References
- H. B. Zhao, J. J. Qi, D. Shao, T. Wang, Z. M. Zhang and S. Li, Chem. Ind. Times, 2013, 23(6), 27–32 Search PubMed.
- G. Y. Shen, Y. C. Yao and Y. B. Zhang, Pyridine compounds and their applications, 2015 Search PubMed.
- Y. Jin, Q. Y. Yue and K. L. Yang, J. Environ. Sci., 2018, 63, 43–49 CrossRef PubMed.
- L. B. Zhang and X. L. Wei, Environ. Chem., 2009, 28(3), 364–368 CAS.
- D. R. Stapleton, R. J. Emery, D. Mantzavinos and M. Papadaki, Process Saf. Environ. Prot., 2006, 84(B4), 313–316 CrossRef CAS.
- D. R. Stapleton, I. K. Konstantinou, D. G. Hela and M. Papadaki, Water Res., 2009, 43(16), 3964–3973 CrossRef CAS PubMed.
- M. X. Xu, L. Fang, S. Y. L. Ding and C. M. Lin, Desalin. Water Treat., 2017, 99, 309–314 CrossRef CAS.
- K. Wang, L. Y. Bao, Y. Xing, P. Q. Yuan, Z. M. Cheng and W. K. Yuan, Ind. Eng. Chem. Res., 2017, 56(45), 12920–12926 CrossRef CAS.
- D. H. Xu, S. Z. Wang, J. Zhang, X. Y. Tang, Y. Guo and C. B. Huang, Chem. Eng. Res. Des., 2015, 94, 396–406 CrossRef CAS.
- N. Paksung and Y. Matsumura, Ind. Eng. Chem. Res., 2015, 54(31), 7604–7613 CrossRef CAS.
- S. J. Zhang, Z. H. Zhang, R. Zhao, J. J. Gu and J. Liu, Chem. Eng. Commun., 2016, 204(2), 265–282 CrossRef.
- A. Gidner and L. Stenmark, Blood, 2001, 108(11), 1–16 Search PubMed.
- Z. Q. Zhu, Supercritical fluid technology, 2000 Search PubMed.
- Y. C. Lei and D. Wang, Advanced oxidation technology for water treatment, 2002 Search PubMed.
- F. Vogel, K. A. Smith, J. W. Tester and W. A. Peters, AIChE J., 2002, 48(8), 1827–1839 CrossRef CAS.
- K. Peter and D. Eckhard, Chem. Eng. J., 2001, 83, 207–214 CrossRef.
- M. S. Khan and S. N. Rogak, J. Supercrit. Fluids, 2004, 30(3), 359–373 CrossRef CAS.
- H. Y. Shin, K. Matsumoto, H. Higashi, Y. Iwai and Y. Arai, J. Supercrit. Fluids, 2001, 21(2), 105–110 CrossRef CAS.
- J. Lan, Y. X. Ren, Y. B. Lu, G. L. Liu, H. P. Luo and R. D. Zhang, Chem. Eng. J., 2019, 359, 1139–1149 CrossRef CAS.
- D. Gamaralalage, O. Sawai and T. Nunoura, J. Hazard. Mater., 2019, 364, 791–799 CrossRef CAS PubMed.
- M. Zhang and W. Gu, Processes, 2018, 6(5), 1–22 CrossRef PubMed.
- S. Bayar, T. M. Massara, R. Boncukcuoglu, O. T. Komesli and S. Malamis, Desalin. Water Treat., 2018, 112, 106–111 CrossRef CAS.
- J. R. Bu, H. Liu and C. M. Lin, Petrochem. Technol., 2019, 48, 143–148 CAS.
- S. V. Prasad Mylapilli and S. N. Reddy, J. Environ. Chem. Eng., 2019, 7(3), 1–9 Search PubMed.
- H. Q. Zhao, X. C. Gao, Z. H. Wang and J. H. Gao, CIESC Journal, 2016, 67(6), 2625–2630 CAS.
- J. L. Wang, C. M. Lin, Q. A. Chen and L. Y. Wei, J. Zhejiang Univ. Technol., 2003, 31(5), 524–527 CAS.
- H. W. Hu and X. Y. Li, Bull. Sci. Technol., 2012, 4(28), 220–222 Search PubMed.
- C. J. Xie, K. Zhu and J. Li, Water Purif. Technol., 2007, 26, 13–16 CAS.
- Y. M. Gong, S. Z. Wang, H. D. Xu, Y. Guo and X. Y. Tang, Waste Manage., 2015, 43, 343–352 CrossRef CAS PubMed.
- A. L. Ahmad, S. C. Low, S. R. A. Shukor and A. Ismail, Sep. Purif. Technol., 2009, 66, 177–186 CrossRef CAS.
- J. F. Fu, Y. Q. Zhao and Q. L. Wu, J. Hazard. Mater., 2007, 144, 499–505 CrossRef CAS PubMed.
- N. Aghamohammadi, H. B. A. Aziz, M. H. Isa and A. A. Zinatizadeh, Bioresour. Technol., 2007, 98, 3570–3578 CrossRef CAS PubMed.
- A. Hedayati and S. M. Ghoreishi, J. Supercrit. Fluids, 2015, 100, 209–217 CrossRef CAS.
- A. M. Joglekar and A. T. May, Cereal Foods World, 1987, 32, 857–859 Search PubMed.
- M. J. K. Bashir, H. A. Aziz, M. S. Yusoff, S. Q. Aziz and S. Mohajeri, J. Hazard. Mater., 2010, 182, 115–122 CrossRef CAS PubMed.
- M. Ahmadi, F. Vahabzadeh, B. Bonakdarpour, E. Mofarrah and M. Mehranian, J. Hazard. Mater. B, 2005, 123, 187–195 CrossRef CAS PubMed.
- R. L. Mason, R. F. Gunst and J. L. Hess, Statistical Design and Analysis of Experiments, Eighth Applications to Engineering and Science, 2nd edn, 2003 Search PubMed.
- M. J. K. Bashir, H. A. Aziz, M. S. Yusoff, S. Q. Aziz and S. Mohajeri, J. Hazard. Mater., 2010, 182, 115–122 CrossRef CAS PubMed.
- H. S. Li, S. Q. Zhou, Y. B. Sun and J. A. Lv, Waste Manage., 2010, 30, 2122–2129 CrossRef CAS PubMed.
- Md. Altaf, B. J. Naveena and G. Reddy, Bioresour. Technol., 2007, 98, 498–503 CrossRef CAS PubMed.
- D. C. Montgomery, Design and Analysis of Experiments, 3rd edn, 1991 Search PubMed.
- A. L. Ahmad, S. C. Low, S. R. A. Shukor and A. Ismail, Sep. Purif. Technol., 2009, 66, 177–186 CrossRef CAS.
- I. Arslan-Alaton, G. Tureli and T. Olmez-Hanci, J. Photochem. Photobiol., A, 2009, 202, 142–153 CrossRef CAS.
- E. Adar, M. Ince and M. S. Bilgili, Desalin. Water Treat., 2019, 161, 243–253 CrossRef.
- V. Vadillo, J. Sanchez-Oneto, J. Portela and E. J. M. de la Ossa, Ind. Eng. Chem. Res., 2013, 52(23), 7617–7629 CrossRef CAS.
- S. L. Li, Y. P. Zhou and J. J. Liu, J. Phys. Chem. C, 2009, 516–517 Search PubMed.
| This journal is © The Royal Society of Chemistry 2019 |


