DOI:
10.1039/C9RA05586J
(Paper)
RSC Adv., 2019,
9, 27674-27683
Ce-doped UiO-67 nanocrystals with improved adsorption property for removal of organic dyes
Received
19th July 2019
, Accepted 22nd August 2019
First published on 3rd September 2019
Abstract
In this study, we report the synthesis of Ce-doped UiO-67 nanocrystals via one-step hydrothermal method and their potential use for waste water treatment to remove organic dyes. The as-prepared samples were characterized by using SEM, TEM, FT-IR, XRD, XPS and TG techniques and the results demonstrate the formation of the framework structure of the Ce-doped UiO-67. The adsorption study of the material shows that the Ce-doped UiO-67 nanoparticles preferentially adsorb the cationic dyes such as rhodamine B and malachite green rather than the anionic dyes such as methyl orange. Adsorption capacities are 754.4, 589.2 and 191.6 mg g−1 for rhodamine B, malachite green and methyl orange respectively. Based on its zeta potential and adsorption isotherm, it is understood that Ce doping increases its electrostatic interactions, and as a consequence, improves the adsorption capacity for cationic dyes. In addition, it is found that a pseudo-second-order kinetics and the Langmuir isothermal model were suitable for describing the adsorption behavior of cationic dyes onto the Ce-doped UiO-67.
1. Introduction
Aggravated by population, industrialization and urbanization, water pollution becomes a serious issue which needs to be resolved. Organic dyes are widely employed in the textile, paper, leather, and printing industries1 which cause water coloring upon their discharge. Just a very low concentration can damage the environment and poses serious threats to human health due to their toxicity, potential mutagenicity and carcinogenicity.2 Currently, many processes such as oxidation,3 adsorption,4 coagulation/flocculation,5 photolytic degradation,6 electrocatalytic degradation,7 biological treatment,8 reverse osmosis and membrane filtration9–12 have been attempted to remove those polluting organic dyes from waste water. Among these, adsorption is considered to be a favorable approach due to its feasibility, efficiency, no by-products and easy operation. However, finding a new adsorbent material with high performance and low cost, which is easy to make remains an actual challenge. MOFs which are organic–inorganic hybrid solids with regular channels or pore structures consisting of metal ions/clusters and organic linkers,13–16 have received great attention in various fields including adsorption and storage,17 drug delivery,18 heterogeneous catalysis,19 sensors,20 pollutant elimination,21 and energy storage and conversion.22 Among various MOFs structures, the zirconium-based MOFs of UiO series become very promising materials due to their excellent thermal, aqueous, and acid stabilities.23 Its exceptional biocompatibility, hydrothermal and thermal stability, none secondary pollution after its structure break-down24,25 and excellent chemical stability render the UiO-67 structure one of the most popular Zr-based frameworks for waste water treatment. Recently, metal ion doping of MOF-5 with Ni(II) ions exhibits enhancement in its hydrostability.26 Linnan Li et al.27 reported that a lanthanide functionalized MOF can be used as a turn-off luminescent sensory material for detection of Fe3+ in aqueous media. Jiao Cao et al.28 reported that Co-doped MOF expands its adsorptive ability and enhances its photocatalytic performance. Xuan Yang et al.29 reported that doping Ce(III) to MIL-96 increases its adsorption capacity for fluoride ions. However, most of the synthetic methods are cumbersome and tedious and all the reported MOF-drived materials are not scalable.30–33 Therefore, a simple and easy scalable preparation process is needed.
Herein, we report a one-step hydrothermal synthesis for doping metal ions into MOF structures. We chose Ce and UiO-67 because, to the best of our knowledge, doping of Ce to UiO-67 was rarely investigated. The so obtained Ce-doped UiO-67 was then characterized by using the SEM, TEM, FT-IR, XRD, XPS and TG techniques. For waste water treatment experiments, we chose two cationic dyes, rhodamine B (RhB) and malachite green (MG), and one anionic dye, methyl orange (MO) as model compounds. The effect of initial solution pH on the dye adsorption was also investigated.
2. Experimental
2.1. Sample preparation
Materials and chemicals: ZrCl4 (98%), biphenyl-4,4′-dicarboxylic acid (H2BPDC, 98%) and rhodmine B (RhB) were purchased from Shanghai Macklin Biochemical Co., Ltd. Ce(NO3)3·6H2O (98%) was purchased from Sinopharm Chemical Reagent Co, Ltd. Acetic acid (HAc, 99.5%) and N,N-dimethylformamide (DMF, 99.5%) were obtained from Beijing Chemical Works. All reagents and solvents were analytical grade and used directly without any further purification.
2.2. Synthesis of Ce-doped UiO-67
Typically, ZrCl4 (46.6 mg), Ce(NO3)3·6H2O (86.8 mg), H2BPDC (96.8 mg), and HAc (0.38 mL) were mixed and stirred for dissolution in 15 mL DMF at room temperature. The obtained mixture was transferred into a 25 mL Teflon-lined autoclave and heated to 120 °C and maintained at this temperature for 24 h. Subsequently the autoclave was taken out of the oven and cool down to room temperature. The solid product was isolated by centrifugation, washed with DMF three times and dried in vacuum at 100 °C overnight.
2.3. Characterization
The morphology of the samples was examined by using scanning electron microscopy (SEM, Hitachi S4800) with an accelerating voltage of 10 kV. The transmission electron microscopy (TEM) images were recorded on a JEOL JEM-2010EX transmission electron microscope with an accelerating voltage of 200 kV. The Fourier transform infrared (FT-IR) spectra were collected within the 400–4000 cm−1 spectral range on a Thermo Fisher Nicolet-6700 spectrometer. The X-ray powder diffraction (XRD) patterns from 5° to 80° were taken on a D8 Focus diffractometer (Bruker) with Cu target (40 kV, 40 mA). The X-ray photoelectron spectra (XPS) were obtained on an AXIS Ultra instrument from Kratos Analytical. The nitrogen adsorption–desorption isotherms were collected using a Micromeritics ASAP 2020 instrument. The specific surface areas were calculated using the Brunauer–Emmett–Teller (BET) method, and the pore size distributions were evaluated using the Barrett–Joyner–Halenda (BJH) model. The thermogravimetric analyses (TGA) were carried out using a TG/SDTQ600 instrument in atmosphere within temperature range of 0–900 K. The ultraviolet-visible (UV-vis) spectroscopy measurements were carried out with a UV-3600 UV-vis spectrophotometer (Shimadzu).
2.4. Adsorption experiments
Adsorption experiments of the two cationic dyes (RhB and MG) were conducted to evaluate the adsorption properties of the material and to understand the factors which influence the adsorption. All of the adsorption experiments were done at ambient temperature. The effect of the initial solution pH on the adsorption of RhB and MG by the material was examined by adjusting the solution pH with negligible amounts of 0.1 M HCl or 0.1 M NaOH in the range of 3–10. After adsorption, the adsorbent was separated by centrifugation at 10![[thin space (1/6-em)]](https://www.rsc.org/images/entities/char_2009.gif) 000 rpm for 5 min, and the supernatant was examined with a UV-3600 spectrophotometer at the maximum absorption wavelengths of the dyes. For adsorption kinetic studies, the experiments were performed using different adsorbent dosage (1200 mg L−1 for RhB and 800 mg L−1 for MG) at a constant temperature. The remaining concentrations of dyes in the solution were analyzed at different time intervals. The adsorption isotherms were obtained via altering the initial dye concentrations.
000 rpm for 5 min, and the supernatant was examined with a UV-3600 spectrophotometer at the maximum absorption wavelengths of the dyes. For adsorption kinetic studies, the experiments were performed using different adsorbent dosage (1200 mg L−1 for RhB and 800 mg L−1 for MG) at a constant temperature. The remaining concentrations of dyes in the solution were analyzed at different time intervals. The adsorption isotherms were obtained via altering the initial dye concentrations.
The adsorption capacity (Qe, mg g−1) was calculated according to the following eqn (1)
where
C0 and
Ce (mg L
−1) are the initial and equilibrium concentrations of the dye in the solution,
V (L) is the volume of solution, and
m (g) is the mass of adsorbent.
Qe (mg g
−1) is the adsorption capacity of the adsorbent.
3. Results and discussion
3.1. Synthesis and characterization
The synthesis was carried out as described in the experimental section. Fig. 1(a) and (c) show TEM and SEM pictures of the as-synthesized UiO-67. The UiO-67 crystals have regular octahedron shape with an average crystal size of 400 nm, while the Ce-doped UiO-67 crystals have the same morphology but smaller (average diameter, 200 nm, see Fig. 1(b) and (d)). The SEM images of the Ce-doped UiO-67 crystals were in line with the EDS mappings for C, Zr, and Ce (Fig. 2). The Ce and Zr mappings match the C mapping, indicating that Ce is well dispersed in the Ce-doped UiO-67 framework.
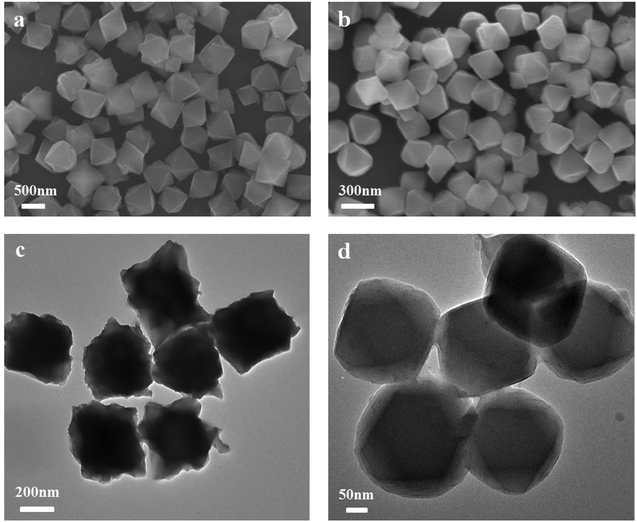 |
| | Fig. 1 SEM images of (a) UiO-67, (b) Ce-doped UiO-67; TEM images of (c) UiO-67, (d) Ce-doped UiO-67. | |
 |
| | Fig. 2 EDS elemental mapping of Ce-doped UiO-67. | |
The FT-IR spectra of the samples are presented in Fig. 3(a). For the Ce-doped UiO-67, the characteristic peaks at 668 and 768 cm−1 are the longitudinal and transverse vibrations of the Zr–O bonds,34,35 and the peaks at 1400–1600 cm−1 (labeled with purple stars) are corresponding to the stretching of O–C![[double bond, length as m-dash]](https://www.rsc.org/images/entities/char_e001.gif) O groups.36 The peak at 1658 cm−1 is wider compared to that of the UiO-67, indicating that the Ce ions in the material are coordinating with the carbonyl group (C
O groups.36 The peak at 1658 cm−1 is wider compared to that of the UiO-67, indicating that the Ce ions in the material are coordinating with the carbonyl group (C![[double bond, length as m-dash]](https://www.rsc.org/images/entities/char_e001.gif) O) of the BDC ligand. Additional a tiny bump in the peak at 1488 cm−1 is also seen due to the Ce–O stretching and Ce–O–C vibrations in the MOF,37,38 demonstrating that Ce substitution to Zr takes place in the Ce-doped UiO-67.
O) of the BDC ligand. Additional a tiny bump in the peak at 1488 cm−1 is also seen due to the Ce–O stretching and Ce–O–C vibrations in the MOF,37,38 demonstrating that Ce substitution to Zr takes place in the Ce-doped UiO-67.
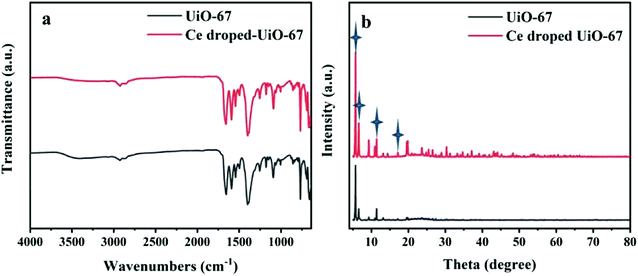 |
| | Fig. 3 (a) The FT-IR spectra of UiO-67 and Ce-doped UiO-67. (b) XRD patterns of UiO-67 and Ce-doped UiO-67. | |
The crystalline structures and phase composition of UiO-67 and Ce-doped UiO-67 were characterized by XRD. As shown in Fig. 3(b), the diffraction peaks at 5.6°, 6.5°, 11.2° and 17.2° are indexed to the typical crystalline structure of the Ce-doped UiO-67, which are similar to the characteristic peaks of the crystalline UiO-67.35,39 When Ce is incorporated into the UiO-67 structure by replacement of Zr, the position of the main diffraction peaks is not changed compared to that of the UiO-67, but the intensity of the diffraction peaks is increased due to the higher scattering power of Ce compared to Zr. The incorporation of Ce influences the crystal growth of the UiO-67 units to make the crystal size of Ce-doped UiO-67 smaller, as shown in the pictures above (Fig. 1(b) and (d)). The valence state of materials was characterized using X-ray photoelectron spectroscopy (XPS) (Fig. 4). From the survey spectrum in Fig. 4(a), the elements C, O and Zr exist in the Ce-doped UiO-67 spectrum with strong intensities while the intensity of the elements Ce is weak, indicating that its content is low on the surface. The content of cerium in the Ce-UiO-67 is 0.8% by the ICP analysis. Fig. 4(b) displayed the C 1s spectra of Ce-doped UiO-67, the most prominent peak at 284.7 eV is attributed to the sp2-hybridized carbon (C![[double bond, length as m-dash]](https://www.rsc.org/images/entities/char_e001.gif) C) on the benzene ring. The peak at 288.6 eV is assigned to HO–C
C) on the benzene ring. The peak at 288.6 eV is assigned to HO–C![[double bond, length as m-dash]](https://www.rsc.org/images/entities/char_e001.gif) O groups of the BPDC linkers. The O 1s spectra can be decomposed into three peaks in Fig. 4(c).40 The binding energy at 533 eV is assigned to the CO groups and the peaks at 533.6 eV correspond to the oxygen of H2O. The peaks at 531.7 eV are attributed to the CeO and ZrO.37 It is declared that cerium can be also a metallic center binding with H2BPDC. As shown in Fig. 4(d), the two peaks at 182.5 and 184. 9 eV in the Zr 3d spectrum can be ascribed to the Zr–O bonds.41 The Ce 3d XPS spectrum could not be devoted anymore, owing to the little amount which it can be seen from EDS results (Fig. 2). All of these results further confirm that the Ce-doped UiO-67 was prepared successfully. The N2 adsorption–desorption isotherms and pore size distribution are shown in Fig. 5(a) and the textural parameters are listed in Table 1. The adsorption–desorption isotherms exhibit type-I isotherm implying that Ce-doped UiO-67 is a typical microporous material. Ce-doped UiO-67 shows a BET specific surface area of 1795 m2 g−1, which exceeds that of pure UiO-67 nanocrystals (1653 m2 g−1). The average pore width of the channels of the Ce-doped UiO-67 (2.047 nm) is similar to that of UiO-67 (2.053 nm), while the pore volume of the Ce-doped UiO-67 (0.878 cm3 g−1) is higher than that of the UiO-67 (0.793 cm3 g−1), indicating that cerium doping resulted in increased pore volume. The Ce-doped UiO-67 is expected to have better adsorption capacity compared to its corresponding parts. Fig. 5(b) gives TGA plots of weight loss of the UiO-67 and Ce-doped UiO-67 in air atmosphere. Two main weight loss steps are observed in the temperature range 0–900 °C. The first weight loss in the temperature range of 25–200 °C is due to the loss of the guest molecules incorporated during the synthesis. The second weight loss in the temperature range of 400–600 °C is attributed to the decomposition of the framework. The weight losses for both materials occur at the same temperature, indicating that the thermal stability of the framework is not affected by doping. For the first step, this difference was attributed to the as-prepared Ce-doped UiO-67 having a smaller pore size and volume than UiO-67, which resulted in less guest solvent molecules in the former framework. For the second step, the structure is destroyed and left behind is ZrO2 for UiO-67 and ZrO2/CeO2 for the Ce-doped UiO-67. The remaining weight is 17 wt% and 26 wt%, respectively. Thus, the TGA results further confirm that element cerium is incorporated in the framework with no much influence on its framework thermal stability.42–44
O groups of the BPDC linkers. The O 1s spectra can be decomposed into three peaks in Fig. 4(c).40 The binding energy at 533 eV is assigned to the CO groups and the peaks at 533.6 eV correspond to the oxygen of H2O. The peaks at 531.7 eV are attributed to the CeO and ZrO.37 It is declared that cerium can be also a metallic center binding with H2BPDC. As shown in Fig. 4(d), the two peaks at 182.5 and 184. 9 eV in the Zr 3d spectrum can be ascribed to the Zr–O bonds.41 The Ce 3d XPS spectrum could not be devoted anymore, owing to the little amount which it can be seen from EDS results (Fig. 2). All of these results further confirm that the Ce-doped UiO-67 was prepared successfully. The N2 adsorption–desorption isotherms and pore size distribution are shown in Fig. 5(a) and the textural parameters are listed in Table 1. The adsorption–desorption isotherms exhibit type-I isotherm implying that Ce-doped UiO-67 is a typical microporous material. Ce-doped UiO-67 shows a BET specific surface area of 1795 m2 g−1, which exceeds that of pure UiO-67 nanocrystals (1653 m2 g−1). The average pore width of the channels of the Ce-doped UiO-67 (2.047 nm) is similar to that of UiO-67 (2.053 nm), while the pore volume of the Ce-doped UiO-67 (0.878 cm3 g−1) is higher than that of the UiO-67 (0.793 cm3 g−1), indicating that cerium doping resulted in increased pore volume. The Ce-doped UiO-67 is expected to have better adsorption capacity compared to its corresponding parts. Fig. 5(b) gives TGA plots of weight loss of the UiO-67 and Ce-doped UiO-67 in air atmosphere. Two main weight loss steps are observed in the temperature range 0–900 °C. The first weight loss in the temperature range of 25–200 °C is due to the loss of the guest molecules incorporated during the synthesis. The second weight loss in the temperature range of 400–600 °C is attributed to the decomposition of the framework. The weight losses for both materials occur at the same temperature, indicating that the thermal stability of the framework is not affected by doping. For the first step, this difference was attributed to the as-prepared Ce-doped UiO-67 having a smaller pore size and volume than UiO-67, which resulted in less guest solvent molecules in the former framework. For the second step, the structure is destroyed and left behind is ZrO2 for UiO-67 and ZrO2/CeO2 for the Ce-doped UiO-67. The remaining weight is 17 wt% and 26 wt%, respectively. Thus, the TGA results further confirm that element cerium is incorporated in the framework with no much influence on its framework thermal stability.42–44
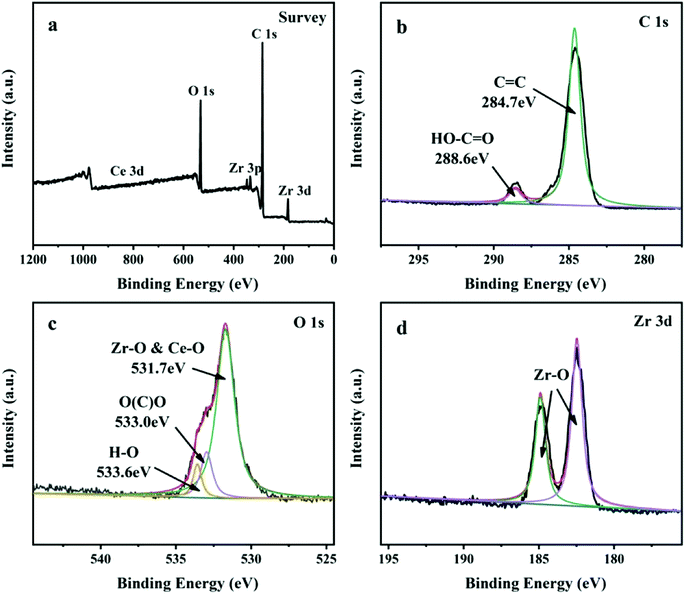 |
| | Fig. 4 XPS survey spectrum of (a) Ce-doped UiO-67, high resolution XPS spectra of (b) C 1s (c) O 1s and (d) Zr 3d obtained from C Ce-doped UiO-67. | |
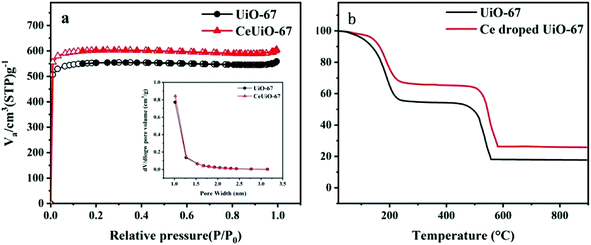 |
| | Fig. 5 (a) N2 adsorption isotherms of UiO-67 and Ce-doped UiO-67. The inset shows the BJH pore size distribution curve. (b) TGA of UiO-67 and Ce-doped UiO-67 under air atmosphere. | |
Table 1 Surface area and porosity characteristics of the samples
| Sample |
SBET (m2 g−1) |
dpore (nm) |
Vpore (cm3 g−1) |
| UiO-67 |
1653 |
2.054 |
0.793 |
| Ce-doped UiO-67 |
1795 |
2.047 |
0.878 |
3.2. Dye adsorption performance
3.2.1. Adsorption kinetics. During the adsorption process, the contact time is a crucial factor, which influences the adsorption capacities of the adsorbents. As shown in (Fig. 6(b)), the adsorption of MG on the Ce-doped UiO-67 reached equilibrium within 24 min. Similar adsorption kinetics was observed for that of RhB (Fig. 6(a)). To better understand the absorption mechanism, pseudo-first-order and pseudo-second-order kinetic models were tried to describe the adsorption data of RhB and MG. The commonly known pseudo-first-order model (eqn (2)) and pseudo-second-order model (eqn (3)) are expressed in a linear form as follows:| |
ln(Qe − Qt) = ln![[thin space (1/6-em)]](https://www.rsc.org/images/entities/char_2009.gif) Qe − K1t Qe − K1t
| (2) |
| | |
t/Qt = 1/(K2Qe2) + t/Qe
| (3) |
where Qe and Qt (mg g−1) are the capacity of dye adsorbed at equilibrium and at time t; K1 (min−1) and K2 (g m−1 min−1) denote kinetic velocity constants of the pseudo-first-order and pseudo-second-order, respectively.
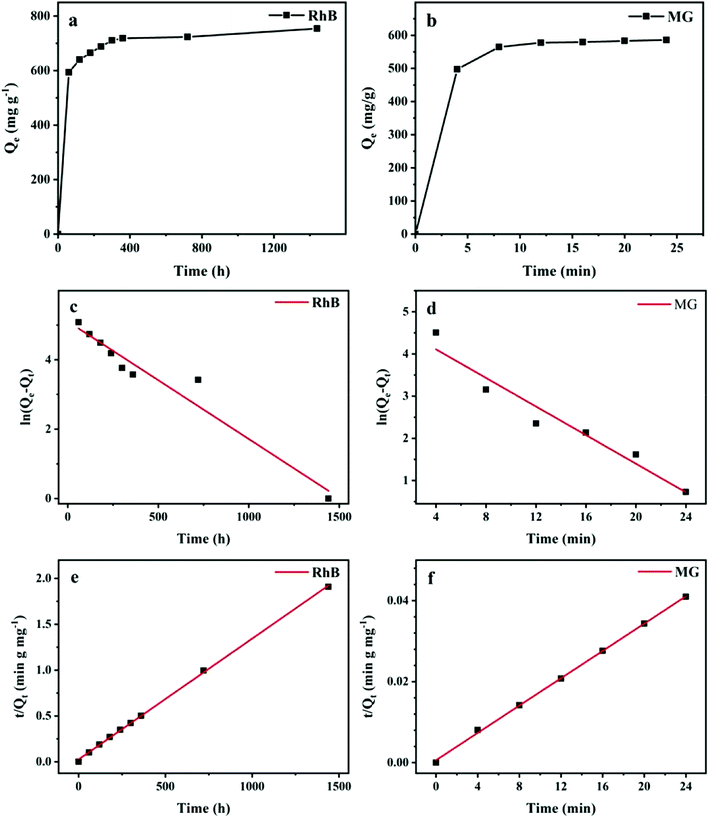 |
| | Fig. 6 Adsorption kinetics of RhB and MG onto Ce-doped UiO-67 (a and b) contact time curve plots; (c and d) pseudo-first-order and; (e and f) pseudo-second-order kinetic models (adsorption conditions: m = 5 mg; V = 5 mL). | |
The fitting using the two models is given in Fig. 6 and the relevant parameters are listed in Table 2. The correlation coefficients R2 of pseudo-second-order kinetic model were all higher than 0.999 and obviously higher than the pseudo-first-order kinetic model for RhB and MG, implying the pseudo-second-order model is suitable to describe the adsorption behavior of Ce-doped UiO-67. The calculated Qe value with the pseudo-second-order kinetic model was in accordance to the experimental data.
Table 2 Kinetic parameters and correlation coefficients of dyes adsorption onto Ce-doped UiO-67
| Organic dyes |
Qexp (mg g−1) |
Pseudo-first-order model |
Pseudo-second-order model |
| Qe (mg g−1) |
K1 (min−1) |
R2 |
Qe (mg g−1) |
K2 (min−1) |
R2 |
| RhB |
754.4 |
164.6 |
−0.00339 |
0.9423 |
747.6 |
0.00132 |
0.9994 |
| MG |
589.2 |
119.9 |
−0.16946 |
0.9345 |
583.1 |
0.00169 |
0.9992 |
3.2.2. Adsorption isotherms. To further understand how RhB and MG are adsorbed onto Ce-doped UiO-67, the adsorption isotherms of RhB and MG with various initial concentrations were measured. As seen in Fig. 7, the adsorption of both dyes on the Ce-doped UiO-67 initially increases linearly with the increase of initial dye concentration and eventually reaches a plateau.
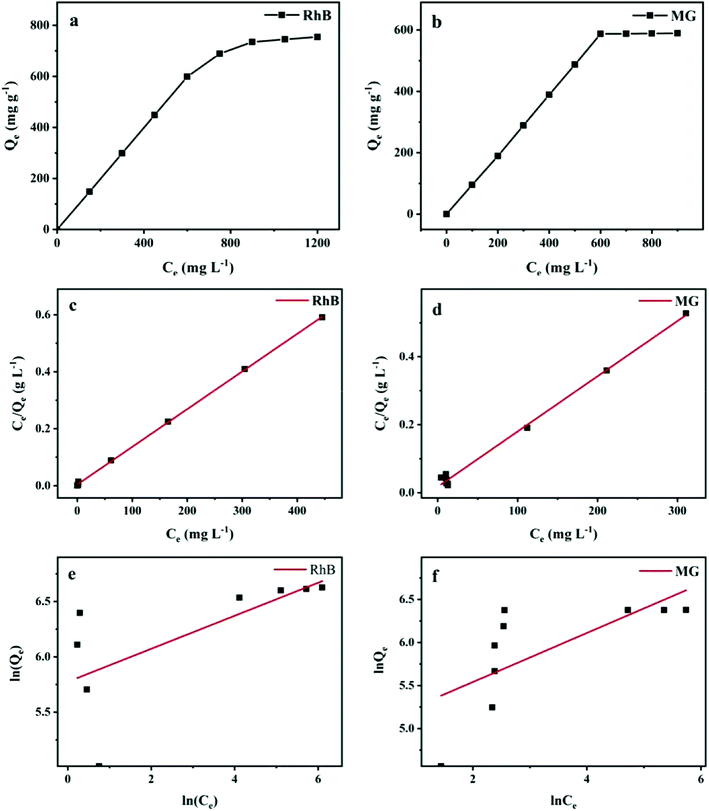 |
| | Fig. 7 (a and b) Adsorption isotherms of RhB and MG adsorbed by Ce-doped UiO-67; (c and d) Langmuir isotherm plot; (e and f) Freundlich isotherm plot. | |
Moreover, the Ce-doped UiO-67 exhibited adsorption capacities of RhB (754.4 mg g−1) and MG (589.2 mg g−1) respectively, being significantly higher than those previously reported for UiO-67, RhB (41.3 mg g−1) and MG (357.3 mg g−1)35 or other porous materials (Table 3). Compared to the pristine UiO-67, Ce-doped UiO-67 featured a significantly decreased positive surface, which resulted in decreased electrostatic repulsion between the adsorbent and cationic dye molecules, facilitating their adsorption.
Table 3 Comparison of cationic dyes adsorption onto different adsorbents
| Adsorbents |
Adsorption capacity to cationic dyes (mg g−1) |
Ref. |
| POM@UiO-66 |
Rhodamine B |
222.6 |
Malachite green |
190.6 |
42 |
| UiO-66-NH2 |
Methylene blue |
96.45 |
— |
— |
45 |
| N-doping UiO-66 |
Rhodamine B |
384.1 |
— |
— |
46 |
| Zn-MOF |
Rhodamine B |
2.977 |
Methylene blue |
6.394 |
47 |
| PCN-222 |
Methylene blue |
589 |
— |
— |
48 |
| Sulfonate lignin-based hydrogels (SLG) |
Methylene blue |
495 |
— |
— |
49 |
| Cationic-modified silica gel (CM-SG) |
Reactive black 5 |
190.0 |
Reactive red 239 |
178.2 |
50 |
| CuO/MCM-41 nano composite |
Crystal violet |
52.9 |
Methylene blue |
87.8 |
51 |
| Ce-doped UiO-67 |
Rhodamine B |
754.4 |
Malachite green |
589.2 |
Current work |
Subsequently, the equilibrium adsorption data were analyzed by two kinetic models, Langmuir and Freundlich isothermal models. The Langmuir adsorption isotherm represents monolayer adsorption onto a finite number of homogeneous sites, and the Freundlich adsorption isotherm describes adsorption of adsorbates onto a heterogeneous surface with different functional groups or adsorbent–adsorbate interactions.
The Langmuir isotherm is expressed as follows:
| | |
Ce/Qe = Ce/Qm + 1/(KLQm)
| (4) |
where
Qe (mg g
−1) and
Ce (mg L
−1) are the loading of dye and equilibrium adsorption capacity;
Qm (mg g
−1) is the maximum adsorption capacity;
KL (L mg
−1) is the Langmuir constant.
Another important parameter RL, the separation factor or equilibrium parameters, has been used to further estimate whether the Langmuir isothermal model fits the adsorption system. This factor can be calculated from the following equation:
where
C0 (mg L
−1) is the initial concentration of dye. The value of
RL can indicate that the isotherm type is irreversible (
RL = 0), favorable (0 <
RL < 1), or unfavorable (
RL > 1).
The Freundlich isothermal is expressed as follows:
where
KF and
n are the Freundlich constants which involve the effect of initial dye concentration on adsorption.
From the fitting curves of Langmuir (Fig. 7(c)) and Freundlich kinetic models (Fig. 7(d)), the corresponding adsorption parameters are obtained (Table 4). The correlation coefficient R2 of the Langmuir equation is close to unity and much larger than Freundlich model for both RhB and MG, indicating that the adsorption follows the Langmuir model. Moreover, the maximum adsorption capacities of RhB and MG calculated with the Langmuir model was considerably closer to experimental data. The RL values of RhB and MG were great than 0 and far below 1, suggesting that adsorption for the dyes are favorable.
Table 4 Adsorption parameters of dyes in the Ce-doped UiO-67
| Organic dyes |
Qexp (mg g−1) |
Langmuir isothermal model |
Freundlich isothermal model |
| Qm (mg g−1) |
KL (L mg−1) |
R2 |
RL |
KF |
n |
R2 |
| RhB |
754.4 |
757.6 |
0.3077 |
0.9996 |
0.0212 |
322.0 |
6.7024 |
0.3791 |
| MG |
589.2 |
617.3 |
0.0919 |
0.9941 |
0.0981 |
144.2 |
3.5082 |
0.4071 |
3.2.3. Effect of initial pH. The solution pH is a factor for the adsorption process and influences the adsorption capacities of the adsorbents. Hence, the adsorption performance of MG onto Ce-doped UiO-67 was studied in the pH range of 3–10, and the results were depicted in Fig. 8. From the zeta potential measurements of Ce-doped UiO-67 (Fig. 8(b)), a zpc (point of zero charge) was observed at a pH of 5.05, and the negative charge on the surface of the Ce-doped UiO-67 increases with rising pH of the MG solution in the pH range of 3.2–7. Since MG is a cationic dye, increasing the pH of the solution from 3.2 to 5, favoured the electrostatic interaction between dye molecules and the adsorbent and thereby resulted into increased adsorption capacity of the material. Whereas, when the solution pH value above 3.5, discoloration or precipitation will easily occur as shown in Fig. 9, due to MG is a triarylmethane conjugated basic dye and sensitive to pH. Therefore, the optimal pH value for adsorption of MG occurs at 5.
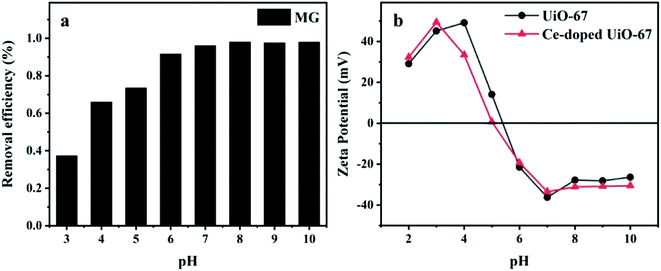 |
| | Fig. 8 (a) Effect of initial pH on adsorption capability of RhB. (b) Zeta potentials of UiO-67 and Ce-doped UiO-67 at various pH values. | |
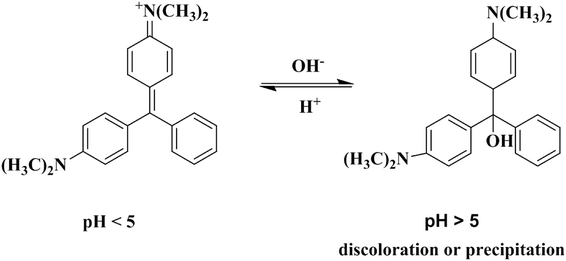 |
| | Fig. 9 MG reaction equation. | |
3.2.4. Selective adsorption ability. Selective adsorption ability is a crucial factor for application. We, therefore, used two cationic dyes (RhB and MG) and one anionic dye MO to see the result. The adsorption capacity for anionic dye MO (191.6 mg g−1) is lower than those for RhB and MG. The results indicate that Ce doping changes the electrical property of UiO-67. Ce substitution to Zr takes place in the Ce-doped UiO-67, moreover the valence of Zr is +4 and the valence of Ce is +3, thus Ce doping increases the negative charge on the surface of the material. And zeta potential measurements (Fig. 8(b)) reveal that the positive charge on the surface of the Ce-doped UiO-67 is much smaller than that of the UiO-67 in the pH range of 3.2–5.8. The electrostatic interactions between the adsorbent and the dye molecules determine the dye adsorption. The negative charge on the surface of Ce-doped UiO-67 structure within the pH range reduces the interactions with anionic dyes.
3.2.5. Reusability of the Ce-doped UiO-67. The reusability of an adsorbent is an important aspect considering applications. Thus, the reusability of Ce-doped UiO-67 was conducted by running repetitive adsorption cycles. The dye saturated Ce-doped UiO-67 was added to ethylene glycol and ultrasonically treated. The separated out solid was washed with ethanol several times followed by drying under vacuum. Next cycle of adsorption was repeated. Ce-doped UiO-67 exhibits excellent reusability where both dyes removal reaches 75% after four time adsorption (Fig. 10), indicating good regeneration capacity and reusability.
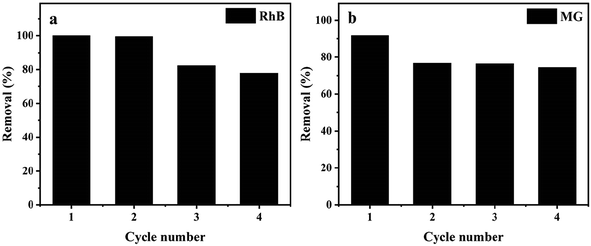 |
| | Fig. 10 (a) Recyclability of Ce-doped UiO-67 for the reduction of RhB and (b) recyclability of Ce-doped UiO-67 for the reduction of MG. | |
4. Conclusions
In summary, we synthesized Ce-doped UiO-67 nanoparticles via a one-pot method. Ce doping increases electrostatic attraction between the adsorbent and the cationic dye molecules. As a result, the Ce-doped UiO-67 exhibited adsorption capacities of RhB (754.4 mg g−1) and MG (589.2 mg g−1) respectively, being significantly higher than those previously reported for UiO-67, RhB (41.3 mg g−1) and MG (357.3 mg g−1). Adsorption kinetics studies show that the adsorption process follows the pseudo-second-order kinetic model. The experiment data are well described by the Langmuir model. The Ce-doped UiO-67 after chemisorption can be regenerated and still has comparatively high adsorption capacity after four time adsorption–desorption cycles. Its adsorption efficiency and simple synthesis process warrant the potential use of the Ce-doped UiO-67 material as an adsorbent for wastewater treatment.
Conflicts of interest
There are no conflicts to declare.
References
- M. T. Yagub, T. K. Sen, S. Afroze and H. M. Ang, Adv. Colloid Interface Sci., 2014, 209, 172–184 CrossRef CAS PubMed.
- A. K. Verma, R. R. Dash and P. Bhunia, J. Environ. Manage., 2012, 93, 154–168 CrossRef CAS PubMed.
- G. Boczkaj and A. Fernandes, Chem. Eng. J., 2017, 320, 608–633 CrossRef CAS.
- Z. Shi, L. Li, Y. Xiao, Y. Wang, K. Sun, H. Wang and L. Liu, RSC Adv., 2017, 7, 30904–30910 RSC.
- H. Wei, B. Gao, J. Ren, A. Li and H. Yang, Water Res., 2018, 143, 608–631 CrossRef CAS PubMed.
- J. Zhang, Z. Xiong and X. S. Zhao, J. Mater. Chem., 2011, 21, 3634 RSC.
- X. J. Li, H. J. Li, M. J. Li, C. P. Li, D. Z. Sun, Y. J. Lei and B. H. Yang, Carbon, 2018, 129, 543–551 CrossRef CAS.
- I. Oller, S. Malato and J. A. Sanchez-Perez, Sci. Total Environ., 2011, 409, 4141–4166 CrossRef CAS PubMed.
- Y. Oh, D. L. Armstrong, C. Finnerty, S. X. Zheng, M. Hu, A. Torrents and B. X. Mi, J. Membr. Sci., 2017, 541, 235–243 CrossRef CAS.
- S. Shanmuganathan, P. Loganathan, C. Kazner, M. A. H. Johir and S. Vigneswaran, Desalination, 2017, 401, 134–141 CrossRef CAS.
- Y. Q. Zhan, X. Y. Wan, S. J. He, Q. B. Yang and Y. He, Chem. Eng. J., 2018, 333, 132–145 CrossRef CAS.
- J. Wang, Y. Han, H. Xu and Z.-L. Xu, Appl. Organomet. Chem., 2018, 32, e4097 CrossRef.
- X. Zhao, Y. Wang, D. S. Li, X. Bu and P. Feng, Adv. Mater., 2018, 30, e1705189 CrossRef PubMed.
- N. Ko, J. Hong, S. Sung, K. E. Cordova, H. J. Park, J. K. Yang and J. Kim, Dalton Trans., 2015, 44, 2047–2051 RSC.
- J. Duan, S. Chen and C. Zhao, Nat. Commun., 2017, 8, 15341 CrossRef CAS PubMed.
- F.-h. Wei, D. Chen, Z. Liang, S.-q. Zhao and Y. Luo, RSC Adv., 2017, 7, 46520–46528 RSC.
- B. An, J. Zhang, K. Cheng, P. Ji, C. Wang and W. Lin, J. Am. Chem. Soc., 2017, 139, 3834–3840 CrossRef CAS PubMed.
- I. Abánades Lázaro and R. S. Forgan, Coord. Chem. Rev., 2019, 380, 230–259 CrossRef.
- Y. Li, Y. Su, J. Xu, Z.-l. Xu and H. Xu, Bull. Chem. Soc. Jpn., 2017, 90, 1152–1156 CrossRef CAS.
- A. H. Assen, O. Yassine, O. Shekhah, M. Eddaoudi and K. N. Salama, ACS Sens., 2017, 2, 1294–1301 CrossRef CAS PubMed.
- R. Abazari, A. R. Mahjoub and J. Shariati, J. Hazard. Mater., 2019, 366, 439–451 CrossRef CAS PubMed.
- R. Balderas-Xicohtencatl, M. Schlichtenmayer and M. Hirscher, Energy Technol., 2018, 6, 578–582 CrossRef CAS.
- M. J. Katz, Z. J. Brown, Y. J. Colon, P. W. Siu, K. A. Scheidt, R. Q. Snurr, J. T. Hupp and O. K. Farha, Chem. Commun., 2013, 49, 9449–9451 RSC.
- H. Xu, X. Luo, J. Wang, Y. Su, X. Zhao and Y. Li, ACS Appl. Mater. Interfaces, 2019, 11, 20291–20297 CrossRef CAS PubMed.
- H. Xu, Y. Li, X. Luo, Z. Xu and J. Ge, Chem. Commun., 2017, 53, 7953–7956 RSC.
- J. M. Yang, Q. Liu and W. Y. Sun, Microporous Mesoporous Mater., 2014, 190, 26–31 CrossRef CAS.
- L. N. Li, S. S. Shen, W. P. Ai, S. Y. Song, Y. Bai and H. W. Liu, Sens. Actuators, B, 2018, 267, 542–548 CrossRef CAS.
- J. Cao, Z.-h. Yang, W.-p. Xiong, Y.-y. Zhou, Y.-r. Peng, X. Li, C.-y. Zhou, R. Xu and Y.-r. Zhang, Chem. Eng. J., 2018, 353, 126–137 CrossRef CAS.
- X. Yang, S. Deng, F. Peng and T. Luo, Dalton Trans., 2017, 46, 1996–2006 RSC.
- M. Wu, X. Hu, C. Li, J. Li, H. Zhou, X. Zhang and R. Liu, Int. J. Hydrogen Energy, 2018, 43, 14701–14709 CrossRef CAS.
- M. R. D. Khaki, M. S. Shafeeyan, A. A. A. Raman and W. Daud, J. Environ. Manage., 2017, 198, 78–94 CrossRef CAS PubMed.
- L. B. Jiang, X. Z. Yuan, Y. Pan, J. Liang, G. M. Zeng, Z. B. Wu and H. Wang, Appl. Catal., B, 2017, 217, 388–406 CrossRef CAS.
- E. Žunkovič, M. Mazaj, G. Mali, M. Rangus, T. Devic, C. Serre and N. Z. Logar, J. Solid State Chem., 2015, 225, 209–215 CrossRef.
- Q. F. Yang, J. Wang, X. Y. Chen, W. X. Yang, H. N. Pei, N. Hu, Z. H. Li, Y. R. Suo, T. Li and J. L. Wang, J. Mater. Chem. A, 2018, 6, 2184–2192 RSC.
- Q. Yang, Y. Wang, J. Wang, F. Liu, N. Hu, H. Pei, W. Yang, Z. Li, Y. Suo and J. Wang, Food Chem., 2018, 254, 241–248 CrossRef CAS PubMed.
- H. Duo, Y. Wang, L. Wang, X. Lu and X. Liang, J. Sep. Sci., 2018, 41, 4149–4158 CrossRef CAS PubMed.
- Z. W. Yang, X. Q. Xu, X. X. Liang, C. Lei, L. H. Gao, R. X. Hao, D. D. Lu and Z. Q. Lei, Appl. Surf. Sci., 2017, 420, 276–285 CrossRef CAS.
- A. M. Ebrahim and T. J. Bandosz, ACS Appl. Mater. Interfaces, 2013, 5, 10565–10573 CrossRef CAS PubMed.
- X. Zhu, B. Li, J. Yang, Y. Li, W. Zhao, J. Shi and J. Gu, ACS Appl. Mater. Interfaces, 2015, 7, 223–231 CrossRef CAS PubMed.
- S. C. Liu, J. Xu, E. G. Dai, J. J. Qiu and Y. Liu, Microporous Mesoporous Mater., 2018, 264, 133–138 CrossRef CAS.
- Q. Liang, S. Cui, C. Liu, S. Xu, C. Yao and Z. Li, J. Colloid Interface Sci., 2018, 524, 379–387 CrossRef CAS PubMed.
- L. Zeng, L. Xiao, Y. Long and X. Shi, J. Colloid Interface Sci., 2018, 516, 274–283 CrossRef CAS PubMed.
- J. M. Yang, J. Colloid Interface Sci., 2017, 505, 178–185 CrossRef CAS PubMed.
- H. Ali-Moussa, R. Navarro Amador, J. Martinez, F. Lamaty, M. Carboni and X. Bantreil, Mater. Lett., 2017, 197, 171–174 CrossRef CAS.
- Q. Chen, Q. Q. He, M. M. Lv, Y. L. Xu, H. B. Yang, X. T. Liu and F. Y. Wei, Appl. Surf. Sci., 2015, 327, 77–85 CrossRef CAS.
- P. Hu, Z. Zhao, X. Sun, Y. Muhammad, J. Li, S. Chen, C. Pang, T. Liao and Z. Zhao, Chem. Eng. J., 2019, 356, 329–340 CrossRef CAS.
- J. Zhang, F. Li and Q. Sun, Appl. Surf. Sci., 2018, 440, 1219–1226 CrossRef CAS.
- H. Li, X. Cao, C. Zhang, Q. Yu, Z. Zhao, X. Niu, X. Sun, Y. Liu, L. Ma and Z. Li, RSC Adv., 2017, 7, 16273–16281 RSC.
- J. Li, H. Li, Z. Yuan, J. Fang, L. Chang, H. Zhang and C. Li, Int. J. Biol. Macromol., 2019, 135, 1171–1181 CrossRef CAS PubMed.
- Y. Zhang, K. Xia, X. Liu, Z. Chen, H. Du and X. Zhang, J. Taiwan Inst. Chem. Eng., 2019, 102, 1–8 CrossRef CAS.
- Z. Liang, Z. Zhao, T. Sun, W. Shi and F. Cui, J. Colloid Interface Sci., 2017, 485, 192–200 CrossRef CAS PubMed.
|
| This journal is © The Royal Society of Chemistry 2019 |
Click here to see how this site uses Cookies. View our privacy policy here.  Open Access Article
 b and
Lang Zhao
 *a
*a
![[thin space (1/6-em)]](https://www.rsc.org/images/entities/char_2009.gif) 000 rpm for 5 min, and the supernatant was examined with a UV-3600 spectrophotometer at the maximum absorption wavelengths of the dyes. For adsorption kinetic studies, the experiments were performed using different adsorbent dosage (1200 mg L−1 for RhB and 800 mg L−1 for MG) at a constant temperature. The remaining concentrations of dyes in the solution were analyzed at different time intervals. The adsorption isotherms were obtained via altering the initial dye concentrations.
000 rpm for 5 min, and the supernatant was examined with a UV-3600 spectrophotometer at the maximum absorption wavelengths of the dyes. For adsorption kinetic studies, the experiments were performed using different adsorbent dosage (1200 mg L−1 for RhB and 800 mg L−1 for MG) at a constant temperature. The remaining concentrations of dyes in the solution were analyzed at different time intervals. The adsorption isotherms were obtained via altering the initial dye concentrations.

![[double bond, length as m-dash]](https://www.rsc.org/images/entities/char_e001.gif) O groups.36 The peak at 1658 cm−1 is wider compared to that of the UiO-67, indicating that the Ce ions in the material are coordinating with the carbonyl group (C
O groups.36 The peak at 1658 cm−1 is wider compared to that of the UiO-67, indicating that the Ce ions in the material are coordinating with the carbonyl group (C![[double bond, length as m-dash]](https://www.rsc.org/images/entities/char_e001.gif) O) of the BDC ligand. Additional a tiny bump in the peak at 1488 cm−1 is also seen due to the Ce–O stretching and Ce–O–C vibrations in the MOF,37,38 demonstrating that Ce substitution to Zr takes place in the Ce-doped UiO-67.
O) of the BDC ligand. Additional a tiny bump in the peak at 1488 cm−1 is also seen due to the Ce–O stretching and Ce–O–C vibrations in the MOF,37,38 demonstrating that Ce substitution to Zr takes place in the Ce-doped UiO-67.
![[double bond, length as m-dash]](https://www.rsc.org/images/entities/char_e001.gif) C) on the benzene ring. The peak at 288.6 eV is assigned to HO–C
C) on the benzene ring. The peak at 288.6 eV is assigned to HO–C![[double bond, length as m-dash]](https://www.rsc.org/images/entities/char_e001.gif) O groups of the BPDC linkers. The O 1s spectra can be decomposed into three peaks in Fig. 4(c).40 The binding energy at 533 eV is assigned to the CO groups and the peaks at 533.6 eV correspond to the oxygen of H2O. The peaks at 531.7 eV are attributed to the CeO and ZrO.37 It is declared that cerium can be also a metallic center binding with H2BPDC. As shown in Fig. 4(d), the two peaks at 182.5 and 184. 9 eV in the Zr 3d spectrum can be ascribed to the Zr–O bonds.41 The Ce 3d XPS spectrum could not be devoted anymore, owing to the little amount which it can be seen from EDS results (Fig. 2). All of these results further confirm that the Ce-doped UiO-67 was prepared successfully. The N2 adsorption–desorption isotherms and pore size distribution are shown in Fig. 5(a) and the textural parameters are listed in Table 1. The adsorption–desorption isotherms exhibit type-I isotherm implying that Ce-doped UiO-67 is a typical microporous material. Ce-doped UiO-67 shows a BET specific surface area of 1795 m2 g−1, which exceeds that of pure UiO-67 nanocrystals (1653 m2 g−1). The average pore width of the channels of the Ce-doped UiO-67 (2.047 nm) is similar to that of UiO-67 (2.053 nm), while the pore volume of the Ce-doped UiO-67 (0.878 cm3 g−1) is higher than that of the UiO-67 (0.793 cm3 g−1), indicating that cerium doping resulted in increased pore volume. The Ce-doped UiO-67 is expected to have better adsorption capacity compared to its corresponding parts. Fig. 5(b) gives TGA plots of weight loss of the UiO-67 and Ce-doped UiO-67 in air atmosphere. Two main weight loss steps are observed in the temperature range 0–900 °C. The first weight loss in the temperature range of 25–200 °C is due to the loss of the guest molecules incorporated during the synthesis. The second weight loss in the temperature range of 400–600 °C is attributed to the decomposition of the framework. The weight losses for both materials occur at the same temperature, indicating that the thermal stability of the framework is not affected by doping. For the first step, this difference was attributed to the as-prepared Ce-doped UiO-67 having a smaller pore size and volume than UiO-67, which resulted in less guest solvent molecules in the former framework. For the second step, the structure is destroyed and left behind is ZrO2 for UiO-67 and ZrO2/CeO2 for the Ce-doped UiO-67. The remaining weight is 17 wt% and 26 wt%, respectively. Thus, the TGA results further confirm that element cerium is incorporated in the framework with no much influence on its framework thermal stability.42–44
O groups of the BPDC linkers. The O 1s spectra can be decomposed into three peaks in Fig. 4(c).40 The binding energy at 533 eV is assigned to the CO groups and the peaks at 533.6 eV correspond to the oxygen of H2O. The peaks at 531.7 eV are attributed to the CeO and ZrO.37 It is declared that cerium can be also a metallic center binding with H2BPDC. As shown in Fig. 4(d), the two peaks at 182.5 and 184. 9 eV in the Zr 3d spectrum can be ascribed to the Zr–O bonds.41 The Ce 3d XPS spectrum could not be devoted anymore, owing to the little amount which it can be seen from EDS results (Fig. 2). All of these results further confirm that the Ce-doped UiO-67 was prepared successfully. The N2 adsorption–desorption isotherms and pore size distribution are shown in Fig. 5(a) and the textural parameters are listed in Table 1. The adsorption–desorption isotherms exhibit type-I isotherm implying that Ce-doped UiO-67 is a typical microporous material. Ce-doped UiO-67 shows a BET specific surface area of 1795 m2 g−1, which exceeds that of pure UiO-67 nanocrystals (1653 m2 g−1). The average pore width of the channels of the Ce-doped UiO-67 (2.047 nm) is similar to that of UiO-67 (2.053 nm), while the pore volume of the Ce-doped UiO-67 (0.878 cm3 g−1) is higher than that of the UiO-67 (0.793 cm3 g−1), indicating that cerium doping resulted in increased pore volume. The Ce-doped UiO-67 is expected to have better adsorption capacity compared to its corresponding parts. Fig. 5(b) gives TGA plots of weight loss of the UiO-67 and Ce-doped UiO-67 in air atmosphere. Two main weight loss steps are observed in the temperature range 0–900 °C. The first weight loss in the temperature range of 25–200 °C is due to the loss of the guest molecules incorporated during the synthesis. The second weight loss in the temperature range of 400–600 °C is attributed to the decomposition of the framework. The weight losses for both materials occur at the same temperature, indicating that the thermal stability of the framework is not affected by doping. For the first step, this difference was attributed to the as-prepared Ce-doped UiO-67 having a smaller pore size and volume than UiO-67, which resulted in less guest solvent molecules in the former framework. For the second step, the structure is destroyed and left behind is ZrO2 for UiO-67 and ZrO2/CeO2 for the Ce-doped UiO-67. The remaining weight is 17 wt% and 26 wt%, respectively. Thus, the TGA results further confirm that element cerium is incorporated in the framework with no much influence on its framework thermal stability.42–44

![[thin space (1/6-em)]](https://www.rsc.org/images/entities/char_2009.gif) Qe − K1t
Qe − K1t

![[thin space (1/6-em)]](https://www.rsc.org/images/entities/char_2009.gif) Qe = ln
Qe = ln![[thin space (1/6-em)]](https://www.rsc.org/images/entities/char_2009.gif) Ce/n + ln
Ce/n + ln![[thin space (1/6-em)]](https://www.rsc.org/images/entities/char_2009.gif) KF
KF


