DOI:
10.1039/C9RA05600A
(Paper)
RSC Adv., 2019,
9, 33238-33245
Visible-light-driven CQDs@MIL-125(Ti) nanocomposite photocatalyst with enhanced photocatalytic activity for the degradation of tetracycline
Received
20th July 2019
, Accepted 26th September 2019
First published on 16th October 2019
Abstract
In the present study, a novel photocatalyst, CQDs@MIL-125(Ti) (CQDs = carbon quantum dots), was prepared via a solvothermal procedure. The photocatalytic properties were tested by the degradation of tetracycline (TC) with a 250 W Xe lamp (λ > 420 nm). Compared with pure MIL-125(Ti), the 10 wt% CQDs@MIL-125(Ti) photocatalyst can significantly improve the degradation process of TC, and the degradation efficiency can reach 90% within 4 h. The enhancement in the photocatalytic performance is due to the CQDs, which can promote the absorption of visible light and also efficiently accelerate the separation of photogenerated electron–hole pairs. We have also demonstrated that superoxide radicals (·O2−) and holes (h+) play crucial roles in the photocatalytic degradation of TC through capture experiments. The current work provides a new idea for constructing high-efficiency photocatalysts based on MIL-125(Ti).
1. Introduction
Antibiotics are medicines that can inhibit and kill bacteria, and have promoted the rapid development of animal husbandry and improved economic benefits.1,2 However, the misuse of antibiotics or long-term consumption of food containing antibiotics may lead to bacterial resistance, which is serious to human health, and antibiotic residues can also damage the ecosystem.3–5 In order to effectively remove antibiotics from water, many physical and chemical techniques have been developed, including coagulation, adsorption and photocatalysis, etc.6–9 Adsorption and coagulation techniques can only simply concentrate or separate organic pollutants.10 As a green chemical process, photocatalytic technology can produce strong oxidizing radicals under light conditions, completely degrading organic pollutants into CO2, H2O and inorganic salts, without any secondary pollution.11–13
Metal–organic frameworks (MOFs) as emerging inorganic–organic hybrid materials have been extensively applied in adsorption,14–16 catalysis,17,18 optoelectronic devices,19,20 gas storage and other fields, due to the feasible adjustment of their pore size and shape and large internal surface area. MIL-125(Ti) as a kind of polyporous crystalline titanium dicarboxylate with a large surface area and accessible pore size,21 becomes enriched with the trace amounts of pollutants in water and then degrades them under the illumination of light. However, MIL-125(Ti) exhibits low absorption efficiency in visible light, quick reorganization of photogenerated electron–hole pairs, and disappointing photocatalytic ability, which confines its application to photocatalysis.22 For the purpose of enhancing the photocatalytic performance of MIL-125(Ti), various MIL-125(Ti) composite photocatalysts have been prepared, such as BiVO4/MIL-125(Ti),23 CdS/MIL-125(Ti),24 MIL-125(Ti)/Ag/g-C3N4,25 In2S3@MIL-125(Ti),26 Ag/rGO/MIL-125(Ti),22 Ag@MIL-125(Ti)27 and so on. However, there is still a need to discover more appropriate semiconductor materials for the preparation of MIL-125(Ti) heterojunctions.
Carbon quantum dots (CQDs) are spherical carbon nanomaterials, which have a wide absorption band, narrow emission band and high quantum yield28 and have received extensive attention in fluorescence sensors,29 biosensing,30 chemical imaging,31 drug applications,32 photocatalysis33 and electrocatalysis.34 CQDs have already become a potential competitor to traditional semiconductor quantum dots.35–39 In recent years, nanocomposites of CQDs such as Fe2O3/CQDs,40 ZnS/CQDs,41 CQDs/g-C3N4,42 CQDs/Bi2WO6 (ref. 43) have shown superior advantages in photocatalytic applications. Thus, the introduction of carbon quantum dots into MOFs not only increases the absorption of visible light but also adds new active sites to the MOF materials.23
Herein, CQDs@MIL-125(Ti) photocatalysts were synthesized using a facile one-pot solvothermal procedure by varying the mass percentage of CQD. The prepared materials were characterized by X-ray diffraction (XRD), scanning electron microscopy (SEM), transmission electron microscopy (TEM), X-ray photoelectron spectroscopy (XPS), Fourier-transform infrared (FT-IR) spectroscopy, Raman spectroscopy and nitrogen adsorption–desorption measurements. The antibiotic tetracycline (TC) was select as a target pollutant or use in photocatalytic experiments. Among these samples, the 10 wt% CQDs@MIL-125(Ti) photocatalyst exhibits excellent photocatalytic activity under visible light irradiation. Moreover, photocurrent and electrochemical impedance spectroscopy (EIS) analyses were used to evaluate the separation and migration of charge carriers. Furthermore, the active species were verified by trapping experiments.
2. Experimental
2.1 Materials
D-(+)-Glucose was obtained from Shanghai Aladdin Industrial Co., China. Concentrated HCl (36–38 wt%) was obtained from Liaoning Quan Rui Reagent Co., Ltd. Tetrabutyl titanate (TBT; C16H36O4Ti) was obtained from Sinopharm Chemical Reagent Co., Ltd. Tetracycline (TC), N,N′-dimethylformamide (DMF; (CH3)2NCHO), 1,4-benzenedicarboxylic acid (H2BDC, C8H6O4) and EDTA-2Na (C10H14N2Na2O8·2H2O) were purchased from Shanghai Macklin Biochemical Co., Ltd. Methanol (CH3OH) was obtained from Tianjin Xintong Fine Chemical Co., Ltd. NaOH was obtained from Beijing Chemical Works. L-Ascorbic acid (L-AA) was purchased from Shanghai Saan Chemical Technology Co., Ltd. Isopropyl alcohol (IPA) was obtained from Shanghai TCI Chemical Industry Development Co., Ltd. All of the raw materials were of analytical grade and used without further purification.
2.2 Preparation of the CQDs and CQDs@MIL-125(Ti)
CQDs were synthesized based on an ultrasonic method by Li et al.44 A 50 mL aqueous solution of glucose (1 mol L−1) was prepared, and to this, HCl (50 mL, 36–38 wt%) was added. Then, the solution mixture was ultrasonicated for 4 h. The CQDs were obtained from the glucose/HCl solution and dried at 80 °C for 12 h.
CQDs@MIL-125(Ti) was synthesized on the basis of a solvothermal method developed by Horiuchi et al.45 Briefly, (1) BDC (2.2 g) was mixed with DMF (36 mL) and methanol (4.0 mL) via ultrasonication for 30 min; (2) the as-prepared CQDs (0.16 g) was added to the above solution and ultrasonicated for 10 min; and (3) TBT (2.4 mL) was added and ultrasonicated for a further 10 min. The mixture was transferred to a Teflon-lined stainless-steel autoclave at 150 °C for 48 h. After the reaction, the resultant precipitate was separated via centrifugation at 8000 rpm min−1 for 8 min, and then washed 3 times with methanol. Finally, the obtained sample was dried at 180 °C for 2 h to obtain the 10 wt% CQDs@MIL-125(Ti), referred to as CT-10. X-CQDs@MIL-125(Ti) systems were prepared by varying the CQD mass percentage to 5.0% (CT-5), 15.0% (CT-15) and 20.0% (CT-20). MIL-125(Ti) was prepared without CQDs to use as a comparison under the same conditions.
2.3 Characterization
The crystal structure and crystallinity were analyzed by X-ray diffraction (XRD) using a Rigaku (Japan) D/max 2500 X-ray diffractometer (Cu Kα radiation, λ = 0.15418 nm) in the range of 5–50° (2θ). Field emission scanning electron microscopy (FESEM, JSM-7800F) and field emission transmission electron microscopy (FETEM, Tecnai G2 F20 S-TWIN, FEI) were used to characterize the morphologies and microstructures. The X-ray photoelectron spectroscopy (XPS) measurements were executed on an ESCALAB250XI electron spectrometer (VG Scientific, America) using 300 W Al Kα radiation. The infrared (IR) spectra were recorded from KBr pellets on a PerkinElmer FT-IR spectrometer in the 4000–400 cm−1 region. The Raman spectra were recorded on an inVia Raman spectrometer. The nitrogen adsorption Brunauer–Emmett–Teller (BET) analyses (BET/BJH surface area, 3H-2000PS1) were performed to obtain the specific surface areas. The pore size distribution tests were tested on a Micromeritics ASAP 2460. The UV-vis diffuse reflectance spectra (DRS) were collected using UV-vis spectrophotometer (UV-2550) with BaSO4 as the background. Photocurrents were recorded using a CHI660C electrochemical workstation and electrochemical impedance spectroscopy (EIS) was conducted using a CHI760E electrochemical workstation.
2.4 Photocatalytic experiments
The photocatalytic activities of MIL-125(Ti) and CQDs@MIL-125(Ti) were assessed through the degradation of TC under visible light irradiation. In a typical photocatalytic test, 20 mg of the photocatalysts were dispersed in 100 mL of a 20 mg L−1 TC solution using a 250 W xenon lamp as the visible light source with filter glasses (λ > 420 nm). Before illumination, the mixture was stirred in the dark for 1 h to achieve adsorption–desorption equilibrium. At the same light intervals, 5 mL of the suspension was taken and centrifuged; the supernatant was taken for analysis. The supernatant was analyzed from the maximum absorption at 357 nm by a UV-2550 spectrometer.
Furthermore, the CQDs@MIL-125(Ti) composites were reused under visible light for cycling experiments to test their stability. This process is consistent with the photocatalytic process mentioned above. After each cycle, the photocatalyst was collected by centrifugation at 8000 rpm min−1 for 8 min and washed 3 times with distilled water and ethanol to remove any residual TC. The recycled photocatalyst was dried out at 80 °C prior to use in the following tests.
2.5 Active species trapping experiments
For the purpose of investigating the active species produced in the photocatalytic process, IPA, L-AA and EDTA-2Na were used to quench ·OH, ·O2− and h+, respectively. The active species trapping experiments were in line with the photocatalytic experiments, using 1 mmol of scavenging agent.
3. Results and discussion
3.1 X-ray diffraction analyses
The crystalline nature and compositions of the as-prepared CQDs, MIL-125(Ti) and CQDs@MIL-125(Ti) composite materials were characterized by XRD (Fig. 1). The typical peak at around 20° (2θ) in the powder pattern of the CQDs can be attributed to the (002) crystal plane of the carbon material, which proves the successful synthesis of the CQDs. The diffraction peaks of MIL-125(Ti) can be well matched to those previous reported.21,46 There is no any diffraction peak of the CQDs to be detected for the as-synthesized CQDs@MIL-125(Ti) photocatalysts, which may be on account of the low concentration or small crystal size of the CQDs. Similar results can also be observed in the CQDs/BiVO4 system, according to previous reports.47
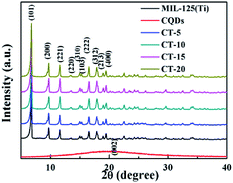 |
| | Fig. 1 XRD patterns of the CQDs and the MIL-125(Ti) and CQDs@MIL-125(Ti) samples. | |
3.2 Microstructure analyses
The morphologies and microstructures of the various catalysts were detected by SEM, TEM and HRTEM. As shown in Fig. 2a, the plate-like MIL-125(Ti) has an average size of 1 μm. After modification with the CQDs, the shape of MIL-125(Ti) does not change (Fig. 2b). From the TEM image of the CQDs (Fig. 2c), the average size of our synthesized CQDs is 4–5 nm. Fig. 2d shows the TEM image of the CT-10 sample, which exhibits the lattice spacing of CQDs of 0.2 nm, corresponding to the (002) crystal plane.48 According to the results, it can be proved that the CQDs@MIL-125(Ti) nanocomposites have been successfully prepared.49
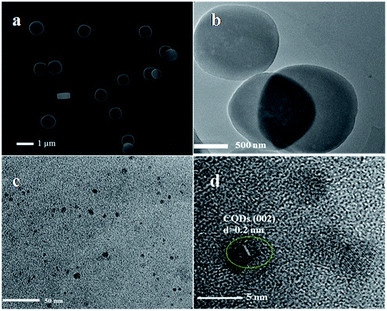 |
| | Fig. 2 (a) SEM image of MIL-125(Ti). (b) TEM images of CT-10 and the (c) CQDs. (d) HRTEM image of CT-10. | |
3.3 XPS analyses
Details of the chemical states of MIL-125 and CT-10 were further determined by XPS measurements. The XPS measurements show that the catalysts consists mainly of O, Ti and C elements (Fig. 3a). In the O 1s XPS spectrum, the two peaks at 530.3 and 531.8 eV can be attributed to the titanium oxo-cluster and C![[double bond, length as m-dash]](https://www.rsc.org/images/entities/char_e001.gif) O bond, respectively (Fig. 3b). In Fig. 3c, the Ti 2p orbital splits into two peaks at 458.9 and 465 eV, consistent with Ti 2p3/2 and Ti 2p1/2, implying that Ti(IV) is present in the titanium oxo-cluster.50 The peaks at 284.85, 286.3 and 288.7 eV correspond to C
O bond, respectively (Fig. 3b). In Fig. 3c, the Ti 2p orbital splits into two peaks at 458.9 and 465 eV, consistent with Ti 2p3/2 and Ti 2p1/2, implying that Ti(IV) is present in the titanium oxo-cluster.50 The peaks at 284.85, 286.3 and 288.7 eV correspond to C![[double bond, length as m-dash]](https://www.rsc.org/images/entities/char_e001.gif) C, disordered sp3 carbon atoms and C
C, disordered sp3 carbon atoms and C![[double bond, length as m-dash]](https://www.rsc.org/images/entities/char_e001.gif) O, respectively (Fig. 3d).
O, respectively (Fig. 3d).
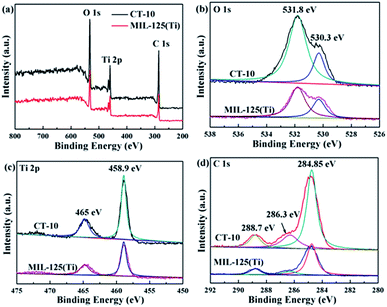 |
| | Fig. 3 XPS spectra of the CT-10 and MIL-125(Ti) photocatalysts: (a) survey spectrum, (b) O 1s, (c) Ti 2p, and (d) C 1s spectra. | |
3.4 FT-IR analyses
As shown in Fig. 4, FT-IR spectroscopy was performed to detect chemical compositions and sample bonding. The peaks between 400–800 cm−1 for MIL-125(Ti) can be contributed to the vibrations of O–Ti–O51 and the peaks in the range of 1000–1300 cm−1 and 1500–1700 cm−1 correspond to the vibrations of C–O and asymmetric stretching vibration of –COOH, respectively. In the FT-IR spectrum of the CQDs, it is found that the strong absorption in the range of 3200–3400 cm−1 corresponds to the stretching vibration of –OH, which proves that the surface of the CQDs contains –OH.23 Characteristic peaks for C–O, –COOH and –OH are observed at the same wavelength in CT-10, and the FT-IR spectroscopic results prove that the CQDs have been successfully anchored to MIL-125(Ti).
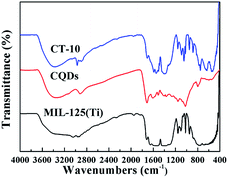 |
| | Fig. 4 FT-IR spectra of MIL-125(Ti), the CQDs and CT-10. | |
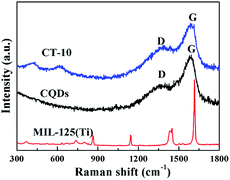
3.5 Raman analyses
Raman spectroscopy is a significant technique that can be used to understand the structural arrangement of carbon allotropes and their hybrids.52 In the Raman spectra, the absorption peaks of the CQDs at 1362 and 1575 cm−1 correspond to the D and G bands (Fig. 5), and they are associated with disordered sp3 carbon atoms and conjugated sp2 carbon atoms, respectively.53,54 In addition, slightly shifted D and G band were observed for CT-10 compared with those of CQDs, which provides further evidence for the chemical bonding of the carbon materials.55 The Raman peaks of CT-10 located at 421 and 618 cm−1 are in accordance with the B1g and E1g vibrations of MIL-125(Ti), indicating that the chemical environment of the Ti atoms is maintained and that the only possible bond between the CQDs and MIL-125(Ti) is Ti–O–C.56–58
 |
| | Fig. 5 Raman spectra of MIL-125(Ti), the CQDs and CT-10. | |
3.6 Nitrogen adsorption–desorption properties
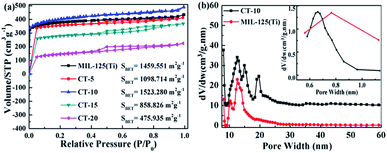
In the photocatalytic process, high specific surface areas can directly affect the photoactivities and adsorption abilities of the photocatalysts.59,60 As shown in Fig. 6a, when the pressure is equal to atmospheric pressure, the N2 adsorptions of the MIL-125(Ti) and CQDs@MIL-125(Ti) samples at 77 K reveal type I behavior, indicating that they are microporous materials. The surface areas of MIL-125(Ti), CT-5, CT-10, CT-15 and CT-20 are 1459.551, 1098.714, 1523.280, 858.826 and 475.935 m2 g−1, respectively. The pore size distributions are shown in Fig. 6b, and we have proven through tests that the surface pore sizes of the MIL-125(Ti) and CT-10 materials are 13 nm and the internal pore sizes are 0.76 and 0.69 nm, which proves that the materials are microporous. CT-10 has the largest specific surface area compared to the other materials and will promote the efficient transfer of electrons to the surface of the material and provide more active sites for photocatalytic reactions.
 |
| | Fig. 6 (a) The N2 adsorption–desorption isotherms of the MIL-125(Ti) and CQDs@MIL-125(Ti) samples. (b) The pore size distributions of MIL-125(Ti) and CT-10. | |
3.7 UV-vis DRS analyses
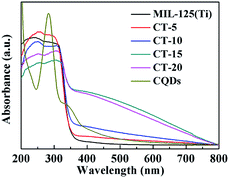
The UV-vis DRS of the CQDs, MIL-125(Ti) and CT-10 are shown in Fig. 7. MIL-125(Ti) has an absorption edge of approximately 380 nm and absorbs less visible light. The peaks of the CQDs at 250–300 nm indicate absorption representative of an aromatic π system, which is consistent with that of polycyclic aromatic hydrocarbons.36,61 In addition, the CQDs show strong absorption in the visible light range. Obviously, as the content of the CQDs increases, the light absorption range and light absorption intensity are significantly enhanced. Significantly, the CQDs@MIL-125(Ti) composites show continuous wider absorption in the range of 500–800 nm compared with MIL-125(Ti), which means that under the same light irradiation, the photocatalysts may be excited by more light to produce more electron–hole pairs, resulting in higher photocatalytic activity.
 |
| | Fig. 7 UV-vis DRS of the MIL-125(Ti) and CQDs@MIL-125(Ti) samples. | |
3.8 Photocatalytic performance
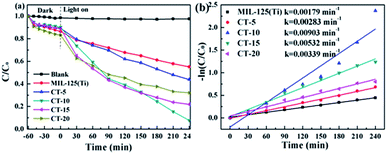
In this work, in order to evaluate the photocatalytic performance of the as-prepared photocatalysts, TC was used as a model antibiotic. Blank tests indicate that the degradation of TC is negligible in the absence of a photocatalyst. Fig. 8a shows the effect of the loading of CQDs on the photocatalytic degradation. The degradation rate of MIL-125(Ti) only reaches 45% after 4 h of illumination. Compared to MIL-125(Ti), the degradation efficiencies were significantly enhanced after the deposition of CQDs. The photocatalytic degradation efficiencies of TC are 56%, 90%, 78% and 67% for CT-5, CT-10, CT-15, CT-20, respectively. As the amount of the CQDs is increased, the photocatalytic performance is improved compared with that of pure MIL-125(Ti). When the loading of CQDs reaches 10%, the degradation effect is the best, and the degradation rate can reach more than 90%. This is because the introduced CQDs in the composite can absorb more visible light and stimulate the production of more photogenerated electron holes. However, when the amount of CQDs exceeds 10%, the degradation rate of TC gradually decreases, probably because an excessive amount of CQDs hinders the photocatalyst active sites.62
 |
| | Fig. 8 (a) The photocatalytic degradation curves of TC with the as-prepared samples. (b) Pseudo-first-order kinetic plots for TC photodegradation with the as-prepared samples. | |
Obviously, Fig. 8b shows that the photocatalytic degradation curve can be well fitted to a pseudo-first-order correlation (−ln(C/C0) = kappt, where kapp is the pseudo-first-order rate constant and t is the irradiation time).63 The kapp values of MIL-125(Ti), CT-5, CT-10, CT-15, and CT-20 were computed to be 0.00179, 0.00283, 0.00903, 0.00532, and 0.00339 min−1, respectively. The CT-10 photocatalyst displays the optimal rate constant, which is about 5 times higher than that of pure MIL-125(Ti).
The form of tetracycline in water changes with pH, so it is necessary to understand the effect of initial pH on the photocatalytic degradation of tetracycline. Fig. 9a shows the photocatalytic degradation of TC by CT-10. Under alkaline and strong acidic conditions, the effect of the catalyst on the tetracycline is greater than that of photocatalytic degradation. When the pH is equal to 5, TC exists in the form of TC0 (uncharged TC molecule), meaning that the surface active site of the catalyst is better utilized, so the degradation effect is the best.64,65
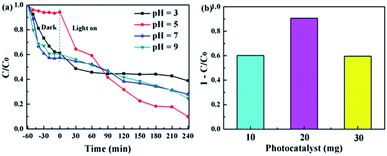 |
| | Fig. 9 (a) The effect of the initial pH on the photocatalytic activity. (b) The effect that the amount of CT-10 has on the photocatalytic activity. | |
In addition, the effect of the photocatalyst dose on the photocatalytic activity is also discussed. As shown in Fig. 9b, as the amount of catalyst increases, the degradation rate shows a trend of rising first and then decreasing (10 mg/60%, 20 mg/90%, 30 mg/59.5%). At first, a lower amount of catalyst results in fewer photoelectron–hole pairs, so the degradation rate of the contaminant is lower. Then, as the amount of catalyst increases, the photocatalytic activity increases. An excessive amount of photocatalyst can hinder the propagation of photons in solution, and reduce the rate of catalytic reaction. Therefore, the influence of the amount of the catalyst on photocatalysis cannot be ignored.23
3.9 Photocurrents and EIS analyses
Photocurrent and EIS analyses are tools that can be used to characterize the charge-carrier efficient migration. These results further confirm the interface charge transfer effect of CQDs@MIL-125(Ti).66,67 As shown in Fig. 10a, compared with MIL-125(Ti), the CT-10 photocatalyst shows a higher photocurrent response because CQDs can be used as electron reservoirs to store electrons, effectively cutting down the recombination of electrons and hole pairs.68,69 In addition, the arc radius in the EIS Nyquist diagram reflects the separation effect of the photogenerated electron–hole pair in charge transfer and hybridization at the interface.69,70 From the Nyquist diagram (Fig. 10b), it can be observed that the radius of the CT-10 nanocomposite is smaller than that of pure MIL-125(Ti). This indicates that the CT-10 has lower resistance, which is favorable for promoting interface charge separation and transfer.
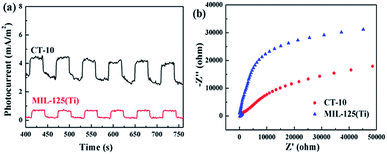 |
| | Fig. 10 (a) Photocurrent responses of MIL-125(Ti) and CT-10. (b) EIS of the MIL-125(Ti) and CT-10. | |
3.10 Photocatalytic mechanism research
For the purpose of exploring the mechanism of CT-10 photocatalytic activity enhancement, a series of free radical capture experiments were carried out. L-AA, EDTA-2Na and IPA were introduced into the photocatalytic reaction system separately to trap ·O2−, h+ and ·OH, correspondingly. The efficiency of the photocatalytic degradation was slightly changed after adding IPA compared with the non-scavenging system, indicating that ·OH does not play a main role in the photocatalysis process (Fig. 11). After the addition of L-AA and EDTA-2Na, the photocatalytic performance was significantly decreased, which proves that ·O2− and h+ are the predominant active species.
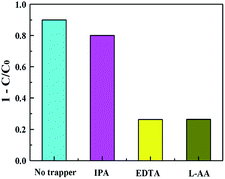 |
| | Fig. 11 Active species trapping experiments for TC degradation over the CT-10 photocatalyst. | |
Based on the above results, the possible mechanism by which CQDs@MIL-125(Ti) degrades TC under visible light can be explained using Fig. 12. When exposed to visible light, the photocatalysts are excited to generate photogenerated electron–hole pairs and electrons reduce Ti4+ to Ti3+, which has strong reducing ability. Ti3+ can reduce O2 to superoxide radical ions (·O2−). The valence transition from Ti3+ to Ti4+ has been confirmed by Fu et al.71 and Wang et al.72 Finally, h+ and ·O2− degrade TC into other products. Here, the CQDs can be used as electron collectors and transporters, thus the electrons and holes on the catalyst surface can be separated more efficiently and the electrons and holes can act as reaction centers or form other highly reactive radicals to degrade pollutants.73,74 Based on the above analysis, the photocatalytic degradation and charge carrier transfer processes can be described as follows:
| | |
CQDs@MIL-125(Ti) + hv → e− + h+
| (1) |
| | |
Ti3+ + O2 → Ti4+ + ·O2−
| (3) |
| | |
·O2− + TC → degradation products
| (4) |
| | |
h+ + TC → degradation products
| (5) |
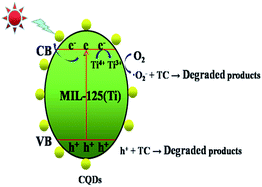 |
| | Fig. 12 The possible photocatalytic mechanism of the CQDs@MIL-125(Ti) photocatalyst in the degradation of TC under visible light irradiation. | |
3.11 Photocatalytic stability and repeatability of the as-prepared photocatalysts
The stability and repeatability of photocatalysts are important factors for practical applications. TC was subjected to degradation experiments by continuous irradiation under visible light. As shown in Fig. 13a, the photocatalyst still showed high catalytic activity and stability after four cycles of catalysis. XRD tests on the recycled catalyst show no significant difference in the patterns compared to those of fresh CT-10 (Fig. 13b). This indicates that a protective cover may form on the surface of MIL-125(Ti) due to the introduction of the CQDs, delaying the possible photo-etching of MIL-125(Ti) and improving the stability of the photocatalyst during photocatalysis.75,76
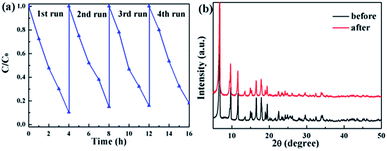 |
| | Fig. 13 (a) Photocatalytic degradation of four successive runs. (b) XRD patterns of the CT-10 photocatalyst before and after four cycles of photocatalytic degradation. | |
4. Conclusions
In conclusion, a CQDs@MIL-125(Ti) photocatalyst was successfully synthesized using a solvothermal procedure. The results of TC photocatalytic degradation demonstrate that the 10 wt% CQDs@MIL-125(Ti) photocatalyst has the highest photocatalytic efficiency, with a degradation rate of up to 90%. This outstanding photocatalytic activity can be ascribed to the enhanced absorption of visible light after the addition of CQDs, effectively reducing photogenerated electron–hole recombination. This work provides new ideas for building efficient photocatalysts that are expected to be applied to other areas.
Author contributions
All of the authors contributed to this work.
Conflicts of interest
There are no conflicts to declare.
Acknowledgements
This work is supported by the National Natural Science Foundation (No. 21576112), the Natural Science Foundation Project of Jilin Province (20180623042TC, 20180101181JC, 20170520147JH), the Project of Human Resources and Social Security Department of Jilin Province (2017956), and the Project of Development and Reform Commission of Jilin Province (2019C044-2).
References
- R. J. Erskine, S. Wagner and F. J. De Graves, Veterinary Clinics of North America: Food Animal Practice, 2003, 19, 109–138 Search PubMed.
- S. A. McEwen and P. J. Fedorka-Cray, Clin. Infect. Dis., 2002, 34, 93–106 CrossRef.
- J. C. Chee-Sanford, R. I. Aminov, I. J. Krapac, N. Garrigues-Jeanjean and R. I. Mackie, Appl. Environ. Microbiol., 2001, 67, 1494–1502 CrossRef CAS.
- J. Li, T. Wang, B. Shao, J. Z. Shen, S. C. Wang and Y. N. Wu, Environ. Health Perspect., 2012, 120, 1144–1149 CrossRef CAS.
- S. Leclercq, F. M. Mian, A. M. Stanisz, L. B. Bindels, E. Cambier, H. Ben-Amram, O. Koren, P. Forsythe and J. Bienenstock, Nat. Commun., 2017, 8, 1–12 CrossRef.
- L. Zhang, X. Z. Yuan, H. Wang, X. H. Chen, Z. B. Wu, Y. Liu, S. S. Gu, Q. Jiang and G. M. Zeng, RSC Adv., 2015, 5, 98184–98193 RSC.
- E. Brillas and C. A. Martínez-Huitle, Appl. Catal., B, 2015, 166, 603–643 CrossRef.
- L. J. Leng, X. Z. Yuan, H. J. Huang, H. Wang, Z. B. Wu, L. H. Fu, X. Peng, X. H. Chen and G. M. Zeng, Fuel Process. Technol., 2015, 129, 8–14 CrossRef CAS.
- H. Wang, X. Z. Yuan, H. Wang, X. H. Chen, Z. B. Wu, L. B. Jiang, W. P. Xiong and G. M. Zeng, Appl. Catal., B, 2016, 193, 36–46 CrossRef CAS.
- P. V. A. Padmanabhan, K. P. Sreekumar, T. K. Thiyagarajan, R. U. Satpute, K. Bhanumurthy, P. Sengupta, G. K. Dey and K. G. K. Warrier, Vacuum, 2006, 80, 1252–1255 CrossRef CAS.
- H. N. Che, G. B. Che, E. H. Jiang, C. B. Liu, H. J. Dong and C. M. Li, J. Taiwan Inst. Chem. Eng., 2018, 91, 224–234 CrossRef CAS.
- L. B. Mu, C. L. Shao, Z. C. Guo, Z. Y. Zhang, M. Y. Zhang, P. Zhang, B. Chen and Y. C. Liu, ACS Appl. Mater. Interfaces, 2011, 3, 590–596 CrossRef.
- C. M. Li, S. Y. Yu, H. J. Dong, C. B. Liu, H. J. Wu, H. N. Che and G. Chen, Appl. Catal., B, 2018, 238, 284–293 CrossRef CAS.
- Z. M. Li, Y. Qiao, C. B. Liu, Y. F. Zhou, X. Y. Wang, P. A. Charpentier, G. B. Che, W. Z. Xu, L. H. Liu and E. W. Zhu, Dalton Trans., 2018, 47, 7761–7775 RSC.
- Z. B. Wu, X. Z. Yuan, H. Zhong, H. Wang, G. M. Zeng, X. H. Chen, H. Wang, L. Zhang and J. G. Shao, Sci. Rep., 2016, 6, 25638 CrossRef CAS.
- S. L. Xiao, Y. H. Li, P. J. Ma and G. H. Cui, Inorg. Chem. Commun., 2013, 37, 54–58 CrossRef CAS.
- J. L. Wang, C. Wang and W. B. Lin, ACS Catal., 2012, 2, 2630–2640 CrossRef CAS.
- T. Zhang and W. B. Lin, Chem. Soc. Rev., 2014, 43, 5982–5993 RSC.
- H. S. Quah, W. Q. Chen, M. K. Schreyer, H. Yang, M. W. Wong, W. Ji and J. J. Vittal, Nat. Commun., 2015, 6, 7954 CrossRef CAS.
- P. Banerjee, D. E. Lobo, R. Middag, W. K. Ng, M. E. Shaibani and M. Majumder, ACS Appl. Mater. Interfaces, 2015, 7, 3655–3664 CrossRef CAS.
- H. Wang, X. Z. Yuan, Y. Wu, G. M. Zeng, X. H. Chen, L. J. Leng, Z. B. Wu, L. B. Jiang and H. Li, J. Hazard. Mater., 2015, 286, 187–194 CrossRef CAS.
- S. Kampouri, T. N. Nguyen, M. Spodaryk, R. G. Palgrave, A. Züttel, B. Smit and K. C. Stylianou, Adv. Funct. Mater., 2018, 28, 1806368 CrossRef.
- Z. Q. Yang, J. Ding, J. N. Feng, C. He, Y. Li, X. W. Tong, X. J. Niu and H. G. Zhang, Appl. Organomet. Chem., 2018, 32, e4285 CrossRef.
- A. Rahmani, H. B. M. Emrooz, S. Abedi and A. Morsali, Mater. Sci. Semicond. Process., 2018, 80, 44–51 CrossRef CAS.
- Z. W. Yang, X. Q. Xu, X. X. Liang, C. Lei, Y. H. Cui, W. H. Wu, Y. X. Yang, Z. Zhang and Z. Q. Lei, Appl. Catal., B, 2017, 205, 42–54 CrossRef CAS.
- H. Wang, X. Z. Yuan, Y. Wu, G. M. Zeng, H. R. Dong, X. H. Chen, L. J. Leng, Z. B. Wu and L. J. Peng, Appl. Catal., B, 2016, 186, 19–29 CrossRef CAS.
- H. X. Guo, D. Guo, Z. S. Zheng, W. Weng and J. H. Chen, Appl. Organomet. Chem., 2015, 29, 618–623 CrossRef CAS.
- U. Resch-Genger, M. Grabolle, S. Cavaliere-Jaricot, R. Nitschke and T. Nann, Nat. Methods, 2008, 5, 763–775 CrossRef CAS.
- Y. Q. Dong, R. X. Wang, G. L. Li, C. Q. Chen, Y. W. Chi and G. N. Chen, Anal. Chem., 2012, 84, 6220–6224 CrossRef CAS.
- G. Mo, X. He, C. Zhou, D. Ya, J. Feng, C. Yu and B. Deng, Biosens. Bioelectron., 2019, 126, 558–564 CrossRef CAS.
- X. Zhang, H. Ming, R. H. Liu, X. Han, Z. H. Kang, Y. Liu and Y. L. Zhang, Mater. Res. Bull., 2013, 48, 790–794 CrossRef CAS.
- C. T. Matea, T. Mocan, F. Tabaran, T. Pop, O. Mosteanu, C. Puia and L. Mocan, Int. J. Nanomed., 2017, 12, 5421–5431 CrossRef CAS.
- B. Y. Yu and S. Y. Kwak, J. Mater. Chem., 2012, 22, 8345–8353 RSC.
- W. Li, Y. Liu, M. Wu, X. Feng, S. A. Redfern, Y. Shang and B. Li, Adv. Mater., 2018, 30, 1800676 CrossRef.
- S. N. Baker and G. A. Baker, Angew. Chem., Int. Ed., 2010, 49, 6726–6744 CrossRef CAS.
- L. Y. Zheng, Y. W. Chi, Y. Q. Dong, J. P. Lin and B. B. Wang, J. Am. Chem. Soc., 2009, 131, 4564–4565 CrossRef CAS.
- W. B. Lu, X. Y. Qin, S. Liu, G. H. Chang, Y. W. Zhang, Y. L. Luo, A. D. Asiri, A. O. Al-Youbi and X. P. Sun, Anal. Chem., 2012, 84, 5351–5357 CrossRef CAS.
- S. Liu, J. Q. Tian, L. Wang, Y. W. Zhang, X. Y. Qin, Y. L. Luo, A. M. Asiri, A. O. Al-Youbi and X. P. Sun, Adv. Mater., 2012, 24, 2037–2041 CrossRef CAS.
- R. Q. Ye, C. S. Xiang, J. Lin, Z. W. Peng, K. W. Huang, Z. Yan, N. P. Cook, E. L. G. Samuel, C. C. Hwang, G. D. Ruan, G. Ceriotti, A. R. O. Raji, A. A. Marti and J. M. Tour, Nat. Commun., 2013, 4, 2943 CrossRef.
- H. C. Zhang, H. Ming, S. Y. Lian, H. Huang, H. T. Li, L. L. Zhang, Y. Liu, Z. H. Kang and S.-T. Lee, Dalton Trans., 2011, 40, 10822–10825 RSC.
- S. Kaur, S. Sharma and S. K. Kansal, Superlattices Microstruct., 2016, 98, 86–95 CrossRef CAS.
- Y. Z. Hong, Y. D. Meng, G. Y. Zhang, B. X. Yin, Y. Zhao, W. D. Shi and C. S. Li, Sep. Purif. Technol., 2016, 171, 229–237 CrossRef CAS.
- J. Di, J. Xia, Y. Ge, H. Li, H. Ji, H. Xu, Q. Zhang, H. Li and M. Li, Appl. Catal., B, 2015, 168, 51–61 CrossRef.
- H. T. Li, X. D. He, Y. Liu, H. Huang, S. Y. Lian, S.-T. Lee and Z. H. Kang, Carbon, 2011, 49, 605–609 CrossRef CAS.
- Y. Horiuchi, T. Toyao, M. Saito, K. Mochizuki, M. Iwata, H. Higashimura, M. Anpo and M. Matsuoka, J. Phys. Chem. C, 2012, 116, 20848–20853 CrossRef CAS.
- Y. Fu, D. Sun, Y. Chen, R. Huang, Z. Ding, X. Fu and Z. Li, Angew. Chem., Int. Ed., 2012, 51, 3364–3367 CrossRef CAS.
- D. Tang, H. C. Zhang, H. Huang, R. H. Liu, Y. Z. Han, Y. Liu, C. Y. Tong and Z. H. Kang, Dalton Trans., 2013, 42, 6285–6289 RSC.
- W. W. Shen, D. S. Mao, Z. M. Luo and J. Yu, RSC Adv., 2017, 7, 27689–27698 RSC.
- J. F. Feng, S. T. Gao, J. L. Shi, T. F. Liu and R. Gao, Inorg. Chem., 2018, 57, 2447–2454 CrossRef CAS.
- R. R. Jiang, D. H. Wu, G. H. Lu, Z. H. Yan and J. C. Liu, Chemosphere, 2019, 227, 82–92 CrossRef CAS.
- X. Q. Hao, Z. L. Jin, J. Xu, S. X. Min and G. X. Lu, Superlattices Microstruct., 2016, 94, 237–244 CrossRef CAS.
- Z. H. Rada, H. R. Abid, J. Shang, Y. He, P. Webley, S. Liu, H. Sun and S. Wang, Fuel, 2015, 160, 318–327 CrossRef CAS.
- Y. Z. Han, H. Huang, H. C. Zhang, Y. Liu, X. Han, R. H. Liu, H. T. Li and Z. H. Kang, ACS Catal., 2014, 4, 781–787 CrossRef CAS.
- J. Gao, F. Liu, Y. Liu, N. Ma, Z. Wang and X. Zhang, Chem. Mater., 2010, 22, 2213–2218 CrossRef CAS.
- Z. H. Sun, J. J. Guo, S. M. Zhu, L. Mao, J. Ma and D. Zhang, Nanoscale, 2014, 6, 2186–2193 RSC.
- Y. L. Sui, L. Wu, S. K. Zhong and Q. X. Liu, Appl. Surf. Sci., 2019, 480, 810–816 CrossRef CAS.
- Z. Y. Guo, Q. Wang, T. Shen, X. J. Hou, J. L. Kuang, W. X. Liu and W. B. Cao, Ceram. Int., 2019, 45, 5858–5865 CrossRef CAS.
- X. Z. Yuan, H. Wang, Y. Wu, G. M. Zeng, X. H. Chen, L. J. Leng, Z. B. Wu and H. Li, Appl. Organomet. Chem., 2016, 30, 289–296 CrossRef CAS.
- M. H. Wang, L. Y. Yang, J. Y. Yuan, L. H. He, Y. P. Song, H. Z. Zhang, Z. H. Zhang and S. M. Fang, RSC Adv., 2018, 8, 12459–12470 RSC.
- C. X. Li, X. Y. Li, B. Liu, X. Y. Wang, G. B. Che and X. Lin, Chin. J. Chem. Phys., 2018, 31, 92 CrossRef CAS.
- H. N. Che, L. H. Liu, G. B. Che, H. J. Dong, C. B. Liu and C. M. Li, Chem. Eng. J., 2019, 357, 209–219 CrossRef CAS.
- H. N. Che, C. B. Liu, W. Hu, H. Hu, J. Q. Li, J. Y. Dou, W. D. Shi, C. M. Li and H. J. Dong, Catal. Sci. Technol., 2018, 8, 622–631 RSC.
- C. X. Li, H. N. Che, C. B. Liu, G. B. Che, P. A. Charpentier, W. Z. Xu, X. Y. Wang and L. L. Liu, J. Taiwan Inst. Chem. Eng., 2019, 95, 669–681 CrossRef CAS.
- M. T. Islam, R. Saenz-Arana, C. Hernandez, T. Guinto, M. A. Ahsan, H. Kim, Y. R. Lin, B. Alvarado-Tenorio and J. C. Noveron, RSC Adv., 2018, 8, 32545–32557 RSC.
- P. H. Chang, Z. H. Li, J. S. Jean, W. T. Jiang, C. J. Wang and K. H. Lin, Appl. Clay Sci., 2012, 67, 158–163 CrossRef.
- H. C. Zhang, H. Huang, H. Ming, H. T. Li, L. L. Zhang, Y. Liu and Z. H. Kang, J. Mater. Chem., 2012, 22, 10501–10506 RSC.
- H. N. Che, C. B. Liu, H. J. Dong, C. M. Li, X. T. Liu and G. B. Che, Int. J. Hydrogen Energy, 2019, 44, 20029–20041 CrossRef CAS.
- R. R. Jiang, G. H. Lu, D. H. Wu, Z. H. Yan, R. R. Zhou and X. H. Bao, Chem. Eng. J., 2019, 374, 79–90 CrossRef CAS.
- Y. Z. Hong, E. L. Liu, J. Y. Shi, X. Lin, L. Z. Sheng, M. Zhang, L. Y. Wang and J. H. Chen, Int. J. Hydrogen Energy, 2019, 44, 7194–7204 CrossRef CAS.
- Y. Ma, H. Xu, Y. Zeng, C. L. Ho, C. H. Chui, Q. Zhao, W. Huang and W. Y. Wong, J. Mater. Chem. C, 2015, 3, 66–72 RSC.
- Y. H. Fu, D. R. Sun, Y. J. Chen, R. K. Huang, Z. X. Ding, X. Z. Fu and Z. H. Li, Angew. Chem., Int. Ed. Engl., 2012, 51, 3364–3367 CrossRef CAS.
- H. Wang, X. Yuan, Y. Wu, G. Zeng, X. Chen, L. Leng, Z. Wu, L. Jiang and H. Li, J. Hazard. Mater., 2015, 286, 187–194 CrossRef CAS.
- Z. Huang, L. Fang, W. Dong, Y. Liu and Z. H. Kang, J. Nanosci. Nanotechnol., 2014, 14, 4156–4163 CrossRef CAS.
- W. Wang, Y. R. Ni and Z. Z. Xu, J. Alloys Compd., 2015, 622, 303–308 CrossRef CAS.
- J. B. Chen, H. N. Che, K. Huang, C. B. Liu and W. D. Shi, Appl. Catal., B, 2016, 192, 134–144 CrossRef CAS.
- H. N. Che, G. B. Che, P. J. Zhou, C. B. Liu, H. J. Dong, C. X. Li, N. Song and C. M. Li, Chem. Eng. J., 2020, 382, 122870 CrossRef CAS.
|
| This journal is © The Royal Society of Chemistry 2019 |
Click here to see how this site uses Cookies. View our privacy policy here.  Open Access Article
 *,
Wei Jiang,
Lihui Liu* and
Hairui Wang

![[double bond, length as m-dash]](https://www.rsc.org/images/entities/char_e001.gif) O bond, respectively (Fig. 3b). In Fig. 3c, the Ti 2p orbital splits into two peaks at 458.9 and 465 eV, consistent with Ti 2p3/2 and Ti 2p1/2, implying that Ti(IV) is present in the titanium oxo-cluster.50 The peaks at 284.85, 286.3 and 288.7 eV correspond to C
O bond, respectively (Fig. 3b). In Fig. 3c, the Ti 2p orbital splits into two peaks at 458.9 and 465 eV, consistent with Ti 2p3/2 and Ti 2p1/2, implying that Ti(IV) is present in the titanium oxo-cluster.50 The peaks at 284.85, 286.3 and 288.7 eV correspond to C![[double bond, length as m-dash]](https://www.rsc.org/images/entities/char_e001.gif) C, disordered sp3 carbon atoms and C
C, disordered sp3 carbon atoms and C![[double bond, length as m-dash]](https://www.rsc.org/images/entities/char_e001.gif) O, respectively (Fig. 3d).
O, respectively (Fig. 3d).


