 Open Access Article
N-Enriched carbon nanofibers for high energy density supercapacitors and Li-ion batteries†
Sayali B. Kalea,
Manjiri A. Mahadadalkarb,
Chang Hyo Kimc,
Yoong Ahm Kimd,
Manish S. Jayswal b,
Kap Seung Yangd and
Bharat B. Kale
 *b
*b
aTechnology Department, Savitribai Phule Pune University, Pune, 411008, India
bCentre for Materials for Electronics Technology (C-MET), Ministry of Electronics and Information Technology, Govt. of India, Panchwati, Pune-411008, India. E-mail: bbkale@cmet.gov.in
cMultifunctional Structural Composite Research Center, Korea Institute of Science and Technology, Jeonbuk branch, Chudong-ro 92, Bongdong-eup, Wanju-gun, Jeonbuk, 55324, Republic of Korea
dDepartment of Polymer Engineering, Graduated School, School of Polymer Science and Engineering & Alan G. MacDiarmid Energy Research Institute, Chonnam National University, 77 Yongbong-ro, Buk-gu, Gwangju, 61186, Republic of Korea
First published on 5th November 2019
Abstract
Nitrogen enriched carbon nanofibers have been obtained by one-step carbonization/activation of PAN-based nanofibers with various concentrations of melamine at 800 °C under a N2 atmosphere. As synthesised carbon nanofibers were directly used as electrodes for symmetric supercapacitors. The obtained PAN-MEL fibers with 5% melamine stabilised at 280 °C and carbonized at 800 °C under a nitrogen atmosphere showed excellent electrochemical performance with a specific capacitance of up to 166 F g−1 at a current density of 1A g−1 using 6 M KOH electrolyte and a capacity retention of 109.7% after 3000 cycles. It shows a 48% increase as compared to pristine carbon nanofibers. Two electrode systems of the CNFM5 sample showed high energy densities of 23.72 to 12.50 W h kg−1 at power densities from 400 to 30![[thin space (1/6-em)]](https://www.rsc.org/images/entities/char_2009.gif) 000 W kg−1. When used as an anode for Li-ion battery application the CNFM5 sample showed a high specific capacity up to 435.47 mA h g−1 at 20 mA g−1, good rate capacity and excellent cycling performance (365 mA h g−1 specific capacity even after 200 cycles at 100 mA g−1). The specific capacity obtained for these nitrogen enriched carbon nanofibers is higher than that for pristine carbon nano-fibers.
000 W kg−1. When used as an anode for Li-ion battery application the CNFM5 sample showed a high specific capacity up to 435.47 mA h g−1 at 20 mA g−1, good rate capacity and excellent cycling performance (365 mA h g−1 specific capacity even after 200 cycles at 100 mA g−1). The specific capacity obtained for these nitrogen enriched carbon nanofibers is higher than that for pristine carbon nano-fibers.
1 Introduction
Cost-effective and eco-friendly energy storage systems are the need of the hour due to the limited availability of petroleum resources and escalating energy utilization.1 Supercapacitors and Li-ion batteries have attracted a great deal of attention because of their simple principles, high durability, high power density, fast charging–discharging mechanism and long cycle life.2–6 They have a wide range of applications in digital equipment, electrical cars and pulsing techniques.7–9 Carbon based materials are well known as potential candidates for energy storage applications due to their low cost, high conductivity, and ready availability.10a–d Carbon nanotubes, mesoporous carbon, and graphene are widely explored as electrodes for supercapacitors and Li-ion battery applications.11,12 These materials show good potential for energy storage but the tedious synthesis processes and difficulty in scaling up their production restricts their application. Hence, carbon nanofibres produced by electrospinning are a better alternative to these materials.Electrospinning is a very popular and well known technique used for polymer fibres with varying diameters. The fibres can be electrospun into yarn, well arranged fibrous arrays, or self-standing tapes.13–17 Polyacrylonitrile (PAN) gives good quality carbon nanofibres after stabilization and carbonization process. The porosity, presence of hetero-atoms and conductivity of PAN based carbon fibres depends on these stabilization and carbonization processes. Chemical or physical activation of PAN-based carbon materials is well reported previously.18–22 When ZnCl2 or KOH, are used for chemical activation, a lot of impurities remain in the fibers as by-products.18 Many a times it leads to removal of most of the heteroatom functionalities such as functional groups containing N, S and O in due course of activation.21 Lower reaction temperature may be useful for obtaining satisfactory surface structure, but it leads to poor conductivity of materials. As a result, these materials cannot be used as a potential candidate for high power density devices. In case of PAN based materials the biggest advantage of activation process is, nitrogenated and oxygenated functionalities responsible for pseudo-capacitive behaviour last during this process.
In this study, PAN-based carbon fibres were obtained by electrospinning with addition of various concentrations of melamine for N doping. The electrospun fibres were then stabilised at 280 °C and carbonized at 800 °C in nitrogen atmosphere. The series of electrodes are prepared and electrochemically characterized in 6 M KOH as electrolyte. PAN-based carbon fibre electrodes show high power density supercapacitors and an anode for Li-ion battery application due to different nitrogen containing functionalities present in it as a result of addition of melamine.
2 Experimental
2.1 Synthesis of PAN/Mel based carbon nanofibres
To fabricate polyacrylonitrile/melamine (PAN/Mel)-based carbon nanofibres by electrospinning, 1% melamine was dispersed in N,N-dimethylformamide (DMF). 10 Weight% PAN was added to melamine dispersed DMF solution with continuous stirring and heating to ensure formation of homogeneous solution. This polymeric solution was filled and ejected through a syringe (feed rate was kept at 4 ml h−1) by applying a 25 kV bias between a rotating collector and the syringe needle to form nanofibres. The prepared electrospun PAN/Mel nanofibres were stabilized in air at 280 °C.23 The stabilized nanofibres were further heated at 800 °C under N2 atmosphere at a heating rate of 5 °C min−1 for carbonization to obtain the final product (CNFM1). The various weight percent of melamine such as 3% (CNFM3), 5% (CNFM5) and 10% (CNFM10) were added to study its effect on carbon nanofibres. Sample CNF800 was prepared without melamine addition.2.2 Materials characterisations
The polyacrylonitrile/melamine (PAN/Mel)-based carbon nanofiber's morphology was analyzed by Field Emission Scanning Electron Microscopy (FESEM, Hitachi, S-4700) and Transmission Electron Microscopy (TEM, (Phillips, TECHNAI-F20)). The elemental surface composition of the carbon nanofibers was analyzed by X-ray Photoelectron Spectroscopy (XPS, Thermo Scientific, ESCALAB 250). The chemical structure of the carbon nanofibers was studied by Raman Spectroscopy (NANOBASE, XperRam200, laser line: 532 nm) and X-ray Diffraction (XRD-D8, Advance, Bruker-AXS) with Cu Kα radiation.2.3 Electrochemical measurements
For the electrochemical measurements of supercapacitor application the self standing, flexible tapes of carbon nanofibers (CNF800, CNFM5) without any binding and conductive materials were used as electrode material. These self standing, flexible tapes were cut into 1.5 × 1.5 cm2 and were used to form a symmetric supercapacitor device. Filter paper and nickel foil were used as separator and current collectors respectively. 6 M KOH was chosen for the aqueous electrolyte. A multichannel potentiostat/galvanostat (WBCS 3000 battery cycler system, Won-A Tech. Co., Korea) was used to determine the electrochemical properties. A voltage window of 0–1.0 V was used for GCD measurement of the specific capacitance at various current densities ranging between 1 to 30 A g−1. Electrochemical impedance spectroscopy (EIS) study was done by using impedance analyzer (IM6e, Zahner Electrik) (frequency range 10 mHz to 100 kHz).To perform electrochemical measurements for Li-ion battery application 2032 type coin cells were fabricated using the self standing, flexible tapes of carbon nanofibre CNFM5 without any binding and conductive materials as working electrode. CNFM5 tape was cut into circular disk of diameter 16 mm. Quartz filter paper and metallic lithium foil (thickness 75 μm) were used as separator and counter electrode respectively. 1 M LiPF6 in dimethyl carbonate (DMC)![[thin space (1/6-em)]](https://www.rsc.org/images/entities/char_2009.gif) :
:![[thin space (1/6-em)]](https://www.rsc.org/images/entities/char_2009.gif) ethylene carbonate (EC) (1
ethylene carbonate (EC) (1![[thin space (1/6-em)]](https://www.rsc.org/images/entities/char_2009.gif) :
:![[thin space (1/6-em)]](https://www.rsc.org/images/entities/char_2009.gif) 1 v/v) (BASF) was used as an electrolyte. The half cells were tested using cyclic voltammetry on the potentiostat/galvanostat (Metrohm Autolab) between 0 to 3 V. The galvanostatic charge–discharge behaviour was tested on MTI battery analyzer (vs. Li/Li+). Electrochemical impedance spectroscopy (EIS) study was done in the frequency range 0.1 Hz to 1 MHz and amplitude 5 mV.
1 v/v) (BASF) was used as an electrolyte. The half cells were tested using cyclic voltammetry on the potentiostat/galvanostat (Metrohm Autolab) between 0 to 3 V. The galvanostatic charge–discharge behaviour was tested on MTI battery analyzer (vs. Li/Li+). Electrochemical impedance spectroscopy (EIS) study was done in the frequency range 0.1 Hz to 1 MHz and amplitude 5 mV.
3 Results and discussion
Fig. 1(a) shows the XRD patterns of the carbon nanofibers synthesized from polyacrylonitrile/melamine (PAN/Mel) at 800 °C. The broad peak around 2θ; 23.3° is an indication of presence of graphitic carbon, with disorder. The Raman spectroscopy is used to critically clarify the nature of carbon. Raman spectra for the carbon nanofibers synthesized from polyacrylonitrile/melamine (PAN/Mel) at 800 °C can be seen in Fig. 1(b). The characteristic D and G bands of carbon can be seen around 1320 cm−1 and 1590 cm−1 which can be assigned to the breathing mode of k-point phonons of A1g symmetry and E2g phonon of sp2 carbon atoms, respectively.24 The ID![[thin space (1/6-em)]](https://www.rsc.org/images/entities/char_2009.gif) :
:![[thin space (1/6-em)]](https://www.rsc.org/images/entities/char_2009.gif) IG ratio of CNF800, CNFM5 is 0.9564, 0.9353 respectively.
IG ratio of CNF800, CNFM5 is 0.9564, 0.9353 respectively.
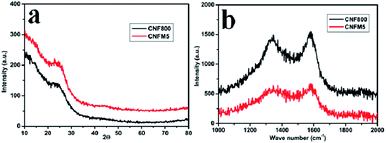 | ||
| Fig. 1 (a) XRD patterns of PAN/Mel carbon nanofibers without melamine (CNF800) and with 5% melamine (CNFM5), (b) Raman spectra of CNF800 and with 5% melamine (CNFM-5). | ||
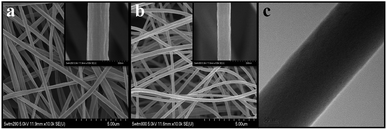
Fig. 2 shows typical scanning electron microscopy (SEM) images of the electrospun PAN/Mel carbon nanofibers with 5% of melamine after stabilization at 280 °C and carbonisation at 800 °C in nitrogen. The average diameter of the PAN/Mel carbon nanofibers with 5% melamine (Fig. 2(a)) is about 450 nm, after stabilisation at 280 °C these electrospun fibers have irregular edges and rough surface which can be seen in SEM images. After carbonisation at 800 °C in nitrogen (Fig. 2(b)), a decrease in diameter (300 nm) was observed. After carbonization the edges of the PAN/Mel fibers had become even and surface appeared smooth, which was also confirmed using transmission electron microscopy (TEM) analysis (Fig. 2(c)).
Fine XPS scanning on different element region, is shown in Fig. 3. The C1s region at PAN/Mel carbon nanofibers without melamine (CNF800) (Fig. 3(a)) and 5% melamine (CNFM5) (Fig. 3(b)) could be deconvoluted into three peaks by peak fitting (284.6 eV, 285.83 eV, 287.77 eV for CNF800 and 284.6 eV, 286.5 eV, 288.0 eV for CNFM5), which correspond to sp2 hybrid carbon (C–C), epoxy/hydroxyl (C–O) and sp2 bonded carbon in N–C![[double bond, length as m-dash]](https://www.rsc.org/images/entities/char_e001.gif) N group, respectively.25 Based on the XPS data, the oxygen containing functional groups are decreased by 51% while 44% increase in nitrogen containing functional groups can be observed due to addition of 5% melamine.
N group, respectively.25 Based on the XPS data, the oxygen containing functional groups are decreased by 51% while 44% increase in nitrogen containing functional groups can be observed due to addition of 5% melamine.
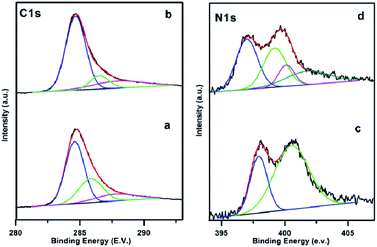 | ||
| Fig. 3 XPS patterns of the electrospun PAN/Mel carbon nanofibers (a and c) without (CNF800) and (b and d) with 5% melamine (CNFM5) respectively. | ||
The N1s curve of the CNF800 sample (Fig. 3(c)) consists of two peaks: 397.9 eV (C–N![[double bond, length as m-dash]](https://www.rsc.org/images/entities/char_e001.gif) C) and 400.5 eV (N–H).26 Compared with pristine CNF800, the CNFM5 also shows (Fig. 3(d)) two peaks at 398.04 eV and 400.2 eV along with two more peaks at 401.1 eV (quaternary nitrogen) and 402.80 eV (NO, oxidised nitrogen) which justifies the overall increase (56%) in amount of nitrogen which can be attributed to addition of 5% melamine during synthesis.
C) and 400.5 eV (N–H).26 Compared with pristine CNF800, the CNFM5 also shows (Fig. 3(d)) two peaks at 398.04 eV and 400.2 eV along with two more peaks at 401.1 eV (quaternary nitrogen) and 402.80 eV (NO, oxidised nitrogen) which justifies the overall increase (56%) in amount of nitrogen which can be attributed to addition of 5% melamine during synthesis.
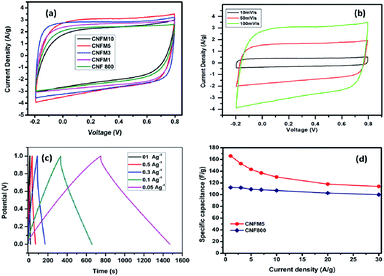
The electrochemical properties in the context of supercapacitor application of the carbon nanofibers synthesized from polyacrylonitrile/melamine (PAN/Mel) with 1 to 10% melamine have been investigated in two-electrode systems (Fig. 4(a)). Considering the ideal-like CV of the sample having 5% melamine (CNFM5), it has been studied in detail. Further, the specific capacitance of each electrode was calculated using following equation; Cg = 4(I × Δt)/(m × ΔV), where, I is the discharge current, Δt is the discharge time, ΔV is the voltage change compared to the initial voltage, m is the total weight of the electrodes.
Fig. 4(b) shows the cyclic voltammograms obtained for the CNFM5 in 6 M KOH as electrolyte at various scan rates such as 10 mV s−1, 50 mV s−1 and 100 mV s−1. Loops of quasy-rectangular shape are seen without any oxidation or reduction peaks. This indicates formation of a perfect electrical double layer due to the elevated specific surface area of the material.27
At different current densities ranging from 1 to 30 A g−1, the calculated specific capacitance values are shown in also given in Table 1. A highest specific capacitance value of 166 F g−1 is obtained for CNFM5 sample at a current density of 1A g−1 which shows 48% increase as compared to carbon nanofibers without melamine (CNF800). The specific capacitance decreases with increasing current density. This takes place on electrode surface due to the partial diffusion of the active ions during fast charging. At elevated current density the electrolyte cannot access all the micro pores on the electrode surface hence, the relative capacitance decreases.
| Current density | Specific capacitance, F g−1 | |
|---|---|---|
| CNF800 | CNFM5 | |
| 1 | 112 | 166 |
| 3 | 112 | 153 |
| 5 | 109 | 143 |
| 7 | 108 | 137 |
| 10 | 107 | 130 |
| 20 | 103 | 118 |
| 30 | 100 | 114 |
The higher capacitance observed in CNFM5 sample as the amount of nitrogen containing functional moieties are highly active in basic medium such as KOH. It is well known that the nitrogen containing functional groups do not show much activity in solutions of lower pH. Hence, it approves the choice of the electrolyte. From XPS data (Fig. 3(d)), we can further calculate the different nitrogen contributions by deconvolution of the N1s peak. The amount of C–N![[double bond, length as m-dash]](https://www.rsc.org/images/entities/char_e001.gif) C and N–H type of nitrogen present at the edges of graphitic layers is 37% and 30% respectively. While the quaternary nitrogen present inside the graphitic layer and oxidised nitrogen is 15% and 16% respectively. Both these, C–N
C and N–H type of nitrogen present at the edges of graphitic layers is 37% and 30% respectively. While the quaternary nitrogen present inside the graphitic layer and oxidised nitrogen is 15% and 16% respectively. Both these, C–N![[double bond, length as m-dash]](https://www.rsc.org/images/entities/char_e001.gif) C and N–H type of nitrogen present in an ample amount (67%) contribute to pseudo-capacitive behavior. This justifies the increase in capacitance observed in CNFM5 sample due to addition of melamine which contributes in this increase in N containing functional groups than that of CNF800. CNF800 can acquire N containing functional groups only from PAN while CNFM5 can get it from both PAN and melamine added during synthesis.
C and N–H type of nitrogen present in an ample amount (67%) contribute to pseudo-capacitive behavior. This justifies the increase in capacitance observed in CNFM5 sample due to addition of melamine which contributes in this increase in N containing functional groups than that of CNF800. CNF800 can acquire N containing functional groups only from PAN while CNFM5 can get it from both PAN and melamine added during synthesis.
Fig. 5(a) shows the Nyquist plots of CNF800 and CNFM5 for two-electrode capacitors in KOH electrolyte. A 45° straight line at low frequency region corresponds to the Warburg impedance (W), that can be linked to the kinetic leakage processes associated with faradaic reactions during diffusion. This region is expanded for the CNFM5 sample than CNF800 which confirms a boost in the pseudo-capacitive input. The straight line nature of the W region in the Nyquist plot signifies the complete wettability of porous electrode surface by electrolyte ions.27 EIS measurement signifies that the porous structure of the PAN/MEL fiber carbon electrode helps in quicker diffusion of electrolyte ions with decreased ionic resistance leading to almost ideal capacitive performance.
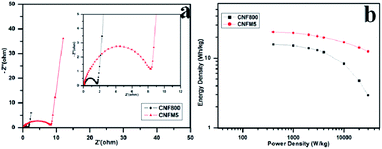 | ||
| Fig. 5 (a) Nyquist plot in the range of 10 mHz to 100 kHz, (b) Ragone plot in KOH electrolyte of CNF800, CNFM5. | ||
Fig. 5(b) shows Ragone plot which can be used for further analysis of the performance of PAN/MEL carbon fibers. It is generally observed that as power density increases the energy density decreases.28–32 In case of CNFM5 no significant decrease is observed in energy density with increasing power density unlike CNF800. This higher value of stability is due to conductivity and surface texture of the PAN/MEL carbon fibers. The micro porous structure supports the easy migration of ions to the active surface which makes the transfer of charge smoother.33
No fading in capacitance can be seen even after 3000 cycles at a high current density of 1 A g−1 (Fig. 6). This excellent capacity retention and high energy density obtained for CNFM5 further encouraged us to check its applicability as electrode material for Li-ion battery.
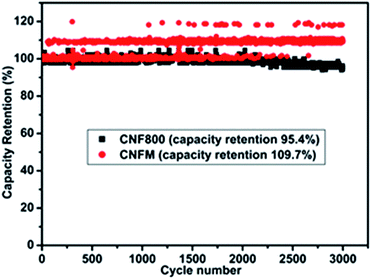 | ||
| Fig. 6 Percentage retention of capacitance measured at 1 A g−1 current density of CNF800 and CNFM5 sample in 6 M KOH electrolyte. | ||
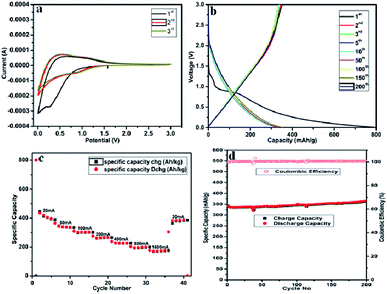
The self-standing, flexible carbon fibre tape of CNFM5 was used as working electrode in Li-ion battery (2032-type coin cell) and its electrochemical performance was studied. Fig. 7(a) shows the CV curves of CNFM5 electrode at first three cycles. The electrochemical reaction kinetics of Li-ion insertion and de-insertion can be studied from the shape of the curves obtained. In the first cycle, a small oxidation peak can be seen at ∼0.5 V due to the insertion of Li-ion into pores between carbon nanofibre network.34 The irreversible reduction peak can be seen at ∼0.3 V due to decomposition of electrolyte. The reduction peak due to formation of a solid electrolyte interface (SEI) layer can be seen at ∼0.3 V of 2nd cycle.35 The shapes of CV curves obtained at 2nd and 3rd cycles are almost coincidental which confirms the CNFM5 electrode demonstrates a stable Li-ion insertion and de-insertion mechanism.
Fig. 7(b) shows the charge–discharge curves of the self-standing, flexible carbon fibre tape of CNFM-5 for the 1st, 2nd, 3rd, 5th, 10th, 50th, 100th, 150th, 200th cycles at current density 100 mA g−1 within potential window of 0.01–3.0 V. The first discharge curve show a sharp decrease followed by a plateau around 0.8 V, which is mainly due to rapid generation of SEI layer due to decomposition of electrolyte. CNFM5 shows a superior initial discharge capacity of 800 mA h g−1 which is attributed to the surface microstructure and graphitic upper surface layer which gives ease of insertion and de-insertion to Li+ ion.36 The sloping capacity can be due to lowering of interlayer spacing and the interactions between lithium and heteroatoms. The elevated irreversible capacity between first discharge and charge may be due to the fast generation of SEI film. No noticeable plateau is observed for further cycles which indicate that the sites of Li+-ions into the CNFM5 are electronically as well as geometrically discrete.37,38 Similar behaviour is observed in other CNFs synthesiszed by electrospinning using other starting materials.39,40 The electrode made from self-standing, flexible carbon fibre tape of CNFM5 shows 365 mA h g−1 after 200 cycles which confirms stable Li-ion insertion/de-insertion mechanism which leads to excellent repeatability.
Fig. 7(c) shows, the comparison of rate performance of CNFM5 electrode at different current densities from 20 to 1800 mA g−1 (Table 2). When the current density revisits 20 mA g−1, the specific capacity observed as 387.32 mA h g−1 with stable cycling. Fig. 7(d) shows, the long cycling performance of CNFM5 investigated at current density 100 mA g−1. It is clearly seen that the CNFM5 electrode maintains a stable discharge capacity of 365 mA h g−1 after 200 cycles. For the first 10 cycles a small decrease in the initial capacity of CNFM5 electrode can be observed, which is due to SEI layer formation. But after 10 cycles the capacity increases with nearly 100% coulombic efficiency. This remarkable increase in capacitance may be due to the additional specific capacity provided by a viscous layer formed on the surface of the CNFM5 electrode or a fresh SEI layer grown over uneven texture of the original one.41,42
| Current density, mA g−1 | Specific capacity of CNFM5, mA h g−1 |
|---|---|
| 20 | 435.47 |
| 50 | 364.53 |
| 100 | 310.59 |
| 200 | 275.24 |
| 400 | 265.77 |
| 800 | 203.01 |
| 1600 | 176.82 |
| 20 | 387.32 |
Fig. S1† shows the cyclic performance of pristine carbon nanofibre, which shows initial discharge capacity around 292 mA h g−1 at a current rate of 100 mA g−1, which reduces to 285 at the end of 20th cycle. Herein, there is a drop in capacity with cycling. However, nitrogen doped carbon fibre sample CNFM5 shows increase in capacity with cycling as discussed above.
Fig. 8 shows the Nyquist plots obtained by electrochemical impedance spectrometry of CNFM5 electrode after 200 cycles in charged and discharged states of the cell. It is observed to possess a composition of two depressed semicircles in high frequency region (shown in inset for clarity) followed by a polarization curve in lower frequency side. The obtained plots were fitted to the equivalent circuit given in inset. Here, Rs is the ohmic internal resistance of the cell. Cf and Rf are the capacitance and resistance of the passive film forming at the lithium anode and Cdl represents the double layer capacitance. In this model, the Cdl and CPE are combined into one CPE, labeled as Cdl. Rct is the charge transfer resistance and Wc is a diffusional impedance.43 The simulated data is shown as continuous lines overlayed with the original impedance data in Fig. 8. Also, values of fitting parameters of the equivalent circuit are given in Table 3. It may be noted that there is not much significant variation in cell resistance, while a significant difference in passivation film resistance and charge transfer resistance are encountered. The Warburg coefficient is found to be almost doubled indicating a resistance to diffusion of Li+ ions after discharge.
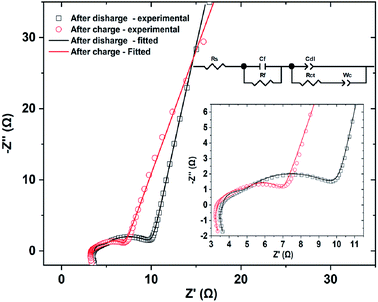 | ||
| Fig. 8 Nyquist plots obtained by electrochemical impedance spectrometry of CNFM5 electrode after 200 cycles in charged and discharged states of the cell and equivalent circuit. | ||
| Element | Value after charge | Value after discharge |
|---|---|---|
| Rs (Ω) | 3.64 | 3.36 |
| Rf (Ω) | 0.76 | 2.05 |
| Rct (Ω) | 6.05 | 1.65 |
| Wc (Ω−1 s−1) | 28.66 | 52.24 |
To find out the reason behind the excellent cycling performance of CNFM5 electrode and verify the morphological changes in the structure after 200 cycles, we disassemble the cell to carry out its FE-SEM imaging. Fig. 9(a–c) shows the FE-SEM images of CNFM5 electrode after 200 cycles at current density of 100 mA g−1. When compared to previous images (Fig. 2(b)) it can be observed that there is not much change in shape, size and fibrous geometry which indicates the structural stability of CNFM5 sample. The surface of the fibres appears slightly rough due to the SEI layer which acts as a protective film to improve the performance of electrode but other than that no cracks or fractures were observed. Stable electrochemical performance of CNFM5 confirms its superior potential for Li-ion battery application. In both the energy devices, we found that nitrogen-doped carbon fibres showed excellent electrochemical performance as compared to their bare carbon nanofibres. It is reported that, incorporation of nitrogen in carbon accelerates the surface-dominated charge-storage.44 Generally, any doping in the pristine material creates defects and same phenomenon is happening N-doped carbon, which increases the number of active sites for Li+ storage. A stronger interaction between ions occurs due to higher electronegativity possessed by N-doping in carbon.45,46 Recently, Chen et al. have reported that N-doped hard carbon microspheres exhibited high-rate capability due to surface-driven charge storage for potassium ion batteries.47 Also, N-doping influences the fast ion transport to the surface. The different nitrogen percent incorporation shows change in morphology as well as capacitance and specific capacity for Li-ion battery application. However, moderate nitrogen incorporation gives good electrochemical performance. It indicates that adequate N-doping induces desired surface modification of the carbon, i.e. nitrogen doping modifies the surface of the material which includes vacancy defects, as well as morphology which helps in achieving higher electronegativity for increased interaction between ions as discussed above.
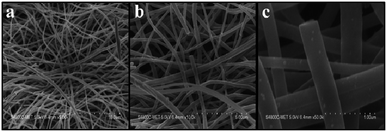 | ||
| Fig. 9 FE-SEM images of CNFM5 electrode after 200 galvanostatic charge–discharge cycles at a current density of 100 mA g−1. | ||
4 Conclusions
In summary, novel PAN-based nitrogen enriched carbon fibers were synthesized by electrospinning with addition of various concentrations of melamine. The obtained PAN-MEL fibers with 5% melamine stabilised at 280 °C and carbonized at 800 °C in nitrogen atmosphere showed excellent electrochemical performance with a specific capacitance of up to 166 F g−1 at current density 1 A g−1 using 6 M KOH electrolyte and capacity retention of 109.7% after 3000 cycles. This increase in capacitance observed in CNFM5 sample was found due to addition of melamine which contributes in increase in ‘N’ containing functional groups than that of CNF800. Two electrode systems of CNFM5 sample showed high energy densities of 23.72 to 12.50 W h kg−1 and power densities from 400 to 30![[thin space (1/6-em)]](https://www.rsc.org/images/entities/char_2009.gif) 000 W kg−1. CNFM5 sample used as an anode for Li-ion battery application showed a high specific capacity up to 435.47 mA h g−1 at 20 mA g−1, good rate capacity and excellent cycling performance (365 mA h g−1 specific capacity even after 200 cycles at 100 mA g−1).
000 W kg−1. CNFM5 sample used as an anode for Li-ion battery application showed a high specific capacity up to 435.47 mA h g−1 at 20 mA g−1, good rate capacity and excellent cycling performance (365 mA h g−1 specific capacity even after 200 cycles at 100 mA g−1).
Conflicts of interest
There are no conflicts to declare.Acknowledgements
The authors would like to thank Director General, C-MET for encouragement and Nanocrystalline Materials Group C-MET, Pune for support. BBK would like to thank Ministry of Electronics and Information Technology for support.References
- M. R. Palacin, Chem. Soc. Rev., 2009, 38, 2565 RSC.
- J. A. Lee, M. K. Shin, S. H. Kim, H. U. Cho, G. M. Spinks, G. G. Wallace, M. D. Lima, X. Lepro, M. E. Kozlov, R. H. Baughman and S. J. Kim, Nat. Commun., 2013, 4, 1970 CrossRef.
- M. F. El-Kady, V. Strong, S. Dubin and R. B. Kaner, Science, 2012, 335, 1326 CrossRef CAS.
- Y. R. Li, K. X. Sheng, W. J. Yuan and G. Q. Shi, Chem. Commun., 2013, 49, 291 RSC.
- J. B. Goodenough and K. S. Park, J. Am. Chem. Soc., 2013, 135, 1167 CrossRef CAS.
- V. Etacheri, R. Marom, R. Elazari, G. Salitra and D. Aurbach, Energy Environ. Sci., 2011, 4, 3243 RSC.
- S. Bose, T. Kuila, A. K. Mishra, R. Rajasekar, N. H. Kim and J. H. Lee, J. Mater. Chem., 2012, 22, 767 RSC.
- B. W. Ricketts and C. Ton-That, J. Power Sources, 2000, 89, 64 CrossRef CAS.
- M. Jayalakshmi and K. Balasubramanian, Int. J. Electrochem. Sci., 2008, 3, 1196 CAS.
- (a) Y. Zhai, Y. Dou, D. Zhao, P. F. Fulvio, R. T. Mayes and S. Dai, Adv. Mater., 2011, 23, 4828 CrossRef CAS; (b) F. Yang, H. Gao, J. Hao, S. Zhang, P. Li, Y. Liu, J. Chen and Z. Guo, Adv. Funct. Mater., 2019, 29, 1808291 CrossRef; (c) S. Hu, Y. Li, Y. Chen, J. Peng, T. Zhou, W. K. Pang, C. Didier, V. K. Peterson, H. Wang, Q. Li and Z. Guo, Adv. Energy Mater., 2019, 9, 1901795 CrossRef; (d) S. Zhang, Y. Zheng, X. Huang, J. Hong, B. Cao, J. Hao, Q. Fan, T. Zhou and Z. Guo, Adv. Energy Mater., 2019, 9, 1900081 CrossRef.
- S. W. Lee, N. Yabuuchi, B. M. Gallant, S. Chen, B. S. Kim, Y. Hammond and Y. Shao-horn, Nat. Nanotechnol., 2010, 210, 531 CrossRef.
- J. Wang, H. Liu, H. Sun, W. Hua, H. Wang, X. Liu and B. Wei, Carbon, 2018, 127, 85 CrossRef CAS.
- D. H. Reneker and I. Chun, Nanotechnology, 1996, 7, 216 CrossRef CAS.
- E. Smit, U. Buttner and R. D. Sanderson, Polymer, 2005, 46, 2419 CrossRef CAS.
- D. Yang, B. Lu, Y. Zhao and X. Jiang, Adv. Mater., 2007, 19, 3702 CrossRef CAS.
- E. J. Ra, K. H. An, K. K. Kim, S. Y. Jeong and Y. H. Lee, Chem. Phys. Lett., 2005, 413, 188 CrossRef CAS.
- S. Arumuganathar and S. N. Jayasinghe, ACS Nano, 2007, 2, 213 CAS.
- C. Kim, B. T. N. Ngoc, K. S. Yang, M. Kojima, Y. A. Kim and Y. J. Kim, Adv. Mater., 2007, 19, 2341 CrossRef CAS.
- C. Kim and K. S. Yang, Appl. Phys. Lett., 2003, 83, 1216–1218 CrossRef CAS.
- Z. Ryu, H. Rong, J. Zheng, M. Wang and B. Zhang, Carbon, 2002, 40, 1131 CrossRef.
- T. H. Ko, P. Chiranairadul, C. Lu and C. Lin, Carbon, 1992, 30, 647 CrossRef CAS.
- T. H. Ko, W. S. Kuo and C. H. Hu, J. Polym. Sci., 2001, 81, 1090 CAS.
- E. J. Ra, K. H. An, K. K. Kim, S. Y. Jeong and Y. H. Lee, Chem. Phys. Lett., 2005, 413, 188 CrossRef CAS.
- D. Mhamane, W. Ramadan, M. Fawzy, A. Rana, M. Dubey, C. Rode, B. Lefez, B. Hannoyerd and S. Ogale, Green Chem., 2011, 13, 1990 RSC.
- S. Martha, A. Nashim and K. M. Parida, J. Mater. Chem. A, 2013, 1, 7816 RSC.
- Y. Li, H. Zhang, P. Liu, D. Wang, Y. Li and H. Zhao, Small, 2013, 9, 3336 CAS.
- M. Biswal, A. Banerjee, M. Deo and S. Ogale, Energy Environ. Sci., 2013, 6, 1249 RSC.
- T. E. Rufford, D. Hulicova-Jurcakova, K. Khosla, Z. Zhu and G. Q. Lu, J. Power Sources, 2010, 195, 912–918 CrossRef CAS.
- T. E. Rufford, D. Hulicova-Jurcakova, Z. Zhu and G. Q. Lu, Electrochem. Commun., 2008, 10, 1594 CrossRef CAS.
- X. Zhao, C. Johnston and P. S. Grant, J. Mater. Chem., 2009, 19, 8755 RSC.
- E. J. Ra, E. Raymundo-Pinero, Y. H. Lee and F. Beguin, Carbon, 2009, 47, 2984 CrossRef CAS.
- S. Yang, K. Chang, H. Tien, Y. Lee, S. Li, Y. Wang, J. Wang, C. M. Ma and C. Hu, J. Mater. Chem., 2011, 21, 2374 RSC.
- E. Frackowiak and F. Beguin, Carbon, 2001, 39, 937 CrossRef CAS.
- Y. Cao, L. Xiao, M. L. Sushko, W. Wang, B. Schwenzer, J. Xiao, Z. Nie, L. V. Laxmikant, Z. Yang and J. Liu, Nano Lett., 2012, 12, 3783 CrossRef CAS.
- R. Alcantara, P. Lavela, G. F. Ortiz and J. L. Tirado, Electrochem. Solid-State Lett., 2005, 8, A222 CrossRef CAS.
- J. Ding, H. Wang, Z. Li, A. Kohandehghan, K. Cui, Z. Xu, B. Zahiri, X. Tan, E. M. Lotfabad, B. C. Olsen and D. Mitlin, ACS Nano, 2013, 7, 11004 CrossRef CAS.
- J. Hu, H. Li and X. Huang, Solid State Ionics, 2007, 178, 265 CrossRef CAS.
- A. D. Roberts, X. Li and H. Zhang, Chem. Soc. Rev., 2014, 43, 4341 RSC.
- V. Subramanian, H. Zhu and B. Wei, J. Phys. Chem. B, 2006, 110, 7178 CrossRef CAS.
- J. F. Snyder, E. L. Wong and C. W. Hubbard, J. Electrochem. Soc., 2009, 156, A215 CrossRef CAS.
- V. A. Agubra, L. Zuniga, D. Flores, J. Villareal and M. Alcoutlabi, Electrochim. Acta, 2016, 192, 529 CrossRef CAS.
- H. Fei, Z. Peng, L. Li, Y. Yang, W. Lu, E. L. Samuel, X. Fan and J. M. Tour, Nano Res., 2014, 7, 502 CrossRef CAS.
- S. R. Narayanan, D. H. Shen, S. Surampudi, A. I. Attia and G. Halpert, J. Electrochem. Soc., 1993, 140, 1854 CrossRef CAS.
- Y. Xu, C. Zhang, M. Zhou, Q. Fu, C. Zhao, M. Wu and Y. Lei, Nat. Commun., 2018, 9, 1720 CrossRef.
- H. Wang, C. Zhang, Z. Liu, L. Wang, P. Han, H. Xu, K. Zhang, S. Dong, J. Yao and G. Cui, J. Mater. Chem., 2011, 21, 5430–5434 RSC.
- F. Zheng, Y. Yang and Q. Chen, Nat. Commun., 2014, 5, 5261 CrossRef CAS.
- C. Chen, Z. Wang, B. Zhang, L. Miao, J. Cai, L. Peng, Y. Huang, J. Jiang, Y. Huang, L. Zhang and J. Xie, Energy Storage Mater, 2017, 8, 161–168 CrossRef.
Footnote |
| † Electronic supplementary information (ESI) available: Fig. S1: cycles of pristine carbon nanofibres. See DOI: 10.1039/c9ra05780c |
| This journal is © The Royal Society of Chemistry 2019 |

