 Open Access Article
Synthesis of 3D flower-like structured Gd/TiO2@rGO nanocomposites via a hydrothermal method with enhanced visible-light photocatalytic activity
Shuaiqiang
Jia
 a,
Jinlong
Li
 *ab,
Guozhe
Sui
*ab,
Lijuan
Du
a,
Yulin
Zhang
a,
Yan
Zhuang
a and
Boxin
Li
a
*ab,
Guozhe
Sui
*ab,
Lijuan
Du
a,
Yulin
Zhang
a,
Yan
Zhuang
a and
Boxin
Li
a
aCollege of Chemistry and Chemical Engineering, Qiqihar University, Qiqihar 161006, China. E-mail: jinlong141@163.com; suiguozhe@163.com; Fax: +86-452-2738205; Tel: +86-452-2738205
bHeilongjiang Provincial Key Laboratory of Catalytic Synthesis for Fine Chemicals, Qiqihar 161006, China
First published on 1st October 2019
Abstract
In this study, novel Gd/TiO2@rGO (GTR) nanocomposites with high photocatalytic performance were fabricated via a one-pot solvothermal approach. During the preparation step, graphene oxide (GO) was reduced to reduced graphene oxide (rGO), and subsequently, on the surfaces of which anatase TiO2 doped with Gd metal was grown in situ with a 3D petal-like structure. Gd doping into the classical TiO2@rGO system efficiently expands the absorption range of light, improves the separation of photogenerated electrons, and increases the photocatalytic reaction sites. The specific surface areas, morphological structures, and valence and conduction bands of the obtained GTR nanocomposites were analyzed and correlated with their enhanced photocatalytic performances for the degradation of an aqueous RhB solution. The experimental results indicated that the best performance was achieved with the 3% GTR composite, which exhibited the highest photoelectrocatalytic activity because of two aspects: the rapid separation of electrons and holes, and improvement in adsorption capacity. As compared with pure TiO2, the GTR composites demonstrated enhanced photoactivity due to synergetic effects between the effective photo-induced electron transfer from TiO2 to the surface of the rGO acceptor through interfacial interactions and the variation of structure and electrons under the adoption of Gd.
1. Introduction
In recent years, photocatalysis technology using semiconductors has drawn significant attention from researchers because it is one of the most effective ones for the decomposition of pollutants present in aqueous media.1,2 Among various semiconductors, TiO2 has been considered one of the most representative photocatalysts owing to its strong oxidizing power,3 photostability,4 and relative non-toxicity.5 Nevertheless, anatase TiO2 possesses a wide band gap energy (∼3.2 eV) that limits its utilization of natural sunlight and photoactivity under UV light (<387 nm) due to fast electron–hole recombination. UV radiation comprises around 3 to 5% of the sunlight at Earth's surface.6,7 Thus, researchers are focusing on extending the absorption spectrum of TiO2 from UV to the visible-light region to exploit the visible light occupying 42–43% of sunlight.8,9 Recently, researchers have modified TiO2 with carbon-containing materials such as carbon nanotubes,10–13 graphitic carbon nitride (g-C3N4),14–17 and graphene,18–21 which have high carrier mobilities and large specific surface areas; this strategy is considered as an effective way to further strengthen the photocatalytic activities of TiO2 catalysts.Compared with other carbon materials, graphene is a crystalline allotrope of carbon with a two-dimensional structure,22,23 and is both the thinnest and the strongest material measured so far in the world.24,25 Graphene can be used in many applications such as new energy materials, energy conversion, and tissue engineering. Owing to its high electron mobility,26 lower resistivity,27 extended π–π conjugation structure,28 and faster electron transfer ratio,29,30 graphene has attracted increasing attention recently. Because of this, graphene can be easily combined with nanostructured materials to form some semiconductor-supported compounds.31 Therefore, several methods have been used to combine TiO2 and graphene to improve the photodegradation efficiency of TiO2, including hydrothermal, physical mixing, sol–gel, and electrochemical deposition.32 A large number of TiO2/graphene composites with different structure have been designed and prepared to improve the photocatalytic activity of TiO2; the combination of graphene with TiO2 not only reduces the electron–hole recombination by transferring the photoexcited electron to the graphene surface, but also enlarges the absorption band of pure TiO2 to the visible region and enhances the surface area of TiO2.33–35
Additionally, to enhance the photocatalytic activity of TiO2, many researchers have focused on metal-loaded TiO2 materials to expand to visible-light-response region via the induction of impurity levels. Liu et al.36 synthesized a small particle size of Ga–TiO2 composite powders with high specific surface area by a mild hydrothermal method; the synthesized photocatalyst exhibits better photocatalytic activity than that of commercial P25 TiO2 or undoped TiO2. Chen et al.37 investigated the higher photoactivity of a TiO2/diatomite with co-doped Ce/N granule than that of a single N-doped granule through the sol–gel way by evaluating the degradation efficiency of oxytetracycline under visible-light illumination. Muhammad et al.38 prepared Gd/SnO2–TiO2 nanoparticles by using ultrasonic and hydrothermal methods, and investigated the effect of Gd concentration on band gap, which revealed a red shift from 5.3 to 2.0 eV for Gd/SnO2–TiO2. All these methods provide notable improvements in the photocatalytic property of TiO2. However, there is no report on the investigation of Gd-loaded TiO2 on rGO (Gd/TiO2@rGO; GTR) photocatalysts.
In this work, we selected graphene as the support material to enhance the synergistic effect between TiO2 and Gd, and synthesized GTR photocatalysts via a convenient and fast one-pot method for synthesizing photocatalytic materials. Graphene was used not only to improve the adsorbability of organic contaminants, but also to induce a positive relationship between Gd and Ti species. In order to investigate the photocatalytic activities of the as-synthesized GTR composites, the photodegradation of Rhodamine B (RhB) was performed in aqueous solution. And the reusability of GTR composites was also examined in this work.
2. Experimental
2.1 Reagents
Graphite powder (purity > 99.9%), sulfuric acid (H2SO4, 98.0 wt%), potassium permanganate (KMnO4), hydrogen peroxide (H2O2, 30.0 wt%), sodium nitrate (NaNO3), hydrochloric acid (HCl, 36.5 wt%), hydrofluoric acid (HF, 40 wt%), and absolute ethanol (CH3CH2OH) were analytical-grade reagents. Tetrabutyl titanate (TBT, C16H36O4Ti, 98.0%) was used as a titanium precursor to synthesize the TiO2 nanocrystals. Rhodamine B (RhB, C28H31N2O3Cl) was selected to evaluate the photocatalytic degradation efficiency of dyestuff. All the above chemicals were obtained from Tianjin Kemiou Chemical Reagent Co. (Tianjin, China). Gadolinium(III) nitrate hexahydrate (GdN3O9·6H2O, 99.0%) was purchased form Aladdin Chemistry Co. Ltd. The used deionized (DI) water in all experiments was generated from a UPE-60 water purification system (Beijing Sanda Technology Co., Ltd). All reagents were used without further purification.2.2 Synthesis of GO
GO was prepared through the modified Hummers' method. In a typical synthesis, 2 g of graphite powder and 1.0 g of NaNO3 were poured into a round-bottom flask and 46 mL of concentrated H2SO4 was slowly added to it. The mixture was kept stirring for 1 h with magnetic stirrers. Subsequently, 6.0 g KMnO4 was slowly added to the mixture and stirred for 2 h for uniform stir. During the above synthetic processing, an ice bath apparatus was used to prevent temperature from exceeding 10 °C. Thereafter, the reaction temperature was adjusted to 35 °C and continuously stirred for another 0.5 h. Then, 160 mL of distilled water was carefully added and the resulting mixture was stirred at 98 °C for 0.5 h. During the reaction, the color of the mixture changed from snuff color to bright yellow. Afterward, 30 mL H2O2 was slowly fed into the mixture with stirring for 0.5 h, during which plenty of bubbles evolved. The resulting bright yellow mixture was centrifuged, and the precipitate was washed with a 5% HCl aqueous solution until no metal ions remained and then washed thoroughly with deionized water to neutral pH. The obtained GO mud was dried in a vacuum oven at 60 °C.2.3 Synthesis of Gd/TiO2@rGO
GTR was synthesized through an efficient one-step solvothermal route. A solution of GO nanosheets was obtained after that 0.1 g of GO was dissolved in 30 mL of isopropyl alcohol by sonication for 30 min. Then, the mixture added by 1 mL of TBT was sonicated for another 30 min to form a homogeneous solution. Next, 0.5 mL of HF (40 wt%) was dropped into the solution under continuous stirring. Meanwhile, 1.8 mL of a Gd(NO3)3 aqueous solution (0.5 mol L−1) was dispersed into the above solution and magnetically stirred for 20 min to ensure uniform distribution. Finally, the mixed solution was put into a Teflon-lined stainless steel autoclave and then treated at 180 °C for 10 h. At the end of this process, the obtained product from the autoclave was washed with deionized water and absolute ethanol several times, and dried in a vacuum oven at 60 °C for 24 h. A series of GTR composites was synthesized by varying the volumes of Gd(NO3)3 and TiO2. For comparison, TiO2@rGO nanosheets were prepared without Gd by the above mentioned solvothermal method.2.4 Characterization
Scanning electron microscopy (SEM) images were taken with a Hitachi S-3400 system (Tokyo, Japan) operated at 100 kV, and transmission electron microscopy (TEM) images were taken with a Hitachi system (Tokyo, Japan) operated at 200 kV. X-ray diffraction (XRD) analysis was performed on a Bruker D8 system (Germany) to determine the crystal structure and the phase compositions of the samples equipped with Cu Kα radiation under 40 kV and 30 mA. And the patterns were recorded in the range of 2θ = 10–80° with a speed of 4.00° min−1. UV-visible diffused reflectance spectra were obtained for the dry-pressed disk samples using a UV-visible spectrophotometer (Du800, Beckman Co.) with BaSO4 as a reflectance standard. The Brunauer–Emmett–Teller (BET) analysis were carried out to determine the specific surface areas of the samples using a N2 adsorption–desorption apparatus (Nova 2000e, Quantachrome Co.) with the relative pressure ranging from 0.05–0.35, and the samples were previously degassed at 300 °C for 3 h under vacuum. The Barrett–Joyner–Halenda (BJH) approach was used to determine the pore size distribution of the photocatalysts. Fourier transform infrared (FT-IR) spectra were measured to determine the functional groups with a Nexus 670 (Nicolet Co.) FT-IR spectrophotometer using the KBr pellet technique. X-ray photoelectron spectroscopy (XPS) was performed on an Axis Ultra DLD (Krotos Co., UK). The photoelectron take-off angle was kept at 45°, and the binding energy was carefully referring to the C 1s peak by setting at 285.0 eV.2.5 Evaluation of photocatalytic activity
RhB as one of the most important representative organic dyestuff has been well applied in industrial production, which serioursly contaminates the surrounding environment. Hence, we chose it as a representative pollutant to evaluate the photocatalytic activities of the GTR composites by photo-degradation of an aqueous solution of RhB dye under visible-light illumination. A 500 W Xe lamp was employed as the light source, and the visible wavelength was adjusted using a UV-cut filter (420 nm). The experiments were performed with 50 mg of the porous TiO2 photocatalyst and a solution of RhB (50 mL; 10 mg L−1) in a tube reactor. The suspension of the RhB solution and photocatalyst was magnetically stirred in the dark for 60 min to ensure establish an adsorption/desorption equilibrium before irradiation. Then, visible light was directed towards the suspension. Aliquots of samples were withdrawn from the suspension at regular time intervals (30 min) and centrifuged to separate the catalyst powder using a high-speed rotation of centrifuge rotor (RG-TGL-16C, Ruijiang Co.). The absorbance of collected filtrate was measured to calculate the RhB degradation efficiency by UV-vis spectrophotometry (SP 1900, Shanghai Spectrum Instruments Co.) using the representative peak of RhB at 552.0 nm.2.6 Recycling test
After each photocatalytic experiment, the synthesized GTR composites were recycled by repeated centrifuging and washing with ethanol. The recycled GTR composites were used as photocatalysts to degrade RhB (10 mg L−1) solution under visible-light illumination, respectively. In this recycling test, the reusability of 3% GTR composite was investigated by repeating the experiment five times.3. Results and discussion
3.1 Characterization
The TEM and SEM images clearly show the morphology, structure and size of the as-synthesized composites (Fig. 1). The TEM image of GO shown in Fig. 1(a) clearly illustrates the typical flake-like shapes of GO with wrinkles, which is attributed to the thin and large sheets of GO. Here, the 3% GTR sample was chosen as a representative composite as it demonstrated the best photocatalytic performance toward RhB photodegradation. As seen from the TEM image in Fig. 1(b), well-dispersed Gd/TiO2 nanoparticles are wrapped tightly onto the surface of rGO sheets. This implies that TiO2 nanoparticles were successfully deposited onto the GO surface by the hydrothermal method, resulting in the formation of large GTR composites. The diameters of the TiO2 nanoparticles deposited onto the GO surface ranged from 150 to 250 nm. All the precursors exhibited very similar and uniform spherical morphologies. Fig. 1(d) shows that the morphology of TiO2 nanoparticles is petaloid ambulacra, and many TiO2 nanosheets assemble into a 3D petalage-like structure.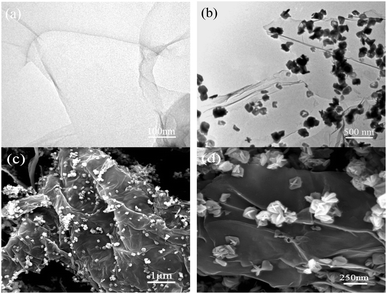 | ||
| Fig. 1 TEM images of (a) GO nanosheets and (b) 3% GTR sample. (c) and (d) SEM images of 3% GTR composite. | ||
The elemental maps of C, Ti, and Gd in the 3% GTR sample are shown in Fig. 2(b–d), respectively. It is observed that massive C and Ti nanoparticles are dispersed uniformly among the rGO sheets in the composite. Besides, a small amount of Gd nanoparticles can be observed in Fig. 2(d). The small amount of Gd nanoparticles plays an important role in the photocatalytic performance of the GTR, which will be discussed in a later section.
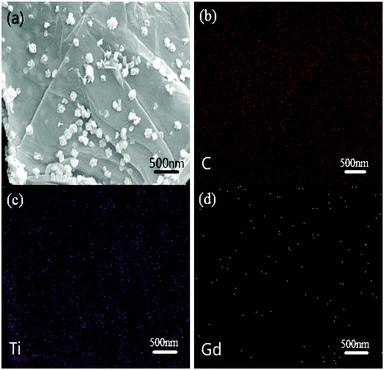 | ||
| Fig. 2 Elemental maps of (b) C atoms, (c) Ti atoms, and (d) Gd atoms in the same area of 3% GTR composite shown in (a). | ||
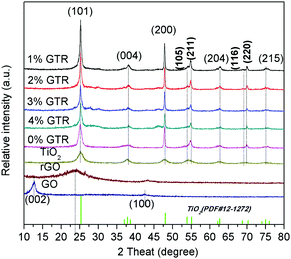
The XRD profiles of GO, pure TiO2, and GTR composites containing different amounts of Gd are shown in Fig. 3. The peak at 12.6° in the profile of the GO sample corresponds to the (002) crystal plane, indicating that graphite has considerably oxidized into GO. After the solvothermal treatment, this strong characteristic diffraction peak of GO almost disappeared but only a weak diffraction peak appeared at 24.0°, suggesting that most of GO was reduced, which is a clear indication of the conversion of GO to rGO. In the hydrothermal experimental conditions, the synthesized anatase TiO2 has a perfect crystal structure, as observed from the XRD results. The GTR composites show peaks at 2θ = 25.1°, 38.2°, 48.0°, 53.9°, 54.9°, 62.8°, 68.9°, 70.1°, and 75.0°, corresponding to the (101), (004), (200), (105), (211), (204), (116), (220), and (215) crystal planes, which can be well indexed to anatase TiO2 (JCPDS card no. 21-1272), as shown in Fig. 3. The result demonstrates that the obtained nanocomposites exhibit similar XRD profiles as that of the pure TiO2. The average nanocrystal sizes (D in nm) of the GTR samples were evaluated by the Scherrer formula based on the (101) XRD peak broadening, D = kλ/β![[thin space (1/6-em)]](https://www.rsc.org/images/entities/char_2009.gif) cos
cos![[thin space (1/6-em)]](https://www.rsc.org/images/entities/char_2009.gif) θ, where k is the Scherrer constant that depends on the particle shape (k = 0.89), λ is the X-ray radiation wavelength (0.154056 nm), β is the full width half-maximum (FWHM) of the most intense peak, and θ is the Bragg diffraction angle. The average particle diameter of the TiO2 nanostructures is given in Table 1. We can clearly see in the XRD profiles that amorphous TiO2 transforms into the crystalline anatase phase during the hydrothermal process of combining with GO, resulting in intense and clearly visible peaks belonging to anatase TiO2. Thus, for these composites, the temperature of 180 °C, which was used for the hydrothermal reduction of GO, was found to be sufficient to transform amorphous TiO2 into the anatase crystalline form.
θ, where k is the Scherrer constant that depends on the particle shape (k = 0.89), λ is the X-ray radiation wavelength (0.154056 nm), β is the full width half-maximum (FWHM) of the most intense peak, and θ is the Bragg diffraction angle. The average particle diameter of the TiO2 nanostructures is given in Table 1. We can clearly see in the XRD profiles that amorphous TiO2 transforms into the crystalline anatase phase during the hydrothermal process of combining with GO, resulting in intense and clearly visible peaks belonging to anatase TiO2. Thus, for these composites, the temperature of 180 °C, which was used for the hydrothermal reduction of GO, was found to be sufficient to transform amorphous TiO2 into the anatase crystalline form.
| Sample | Pore diameter, DBJH (nm) | Pore volume, VTOTAL (cm3 g−1) | Surface area, SBET (m2 g−1) | Anatase crystallite size, D (nm) |
|---|---|---|---|---|
| Pure TiO2 | 7.22 | 0.25 | 49.0 | 11.3 |
| GO@TiO2 | 4.61 | 0.31 | 119.6 | 8.6 |
| 2% GTR | 3.82 | 0.34 | 122.7 | 8.9 |
| 3% GTR | 3.84 | 0.35 | 125.6 | 8.1 |
| 4% GTR | 4.32 | 0.37 | 112.7 | 7.2 |
Fig. 4 illustrates the N2 adsorption–desorption isotherms and the corresponding pore size distribution curves of pure TiO2 and the GTR composites containing different amounts of Gd. Following the IUPAC classification, all the adsorption–desorption isotherms of the samples were considered to be type IV curves with a clear H1 hysteresis loop, which reflect the mesoporous structures existing in the synthesized GTR materials as well as facile connectivity between the pores. The high adsorption amount in the initial step of the hysteresis loop corresponding to the capillary condensation of Gd inside the mesopores reveals a narrow pore-size distribution of the GTR materials.39 The specific surface area, pore volume, and pore size of different samples were calculated, and the data are summarized in Table 1. For pure TiO2, GO@TiO2, 2% GTR, 3% GTR, and 4% GTR, the specific surface areas are determined as 49.0, 119.6, 122.7, 125.6, and 112.7 m2 g−1, the total pore volumes are 0.25, 0.31, 0.34, 0.35, and 0.37 cm3 g−1, and the pore sizes are 7.22, 4.61, 3.82, 3.84, and 4.32 nm, respectively. It is interesting to observe that when GO was combined, the specific surface area and pore volume increased as compared with those of pure TiO2, respectively. Furthermore, the BET characteristic results suggested that the increased Gd content results in a slight improved surface area of the GTR composite, which can facilitate photocatalysis owing to the improved adsorbability. With the content of metal Gd increasing, it may affect the folding degree of carrier material after hydrothermal reaction. This result can be ascribed to the Gd formation on the carbon (GO) edge, which leads to the volumetric expansion of pore.40 Therefore, it should be mentioned that the surface area, pore volume, and pore size have a definite effect on the photocatalytic activity.
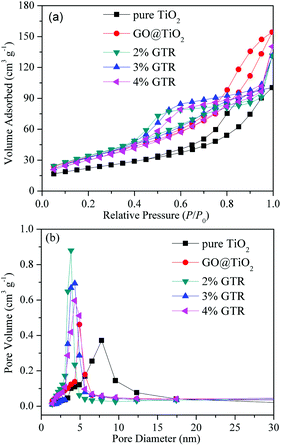 | ||
| Fig. 4 (a) N2 adsorption–desorption isotherms and (b) pore size distribution curves of pure TiO2 and GTR composites with different amounts of Gd. | ||
To confirm the presence of Ti3+ defects and further prove the successful doping of Gd ion, XPS spectra were measured to determine the chemical states of the 3% GTR sample. Fig. 5(a) shows the full-scale XPS profile of the 3% GTR sample, which indicates the chemical binding energies of approximately 459.6 eV, 530.3 eV, 284.8 eV, and 144.2 eV correspond to Ti 2p 3/2, O 1s, C 1s, and Gd 4d, respectively. As shown in Fig. 5(b), the C 1s core-level spectrum of the 3% GTR composite can be devolved into four peaks at 284.7, 285.4, 286.3, and 289.0 eV, which are closely assigned to C![[double bond, length as m-dash]](https://www.rsc.org/images/entities/char_e001.gif) C, C–C, C–O (hydroxyl or epoxy), and C–O–Ti, respectively. The presence of Ti–O–C structure disclosed that some of the Ti atoms were substituted with the C atoms in the TiO2 lattice during the preparation process. The O 1s spectra are displayed in Fig. 5(c), which show three peaks corresponding to the Ti–O–Ti bond (530.6 eV), Ti–O–H bond (531.3 eV), and C–OH species (532.7 eV), respectively. Fig. 5(d) shows the spectra of Ti 2p, wherein two main peaks are observed at 459.6 eV (Ti 2p 3/2) and 465.3 eV (Ti 2p 1/2). These binding energy values are in agreement with those of TiO2. Moreover, the difference between these two binding energies represents the standard binding energy of Ti element. The Ti 2p 3/2 peak shifted slightly toward higher zone of binding energy; this shift may be explained by a variation in the chemical state and coordination structure of Ti 2p 3/2 owing to the interactions between rGO and TiO2. In Fig. 5(e), the peak centered at 144.2 eV could be owing to the presence of Gd 4d 5/2. It was reported that the binding energy of Gd 4d 5/2 in Gd2O3 is 142.1 eV.41,42 Therefore, our experimental data shows a higher binding energy than that of Gd2O3, which indicates that Gd exists in the form of Gd3+, and the chemical environment of Gd3+ in the 3% GTR sample changed, possibly because of the formation of Gd–O–Ti linkages.43
C, C–C, C–O (hydroxyl or epoxy), and C–O–Ti, respectively. The presence of Ti–O–C structure disclosed that some of the Ti atoms were substituted with the C atoms in the TiO2 lattice during the preparation process. The O 1s spectra are displayed in Fig. 5(c), which show three peaks corresponding to the Ti–O–Ti bond (530.6 eV), Ti–O–H bond (531.3 eV), and C–OH species (532.7 eV), respectively. Fig. 5(d) shows the spectra of Ti 2p, wherein two main peaks are observed at 459.6 eV (Ti 2p 3/2) and 465.3 eV (Ti 2p 1/2). These binding energy values are in agreement with those of TiO2. Moreover, the difference between these two binding energies represents the standard binding energy of Ti element. The Ti 2p 3/2 peak shifted slightly toward higher zone of binding energy; this shift may be explained by a variation in the chemical state and coordination structure of Ti 2p 3/2 owing to the interactions between rGO and TiO2. In Fig. 5(e), the peak centered at 144.2 eV could be owing to the presence of Gd 4d 5/2. It was reported that the binding energy of Gd 4d 5/2 in Gd2O3 is 142.1 eV.41,42 Therefore, our experimental data shows a higher binding energy than that of Gd2O3, which indicates that Gd exists in the form of Gd3+, and the chemical environment of Gd3+ in the 3% GTR sample changed, possibly because of the formation of Gd–O–Ti linkages.43
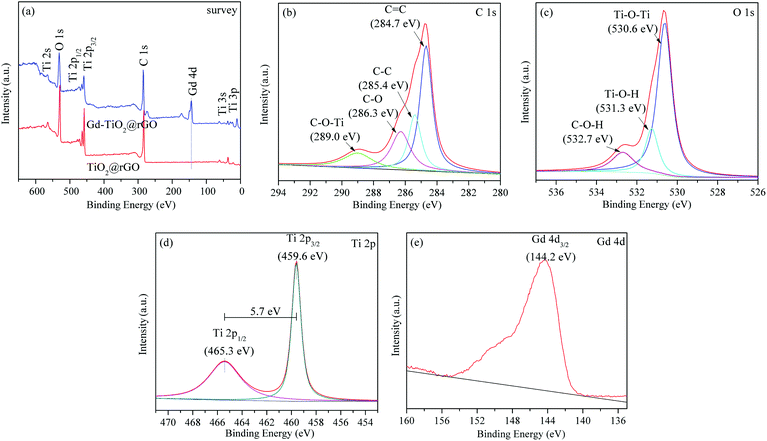 | ||
| Fig. 5 XPS survey spectra (a); C 1s (b), O 1s (c), Ti 2p (d), and Gd 4d (e) XPS spectra of 3% GTR composite. | ||
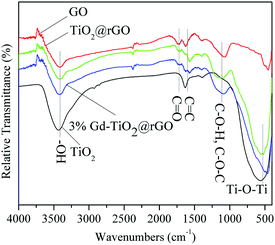
The FTIR spectra of GO, TiO2@rGO, 3% GTR composite, and TiO2 samples are presented in Fig. 6. The bands in the spectra of GO, TiO2@rGO, and 3% GTR composites appearing at 1120, 1570, and 1610 cm−1 arose from the stretching vibrations of oxygen-containing functional groups, such as C–O–H/C–O–C, C![[double bond, length as m-dash]](https://www.rsc.org/images/entities/char_e001.gif) C, and carbonyl C
C, and carbonyl C![[double bond, length as m-dash]](https://www.rsc.org/images/entities/char_e001.gif) O. The broad band located at around 3420 cm−1 originates from the OH stretching vibrations. It can be seen that the spectrum of GO exhibits many strong absorption peaks corresponding to various oxygen-containing functional groups. The spectra of TiO2@rGO, 3% GTR composite, and TiO2 samples show strong and wide peaks in the range of 450 to 1000 cm−1, which correspond to the bending vibrations of Ti–O–Ti bonds. The bands of oxygen-containing groups clearly observed in the GO spectrum changed in the spectra of 3% GTR composites, which indicates that GO was successfully reduced during the hydrothermal preparation.44,45 The above results indicate that the reduction of GO takes place in the TiO2 and rGO phases via bridging oxygen in both TiO2@rGO and the 3% GTR composite.
O. The broad band located at around 3420 cm−1 originates from the OH stretching vibrations. It can be seen that the spectrum of GO exhibits many strong absorption peaks corresponding to various oxygen-containing functional groups. The spectra of TiO2@rGO, 3% GTR composite, and TiO2 samples show strong and wide peaks in the range of 450 to 1000 cm−1, which correspond to the bending vibrations of Ti–O–Ti bonds. The bands of oxygen-containing groups clearly observed in the GO spectrum changed in the spectra of 3% GTR composites, which indicates that GO was successfully reduced during the hydrothermal preparation.44,45 The above results indicate that the reduction of GO takes place in the TiO2 and rGO phases via bridging oxygen in both TiO2@rGO and the 3% GTR composite.
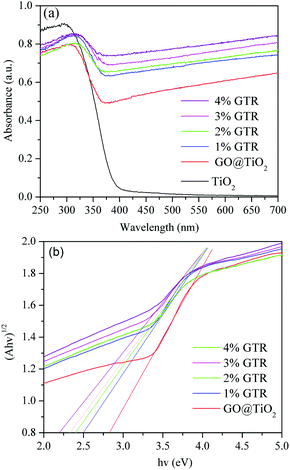
Fig. 7 displays the diffuse reflectance absorption spectra of pure TiO2 and the as-prepared GTR samples. It is seen that the GTR samples exhibit a red shift in the photoabsorption edge with increasing content of Gd along with a strong optical absorption in the visible-light region range.46 The curves in Fig. 7(a) displays the DRS spectra of TiO2, GO@TiO2, 1% GTR, 2% GTR, 3% GTR, and 4% GTR powders from bottom to top, respectively. It can be observed that the introduction of rGO and Gd ions in the GTR with gray color extends its absorption to the visible-light region and enhances visible-light absorption ability. A plot of the transformed Kubelka–Munk function as a function of energy of light is shown in Fig. 7(b), from which the band gaps of GO@TiO2, 1% GTR, 2% GTR, 3% GTR, and 4% GTR are roughly estimated as 2.82, 2.51, 2.41, 2.38, and 2.24 eV, respectively. This reveals that a qualitative observation of a red shift of the photoabsorption edge of the GTR composites as compared to pure TiO2.
3.2 Photocatalytic activity and reusability
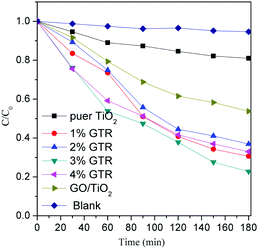
The photocatalytic activities of the as-synthesized composites were evaluated by the degradation of RhB under visible-light illumination. The visible light was turned on to initiate the photocatalytic reaction for 180 min after the adsorption–desorption equilibrium was reached within 60 min of stirring in a dark environment. The photocatalytic activities of different samples were determined and the experimental results are shown in Fig. 8.The as-synthesized GTR composites are well dispersed in an aqueous continuous phase for the removal of the RhB dye during the pre-adsorption process because of the hydrophilic property of rGO. After stirring for 60 min, the adsorption equilibrium had been almost reached. The adsorption percentages of RhB for the synthesized GTR photcatalysts and pure TiO2 were around 61% and 6%, respectively. As shown in Fig. 8, the photoactivity of the GTR composite was higher than that of pure TiO2. The removal efficiencies of the GTR samples with Gd doping ratios of 1, 2, 3, and 4% were determined as 88.3, 86.9, 91.5, and 85.9%, respectively, after visible-light irradiation for 180 min. After photodegradation process, the blank experiment result showed that the dye on its own for the full duration of the experiment were stability.
We adjusted the Gd content in the GTR composite to determine the influence of Gd on the photodegradation performance. The 3% GTR composite afforded a 3.5 times higher apparent rate constant for the photodegradation of RhB than that of pure TiO2. It is well known that GO has been studied to be a competitive acceptor material owing to its two-dimensional π-conjugated structure.47 Such structures can improve the conductivity and transport of charge carriers of the GTR composite.48 For this reason, photo-induced electrons could rapidly transfer from the conduction band of TiO2 to rGO through interfacial interactions. It can suppress the recombination rate of electron–hole (e−–h+) pairs in the composite system, generating more charge carriers to react with the RhB dye molecules.49,50 The superior performance of GTR, therefore, can be largely assigned to the effective charge transport of the photogenerated electrons in RhB and TiO2 to graphene and Gd nanoparticles.
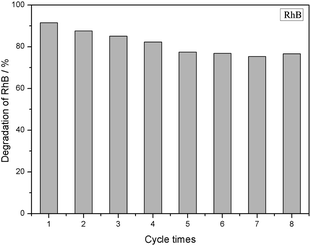
Fig. 9 shows the adsorption and photocatalytic performance of the 3% GTR composite for a RhB (10 mg L−1) solution after eight repeated experiments, in which the composites were reused after washing with ethanol at least eight times in each cycle until the degradation reaches stable. The results show that after eight cycles, the removal efficiency of RhB by GTR decreases to 76.65%, suggesting that the obtained GTR composite has good stability. This indicated that the GTR composites could be applied as a suitable candidate for treating with sewage water in environmental.
3.3 Mechanism of degradation
Fig. 10 presents a schematic diagram of the photocatalytic degradation of RhB by the GTR photocatalyst. Based on the characterization and photodegradation results, we can assume that both electrons (e−) and holes (h+) can interact with O2 and H2O to form superoxide (O2˙−) and hydroxyl radicals (·OH).51 The Gd/TiO2 petaloid ambulacra attached to the graphene sheets transmit their activated electrons to the rGO due to band arrangement, which prevent the recombination of electron–hole. The generated large electric field promotes the light-induced electron orientation of rGO to the interface between Ga and TiO2, and the electron–hole recombination is effectively prevented in this process. Thus, during the photocatalytic reaction, holes and superoxide are the most important active species, which is consistent with the results of the active component trapping experiment.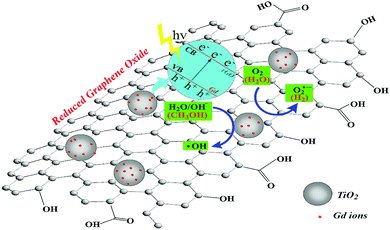 | ||
| Fig. 10 Schematic illustration of photodegradation of RhB by GTR composites under irradiation by visible light region of the simulated sunlight. | ||
Herein, both Gd nanoparticles and graphene are excellent co-catalysts, and we propose that their presence increases the total reaction sites of the system and synergistically contributes to TiO2, thus significantly improving the photodegradation of RhB and hydrogen generation. The mechanism can be described as eqn (1)–(7).
| GTR + RhB → GTR–RhB | (1) |
| rGO/TiO2 + hν → rGO/TiO2 (h+ + e−) | (2) |
| Gd + hν → Gd (h+ + e−) | (3) |
| e− + O2 → O2˙− | (4) |
| h+ + OH− → ·OH | (5) |
| O2˙− + H2O → ·OH | (6) |
| ·OH + RhB → CO2 + H2O | (7) |
4. Conclusion
In conclusion, we prepared GTR composites via a simple and efficient one-pot solvothermal method. The characterization results (FTIR and XPS) showed that GO was successfully reduced to rGO during the hydrothermal process and perfect Ti–O–C bonds existed between TiO2 and rGO. The results showed that all the as-prepared GTR composites performed better in the photodegradation of RhB in simulated wastewater than the pure TiO2 nanoparticles, which revealed that the obtained rGO could be used as an effective co-catalyst to improve the photocatalytic performance of TiO2. We also proposed that the Gd nanoparticles played an important role in enhancing the photocatalytic ability of the GTR composite by expanding the absorption to the visible region, which may increase the amount of reaction site and facilitate charge separation and transfer under UV-vis light illumination. This contributes to the hindering of electron–hole recombination, and thus, more electrons and holes can participate in the photocatalytic reaction.Conflicts of interest
There are no conflicts to declare.Acknowledgements
This work was supported by the Research Project of Education Ministry of Heilongjiang Province of China (135209223, 135209217, YSTSXK201843, 135309116). In addition, the authors also would like to express their gratitude to Research Project of the Ministry of Human Resources and Social Security of Heilongjiang Province of China (2018) and Research Project of the Ministry of Human Resources and Social Security of China (2015) for financial supports.Notes and references
- J. R. Chen, F. X. Qiu, W. Z. Xu, S. S. Cao and H. J. Zhu, Appl. Catal., A, 2015, 495, 131–140 CrossRef CAS.
- N. Rahmani and R. S. Dariani, J. Alloys Compd., 2016, 681, 421–425 CrossRef CAS.
- X. Y. Niu, J. Y. Yu, L. K. Wang, C. F. Fu, J. X. Wang, L. Wang, H. L. Zhao and J. X. Yan, Appl. Surf. Sci., 2017, 413, 7–15 CrossRef CAS.
- J. A. Rengifo-Herrera, M. Blanco, J. Wist, P. Florian and L. R. Pizzio, Appl. Catal., B, 2016, 189, 99–109 CrossRef CAS.
- J. L. Li, S. Q. Jia, G. Z. Sui, L. J. Du and B. X. Li, RSC Adv., 2017, 7, 34857–34865 RSC.
- S. Dosta, M. Robotti, S. Garcia-Segura, E. Brillas, I. G. Cano and J. M. Guilemany, Appl. Catal., B, 2016, 189, 151–159 CrossRef CAS.
- C. R. Jiang, K. Y. Lee, C. M. A. Parlett, M. K. Bayazit, C. C. Lau, Q. S. Ruan, S. J. A. Moniz, A. F. Lee and J. W. Tang, Appl. Catal., A, 2016, 521, 133–139 CrossRef CAS.
- W. X. Li, T. Bak, A. Atanacio and J. Nowotny, Appl. Catal., B, 2016, 198, 243–253 CrossRef CAS.
- L. Y. Shen, Z. P. Xing, J. L. Zou, Z. Li, X. Y. Wu, Y. C. Zhang, Q. Zhu, S. L. Yang and W. Zhou, Sci. Rep., 2017, 7, 41978–41984 CrossRef CAS.
- C. M. Tsai, C. G. Song, Y. C. Hung, Y. G. Jeong, S. H. Oh, J. H. Jeong, H. J. Kim, H. Huh, J. W. Yoon and W. Sigmund, Ceram. Int., 2017, 43, 3761–3768 CrossRef CAS.
- H. B. Li, Y. L. Ma and R. Niu, Sep. Purif. Technol., 2016, 171, 93–100 CrossRef CAS.
- V. R. Djokic, A. D. Marinkovic, O. Ersen, P. S. Uskokovic, R. D. Petrovic, V. L. R. Radmilovic and D. T. Janackovic, Ceram. Int., 2014, 40, 4009–4018 CrossRef CAS.
- C. S. Chen, N. Wang, P. Zhou, H. S. San, K. Y. Wang and X. Y. Chen, ACS Appl. Mater. Interfaces, 2016, 8, 24638–24644 CrossRef CAS.
- J. L. Li, L. J. Du, S. Q. Jia, G. Z. Sui, Y. L. Zhang, Y. Zhuang, B. X. Li and Z. Y. Xing, RSC Adv., 2018, 8, 29645–29653 RSC.
- G. D. Jiang, X. X. Yang, Y. Wu, Z. W. Li, Y. H. Han and X. D. Shen, Mol. Catal., 2017, 432, 232–241 CrossRef CAS.
- Z. W. Tong, D. Yang, T. X. Xiao, Y. Tian and Z. Y. Jiang, Chem. Eng. J., 2015, 260, 117–125 CrossRef CAS.
- L. Zhou, L. Z. Wang, J. Y. Lei, Y. D. Liu and J. L. Zhang, Catal. Commun., 2017, 89, 125–128 CrossRef CAS.
- Z. P. Chen, W. C. Ren, L. B. Gao, B. L. Liu, S. F. Pei and H. M. Cheng, Nat. Mater., 2011, 10, 424–428 CrossRef CAS.
- C. Dai, S. J. Zhang, Z. Liu, R. Wu and Y. Chen, ACS Nano, 2017, 11, 9467–9480 CrossRef CAS.
- H. I. Kim, G. H. Moon, D. Monllor-Satoca, Y. Park and W. Choi, J. Phys. Chem. C, 2012, 116, 1535–1543 CrossRef CAS.
- Y. Zhang, C. W. Foster, C. E. Banks, L. D. Shao, H. S. Hou, G. Q. Zou, J. Chen, Z. D. Huang and X. B. Ji, Adv. Mater., 2016, 28, 9391–9399 CrossRef CAS PubMed.
- M. H. Wang, L. F. Cai, Q. X. Jin, H. Z. Zhang, S. M. Fang, X. W. Qu, Z. H. Zhang and Q. Z. Zhang, Sep. Purif. Technol., 2017, 172, 217–226 CrossRef CAS.
- G. Mamba, M. A. Mamo, X. Y. Mbianda and A. K. Mishra, Ind. Eng. Chem. Res., 2014, 53, 14329–14338 CrossRef CAS.
- G. Ersan, O. G. Apul, F. Perreault and T. Karanfil, Water Res., 2017, 126, 385–398 CrossRef CAS.
- D. G. Papageorgiou, I. A. Kinloch and R. J. Young, Prog. Mater. Sci., 2017, 90, 75–127 CrossRef CAS.
- L. L. Jiang, X. Lu, C. M. Xie, G. J. Wan, H. P. Zhang and Y. H. Tang, J. Phys. Chem. C, 2015, 119, 3903–3910 CrossRef CAS.
- M. C. Long, Y. L. Qin, C. Chen, X. Y. Guo, B. H. Tan and W. M. Cai, J. Phys. Chem. C, 2013, 117, 16734–16741 CrossRef CAS.
- N. Zhang, Y. H. Zhang, X. Y. Pan, M. Q. Yang and Y. J. Xu, J. Phys. Chem. C, 2012, 116, 18023–18031 CrossRef CAS.
- V. Stengl, D. Popelkova and P. Vlacil, J. Phys. Chem. C, 2011, 115, 25209–25218 CrossRef CAS.
- R. Wang, Q. D. Wu, Y. Lu, H. W. Liu, Y. Z. Xia, J. Q. Liu, D. J. Yang, Z. Y. Huo and X. D. Yao, ACS Appl. Mater. Interfaces, 2014, 6, 2118–2124 CrossRef CAS.
- X. Pan, Y. Zhao, S. Liu, C. Korzeniewski, S. Wang and Z. Y. Fan, ACS Appl. Mater. Interfaces, 2012, 4, 3944–3950 CrossRef CAS.
- S. D. Perera, R. G. Mariano, K. Vu, N. Nour, O. Seitz, Y. Chabal and K. J. Balkus, ACS Catal., 2012, 2, 949–956 CrossRef CAS.
- L. A. Gu, J. Y. Wang, H. Cheng, Y. Z. Zhao, L. F. Liu and X. J. Han, ACS Appl. Mater. Interfaces, 2013, 5, 3085–3093 CrossRef CAS.
- Q. W. Huang, S. Q. Tian, D. W. Zeng, X. X. Wang, W. L. Song, Y. Y. Li, W. Xiao and C. S. Xie, ACS Catal., 2013, 3, 1477–1485 CrossRef CAS.
- Y. H. Wu, P. Y. Tseng, P. Y. Hsieh, H. T. Chou and N. H. Tai, ACS Appl. Mater. Interfaces, 2015, 7, 9453–9461 CrossRef CAS.
- X. M. Liu, M. Khan, W. X. Liu, W. Xiang, M. Guan, P. Jiang and W. B. Cao, Ceram. Int., 2015, 41, 3075–3080 CrossRef CAS.
- Y. Chen and K. R. Liu, J. Hazard. Mater., 2017, 324, 139–150 CrossRef CAS.
- M. A. Farrukh, M. Shahid, I. Muneer, S. Javaid and M. Khaleeq-ur-Rahman, J. Mater. Sci.: Mater. Electron., 2015, 27, 2994–3002 CrossRef.
- Y. M. Yu, J. F. Geng, H. Li, R. Y. Bao, H. Y. Chen, W. Z. Wang, J. X. Xia and W. Y. Wong, Sol. Energy Mater. Sol. Cells, 2017, 168, 91–99 CrossRef CAS.
- S. Paul, P. Chetri, B. Choudhury, G. A. Ahmed and A. Choudhury, J. Colloid Interface Sci., 2015, 439, 54–61 CrossRef CAS PubMed.
- M. Zalas, J. Rare Earths, 2014, 32, 487–495 CrossRef CAS.
- D. Z. Lu, P. F. Fang, J. Q. Ding, M. C. Yang, Y. F. Cao, Y. W. Zhou, K. Peng, K. K. Kondamareddy and M. Liu, Appl. Surf. Sci., 2017, 396, 185–201 CrossRef CAS.
- W. J. Zhang, Y. X. Liu, X. B. Pei and X. J. Chen, J. Phys. Chem. Solids, 2017, 104, 45–51 CrossRef CAS.
- W. D. Yang, Y. R. Li and Y. C. Lee, Appl. Surf. Sci., 2016, 380, 249–256 CrossRef CAS.
- J. L. Li, T. Liu, G. Z. Sui and D. S. Zhen, J. Nanosci. Nanotechnol., 2015, 15, 1408–1415 CrossRef CAS.
- Z. L. Cheng, X. J. Quan, J. X. Xiang, Y. M. Huang and Y. L. Xu, J. Environ. Sci., 2012, 24, 1317–1326 CrossRef CAS.
- P. H. Wang, J. Environ. Sci., 2017, 56, 202–213 CrossRef PubMed.
- S. Y. Pu, R. X. Zhu, H. Ma, D. L. Deng, X. J. Pei, F. Qi and W. Chu, Appl. Catal., B, 2017, 218, 208–219 CrossRef CAS.
- J. J. Zhang, X. Liu, T. Ye, G. P. Zheng, X. C. Zheng, P. Liu and X. X. Guan, J. Alloys Compd., 2017, 698, 819–827 CrossRef CAS.
- H. Safajou, H. Khojasteh, M. Salavati-Niasari and S. Mortazavi-Derazkola, J. Colloid Interface Sci., 2017, 498, 423–432 CrossRef CAS.
- M. Minella, F. Sordello and C. Minero, Catal. Today, 2017, 281, 29–37 CrossRef CAS.
| This journal is © The Royal Society of Chemistry 2019 |

