 Open Access Article
Creative Commons Attribution 3.0 Unported Licence
Dual-response detection of Ni2+ and Cu2+ ions by a pyrazolopyrimidine-based fluorescent sensor and the application of this sensor in bioimaging†
Yun-Qiong Gu‡
bc,
Wen-Ying Shen‡c,
Yan Mia,
Yan-Fang Jinga,
Jing-Mei Yuanc,
Peng Yub,
Xiao-Min Zhuc and
Fei-Long Hu *a
*a
aGuangxi Key Laboratory of Chemistry and Engineering of Forest Products, Guangxi University for Nationalities, Nanning, 530006, China
bSchool of Environment and Life Science, Nanning Normal University, Nanning, 530001, Guangxi, China
cKey Laboratory for the Chemistry and Molecular Engineering of Medicinal Resources (Guangxi Normal University), Ministry of Education of China, China
First published on 4th November 2019
Abstract
Herein, a dual-response fluorescent sensor, L, based on pyrazolopyrimidine was designed and developed for the simultaneous detection of Ni2+ and Cu2+ ions in the presence of other metal ions; the structural characterization of L was carried out by FTIR spectroscopy, NMR spectroscopy, HRMS and X-ray diffraction analysis. The sensor L effectively displayed fluorescence quenching towards the Ni2+ and Cu2+ ions with high sensitivity without interference from other metal ions. The results reveal that L binds to Ni2+ and Cu2+ in a 2![[thin space (1/6-em)]](https://www.rsc.org/images/entities/char_2009.gif) :
:![[thin space (1/6-em)]](https://www.rsc.org/images/entities/char_2009.gif) 1 pattern, which matches well with the result of the Job's plot. The association constants of L with Ni2+ and Cu2+ were 3.2 × 10⁴ M−1 and 7.57 × 10⁴ M−1, respectively. The detection limits (DLs) are down to 8.9 nM for Ni2+ and 8.7 nM for Cu2+. The fluorescence imaging of L in T-24 cells was investigated because of the low cytotoxicity of L, indicating that L could be used to detect Ni2+ and Cu2+ in living cells.
1 pattern, which matches well with the result of the Job's plot. The association constants of L with Ni2+ and Cu2+ were 3.2 × 10⁴ M−1 and 7.57 × 10⁴ M−1, respectively. The detection limits (DLs) are down to 8.9 nM for Ni2+ and 8.7 nM for Cu2+. The fluorescence imaging of L in T-24 cells was investigated because of the low cytotoxicity of L, indicating that L could be used to detect Ni2+ and Cu2+ in living cells.
Introduction
Heavy metal ions have gained extensive attention due to their importance in many biological and environmental processes. However, the ingestion of these metals, including arsenic, mercury, copper, nickel, and lead,1 even at very low concentrations can lead to numerous health issues or toxic effects.2 Copper is associated with various biological processes3 as it is utilized in important cofactors of several proteins and enzymes.4–7 The imbalance of Cu2+ level causes various diseases; moreover, nickel at high concentrations can cause severe harmful effects such as pneumonitis, lung cancer, respiratory problems, and kidney damage through its bioaccumulation.8–10 If the accumulation of excess amounts of copper and nickel ions or their misregulation in the body, it is very dangerous to man and animals.11,12 Hence, the sensing of copper and nickel ions in aqueous media is necessary because of the vital roles of these ions in biological systems.Nowadays, spectroscopic techniques, such as atomic absorption spectroscopy (AAS), ion-chromatography ultraviolet-visible spectroscopy (IC-UV-vis), inductively coupled plasma mass spectroscopy (ICP-MS), and chromatography, are being used to detect the Cu2+ and Ni2+ metal ions.13–17 These traditional methods have high sensitivity;18 however, they require expensive instruments, trained professionals, difficult sample preparation processes and high time consumption;19 therefore, continuous efforts have been focused on the development of methods for the rapid and convenient sensing of particular heavy metal cations.20,21 Although many fluorescent sensors have been reported for the Cu2+ and Ni2+ ions, there is still an intense demand for new, efficient Cu2+ and Ni2+ ion fluorescent probes that can work in aqueous media with high selectivity and sensitivity at low concentrations.
Herein, the luminescent pyrazolopyrimidine 2-(3,5-diphenyl-pyrazol-1-yl)-4-methyl-6,8-diphenyl-1,5,8a,9-tetraaza-fluorene (L) was studied. It possesses both pyrimidine and pyrazole moieties as backbones with a phenyl substituent, which can be modified to enhance the fluorescence intensity.22 Moreover, due to their good binding characteristics and structures that enable easy modification,23–28 pyrazolopyrimidine and its derivatives are vital chelators and sensors for metal ions. The ingenious sensor L is an “N–C–N”-type ligand containing two coordination sites, which can provide a special coordination environment that increases the binding efficiency of L with metal ions.29–32 In addition, the introduction of a typical electron-withdrawing substituent, phenyl, can effectively improve the selectivity of L towards metal ions.33 The most important thing is that the sensor L shows low toxicity in living cells and may have potential therapeutic value in the diagnosis and treatment field. Therefore, herein, a dual function and low cytotoxic sensor for the label-free detection of Cu2+ and Ni2+ cations with very low detection limit of nanomolar level in the presence of other cations was synthesized, and then, its potential applications in human cancer cell imaging were investigated.
Experimental
Materials
All the materials and solvents were applied as received without further purification. The stock solutions of the sensor L (2 × 10⁻³ M) were prepared by dissolving L in ethanol and then diluted to desired concentration with ethanol when needed. The stock solutions of metal ions (2 × 10⁻³ M) were prepared from the salts LiCl, NaCl, KCl, MgCl2·6H2O, CaCl2·2H2O, BaCl2·2H2O, MnCl2·4H2O, FeCl2·4H2O, CoCl2·6H2O, NiCl2·6H2O, CuCl2·2H2O, ZnCl2·6H2O, CdCl2·H2O, HgCl2, AlCl3·6H2O, FeCl3·6H2O, AgNO3 and Pb(NO3)4 using pure water.Instruments
1H NMR spectra were obtained by the Bruker Avance 400 MHz spectrometer in d6-DMSO, and high-resolution mass (HRMS) spectra were obtained using the Agilent 6224 TOF LC/MS instrument. Fourier transform infrared (FTIR) spectroscopy was conducted using the NEXUS 870 FTIR spectrophotometer, and fluorescence spectra were obtained using the Hitachi F-4600 spectrofluorometer. Quantum yields were determined with respect to quinine sulfate (ΦF = 0.546) using the standard method;34–36 the X-ray crystallography data and the results of elemental analyses were obtained using the Bruker Apex II X-ray diffractometer and the PerkinElmer Series II CHNS/O 2400 analyzer, respectively. The images of living cells were obtained using the Cyration 5 confocal microscope.Synthesis
1,3-Diphenylpropane-1,3-dione (0.448 g, 2.0 mmol) was dissolved in ethanol (20 mL), and then, an ethanol solution (10 mL) of A (0.353 g, 1.0 mmol) was added to the abovementioned solution. The resulting mixture was heated under reflux for 8 h, and then, the solution was cooled down to room temperature. A bright yellow solid was formed, which was filtered, washed with ice-cold ethanol and dried to obtain the yellow solid L (0.762 g yield: 91.7%). 1H NMR (400 MHz, d6-DMSO, Fig. S1†) δ 8.51 (dd, J = 8.0, 1.4 Hz, 2H, benzene-H), 8.33 (s, 1H, pyrimidine-H), 8.28–8.22 (m, 2H, benzene-H), 8.01 (d, J = 7.1 Hz, 2H, benzene-H), 7.68–7.66 (m, 2H, benzene-H), 7.65 (s, 1H, pyridine-H), 7.64 (s, 2H, benzene-H), 7.62 (s, 2H, benzene-H), 7.50 (t, J = 7.5 Hz, 2H, benzene-H), 7.44–7.38 (m, 2H, benzene-H), 7.38–7.31 (m, 4H, benzene-H), 7.28 (s, 1H, pyrazole-H), 3.17 (s, 3H, Py-CH3). HRMS: 555.2243 [M + H+] (Fig. S2†). Anal. calc. (for C37H26N6) C 80.12; H 4.72; N 15.15%, found. C 80.15; H 4.74; N 15.11%. IR (KBr): 3456, 1631, 1382, 1061, 820 cm−1 (Fig. S3†).
![[thin space (1/6-em)]](https://www.rsc.org/images/entities/char_2009.gif) :
:![[thin space (1/6-em)]](https://www.rsc.org/images/entities/char_2009.gif) 1 by volume, 32 mL). Microcrystals were obtained after evaporating the blue solution slowly at room temperature, which were filtered off, washed with cold ethanol and dried in vacuo. (Yield: 68% base on CuCl2·6H2O). HRMS: 1171.3727 [Cu(L)2]+ (calc. 1171.3834) (Fig. S4†).
1 by volume, 32 mL). Microcrystals were obtained after evaporating the blue solution slowly at room temperature, which were filtered off, washed with cold ethanol and dried in vacuo. (Yield: 68% base on CuCl2·6H2O). HRMS: 1171.3727 [Cu(L)2]+ (calc. 1171.3834) (Fig. S4†).Cell culture and fluorescence imaging for Cu2+ and Ni2+ in living cells
The living cells were obtained from the Shanghai Cell Bank of the Chinese Academy of Science, which were grown in the Dulbecco's modified Eagle medium (DMEM, Gibco), containing 10% fetal bovine serum (FBS, Gibco) (V/V), under an atmosphere of 5% CO2 and 95% air at 37 °C. These cells were incubated with the compound L (5 μM) under the same abovementioned experimental conditions for 4 h. The cells were washed with PBS buffer and simultaneously imaged using a confocal laser scanning microscope. Then, the cells were incubated with the CuCl2 and NiCl2 solutions (30 μM) for another 6 h, washed with PBS buffer and again imaged using a confocal laser scanning microscope.Results and discussion
Synthesis and characterization
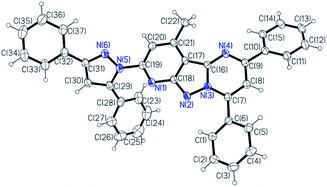
As illustrated in Scheme 1, the target chemosensor L was easily synthesized by the condensation reaction of pyridyl hydrazine A with 1,3-diphenylpropane-1,3-dione. Subsequently, its structure was characterized by 1H NMR spectroscopy, FTIR spectroscopy, HRMS and single-crystal X-ray crystallography; all the spectroscopic data were in agreement with the formula of L. Both pyrazole and pyrimidine units from the same ligand coordinated to the same Ni/Cu atom forming a conjugated plan motif. As shown in Fig. 1, multiple binding sites were provided by the electron-donating N atom; a chelating model was suggested based on the crystal structure when L was treated with the metal ions.Metal-ion selectivity
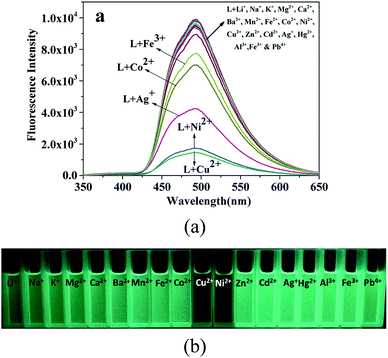
The fluorescence sensing selectivity of L (2 × 10⁻⁵ M in ethanol) was investigated towards common metal ions (2.5 equiv.), such as Li+, Na+, K+, Mg2+, Ca2+, Ba2+, Mn2+, Fe2+, Co2+, Ni2+, Cu2+, Zn2+, Cd2+, Hg2+, Al3+, Fe3+, and Pb4+, by determining the changes in the fluorescence intensity. The probe L exhibited an intense emission band at 494 nm (λex = 330 nm) with a high quantum yield determined using quinine sulfate as a reference.35 The addition of the Cu2+ and Ni2+ ions to the ethanol solution of probe L caused a remarkable fluorescence quenching ((I0 − I)/I0 × 100% = 81.9% for the Ni2+ ions and 84.8% for Cu2+) at 494 nm, and slightly quenched (addition of Fe3+, Co2+ or Ag+) or no fluorescence spectral changes were observed upon the addition of other metal ions under the same conditions (Fig. 2a). This result clearly suggests that L may be used to detect the Ni2+ and Cu2+ ions due to their higher binding affinity with the chelator of L that leads to the formation of stable complexes between L and the Ni2+ or Cu2+ ions.38–40 However, other metal ions caused a slight change in the fluorescence intensity due to the unsuitable coordination geometry conformation of the chemosensor L and inappropriate ionic radius and insufficient binding energy of these metal ions.41 As shown in Fig. 2b, the fluorescence clearly changed from bright green to colourless under UV light (365 nm) after the addition of the Ni2+ and Cu2+ ions, whereas no change was observed after the addition of other metal ions tested herein under UV light. These findings revealed that the sensor L could be used to easily detect the Ni2+ and Cu2+ ions by the naked eye under 365 nm UV light.Competitive studies
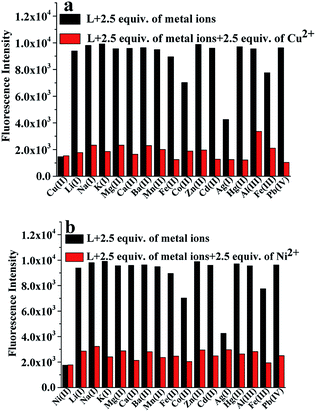
To confirm the selectivity of L, competitive experiments towards Cu2+ or Ni2+ (2.5 equiv.) over other competitive coexisting metal ions (2.5 equiv.) were carried out. The changes in the fluorescence intensity are displayed in Fig. 3a and b. As shown in Fig. 3, except for Ni2+ and Cu2+, other competitive metal ions had no obvious effect on the fluorescence of L. This performance clearly indicated that the binding interaction between L and Ni2+ or Cu2+ was stronger than that between L and other metal ions. Therefore, this shows that the recognition of Ni2+ and Cu2+ by L is barely interfered by other coexisting metal ions; this indicates that L is a dual-response fluorescent sensor for the detection of Ni2+ and Cu2+ ions in an ethanol solution.Titration analysis
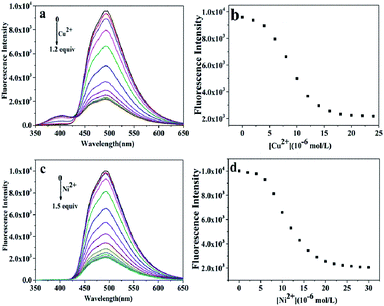
To obtain a better insight into the sensitivity of the probe L, we increased the concentration of Cu2+ (0–1.2 equiv.) or Ni2+ (0–1.5 equiv.) ions to detect the fluorescence intensity of L (20.0 μM). The strong fluorescence intensity of the sensor L at 494 nm (quantum yield, ΦF = 0.293) was attributed to the fluorescence enhancement effect of the N dopant atoms on the surface of L in the excited state.34 The changes in the fluorescence intensity as a function of the concentration of Cu2+ and Ni2+ ions are shown in Fig. 4a and c, respectively. The fluorescence intensity gradually decreased and then reached minimum with an increase in the concentration of the Cu2+ and Ni2+ ions (Fig. 4b and d), respectively. Based on these concentration-dependent experiments, the corresponding association constants of L with Ni2+ and Cu2+ were calculated to be 3.2 × 10⁴ M−1 and 7.57 × 10⁴ M−1 by the Benesi–Hildebrand plot, with the correlation coefficient R = 88.617 and 97.475, respectively (Fig. 5). A linear regression curve was fitted to the titration data of the fluorescence intensity and the concentration of Ni2+ and Cu2+, and then, the detection limit (DL) values were calculated to be 8.9 nM and 8.7 nM (Fig. S5†), respectively, which were determined reasonably by the equation DL = K × σ/S (eqn (S1)†), where K = 3, σ is the standard deviation of the blank solution (10 times) and S is the slope of the calibration curve;42 moreover, these detection limits were significantly less than the maximum contaminant levels of Ni2+ (17 μM) and Cu2+ (30 μM) in potable water according to the EPA guidelines;43 this indicated that the as-prepared L could be deemed as an excellent fluorescent sensor and employed for the recognition and detection of the Ni2+ and Cu2+ ions instantly in biological and environmental systems.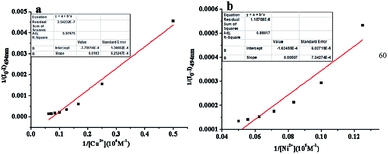 | ||
| Fig. 5 Benesi–Hildebrand plot of the Cu complex of L (a) and Ni complex of L (b) in an ethanol solution. | ||
Binding mode studies
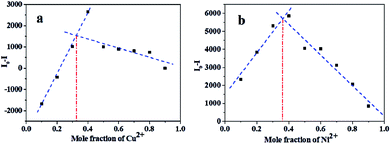
To obtain further information about the binding mechanism, the binding process was studied by Job's plot and HRMS mass spectral analysis. The Job's plot for L with the metal ions was obtained for achieving the binding stoichiometry between L and Ni2+ and Cu2+ (Fig. 6). It exhibited a maximum point at a mole ratio fraction of 1/3, indicating a 2![[thin space (1/6-em)]](https://www.rsc.org/images/entities/char_2009.gif) :
:![[thin space (1/6-em)]](https://www.rsc.org/images/entities/char_2009.gif) 1 stoichiometry of the binding mode of L with Ni2+ or Cu2+.44 The HRMS spectra illustrated that the binding ratio of L to Cu2+ was 2
1 stoichiometry of the binding mode of L with Ni2+ or Cu2+.44 The HRMS spectra illustrated that the binding ratio of L to Cu2+ was 2![[thin space (1/6-em)]](https://www.rsc.org/images/entities/char_2009.gif) :
:![[thin space (1/6-em)]](https://www.rsc.org/images/entities/char_2009.gif) 1 (Fig. S4†). Therefore, the results obtained from the mass spectral analysis correlate well with those obtained by the Job's method.
1 (Fig. S4†). Therefore, the results obtained from the mass spectral analysis correlate well with those obtained by the Job's method.
Fluorescence imaging in T-24 cells
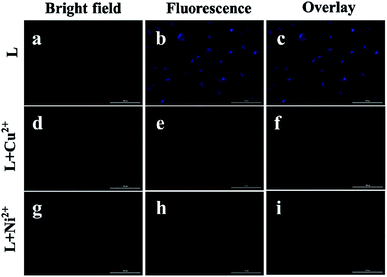
Cytotoxicity tests were carried out to ascertain the potential biological applications of L in vitro. The cytotoxicity of L against seven human tumor cell lines (T-24, HeLa, Hep-G2, MGC803, A549, NCI-H460, and SK-OV-3) and a normal liver cell line (HL-7702) was investigated by the MTT method. We treated different cell lines with different concentrations of L for 48 h, and the IC50 values ranged from 30 to 40 μM (Table S2†). Overall, the IC50 value of L was 39.94 ± 0.28 μM against T-24, and it showed the lowest toxic effect on the T-24 cells, which indicated the good biocompatibility of L in the cells.28Inspired by the low cytotoxicity and the strong fluorescence intensity of L, fluorescence imaging to recognize the Ni2+ and Cu2+ ions in living cells was conducted (Fig. 7). The fluorescence filter of the blue channel with an excitation of 330 nm was chosen as the signal output. The T-24 cells were first treated with 5 μM of L for 4 h at 37 °C and then washed with PBS buffer, which displayed a blue fluorescence (Fig. 7b and c). Consequently, it was observed that the fluorescence was quenched after the incubation of cells with 30 μM of a CuCl2·6H2O or NiCl2·6H2O solution for another 6 h (Fig. 7e and h). These imaging experiments prove good permeability of L into the membrane of cells, and thus, L can be used to recognize these two metal ions in living cells.
Conclusions
In conclusion, herein, an easy-to-prepare and efficient dual-response fluorescent sensor, L, for the detection of Ni2+ and Cu2+ in an ethanol solution was designed and synthesized, which was investigated in detail by employing fluorescence measurements. The presented sensor L exhibited good sensitivity and biocompatibility for the detection of Ni2+ and Cu2+ ions over several metal ions with the detection limit of as low as 8.9 nM for Ni2+ and 8.7 nM for Cu2+. The 2![[thin space (1/6-em)]](https://www.rsc.org/images/entities/char_2009.gif) :
:![[thin space (1/6-em)]](https://www.rsc.org/images/entities/char_2009.gif) 1 binding mode between L and the Ni2+ or Cu2+ ions was suggested via the Job's method and HRMS spectra. The probe L could be used as a staining reagent in cells due to its good biocompatibility, which provided a sensitive response to the fluorescence of Ni2+ and Cu2+ in living cells. Therefore, it can be a good candidate to recognize Ni2+ and Cu2+ in a biological environment.
1 binding mode between L and the Ni2+ or Cu2+ ions was suggested via the Job's method and HRMS spectra. The probe L could be used as a staining reagent in cells due to its good biocompatibility, which provided a sensitive response to the fluorescence of Ni2+ and Cu2+ in living cells. Therefore, it can be a good candidate to recognize Ni2+ and Cu2+ in a biological environment.
Conflicts of interest
There are no conflicts to declare.Acknowledgements
The authors acknowledge the National Natural Science Foundation of China (21701035 and 21761004) This work was also supported by the Middle-aged and Young Teachers' Basic Ability Promotion Project of Guangxi (2018KY0363), specific research project of Guangxi for research bases and talents (AD18126005, AD 18126002), Natural Science Foundation of Guangxi (2018GXNSFAA138129, 2016GXNSFAA380087) and Key Laboratory for the Chemistry and Molecular Engineering of Medicinal Resources (Guangxi Normal University), Ministry of Education of China (CMEMR2014-B08, CMEMR2017-B17).References
- T. Rasheed, M. Bilal, F. Nabeel, H. M. N. Iqbal, C. Li and Y. Zhou, Sci. Total Environ., 2018, 615, 476–485 CrossRef CAS.
- J. Pizarro, E. Flores, V. Jimenez, T. Maldonado, C. Saitz, A. Vega, F. Godoy and R. Segura, Sens. Actuators B Chem., 2019, 281, 115–122 CrossRef CAS.
- L. Tang, X. Dai, X. Wen, D. Wu and Q. Zhang, Spectrochim. Acta, Part A, 2015, 139, 329–334 CrossRef CAS.
- A. K. Manna, J. Mondal, K. Rout and G. K. Patra, J. Photochem. Photobiol., A, 2018, 367, 74–82 CrossRef CAS.
- H. Huang, F. Shi, Y. Li, L. Niu, Y. Gao, S. M. Shah and X. Su, Sens. Actuators, B, 2013, 178, 532–540 CrossRef CAS.
- A. Kim, J. H. Kang, H. J. Jang and C. Kim, J. Ind. Eng. Chem., 2018, 65, 290–299 CrossRef CAS.
- D. Wang, J.-Q. Zheng, X.-J. Zheng, D.-C. Fang, D.-Q. Yuan and L.-P. Jin, Sens. Actuators, B, 2016, 228, 387–394 CrossRef CAS.
- J. E. Goodman, R. L. Prueitt, D. G. Dodge and S. Thakali, Crit. Rev. Toxicol., 2009, 39, 365–417 CrossRef CAS.
- A. K. Singh and R. Singh, J. Inclusion Phenom. Macrocyclic Chem., 2005, 53, 249–255 CrossRef CAS.
- J. Jia, M. Zhai, J. Lv, B. Zhao, H. Du and J. Zhu, ACS Appl. Mater. Interfaces, 2018, 10, 30400–30408 CrossRef CAS.
- U. Fegade, J. Marek, R. Patil, S. Attarde and A. Kuwar, J. Lumin., 2014, 146, 234–238 CrossRef CAS.
- U. Fegade, H. Sharma, S. Attarde, N. Singh and A. Kuwar, J. Fluoresc., 2014, 24, 27–37 CrossRef CAS.
- B. J. Sanghavi, S. M. Mobin, P. Mathur, G. K. Lahiri and A. K. Srivastava, Biosens. Bioelectron., 2013, 39, 124–132 CrossRef CAS.
- A. K. Manna, J. Mondal, K. Rout and G. K. Patra, Sens. Actuators, B, 2018, 275, 350–358 CrossRef CAS.
- N. Ullah, M. Mansha, I. Khan and A. Qurashi, TrAC, Trends Anal. Chem., 2018, 100, 155–166 CrossRef CAS.
- C. V. Hoang, M. Oyama, O. Saito, M. Aono and T. Nagao, Sci. Rep., 2013, 3, 1175 CrossRef.
- A. Ghosh, A. Sengupta, A. Chattopadhyay and D. Das, RSC Adv., 2015, 5, 24194–24199 RSC.
- K. M. Vengaian, C. D. Britto, K. Sekar, G. Sivaraman and S. Singaravadivel, Sens. Actuators, B, 2016, 235, 232–240 CrossRef CAS.
- L. Pujol, D. Evrard, K. Groenen-Serrano, M. Freyssinier, A. Ruffien-Cizsak and P. Gros, Front. Chem., 2014, 2, 19 Search PubMed.
- G. Sivaraman, T. Anand and D. Chellappa, RSC Adv., 2012, 2, 10605 RSC.
- J. Peng, W. Gao, B. K. Gupta, Z. Liu, R. Romero-Aburto, L. Ge, L. Song, L. B. Alemany, X. Zhan, G. Gao, S. A. Vithayathil, B. A. Kaipparettu, A. A. Marti, T. Hayashi, J. J. Zhu and P. M. Ajayan, Nano Lett., 2012, 12, 844–849 CrossRef CAS.
- D. W. Tan, H. X. Li, D. L. Zhu, H. Y. Li, D. J. Young, J. L. Yao and J. P. Lang, Org. Lett., 2018, 20, 608–611 CrossRef CAS PubMed.
- Z.-L. Gong, L.-W. Zheng, B.-X. Zhao, D.-Z. Yang, H.-S. Lv, W.-Y. Liu and S. Lian, J. Photochem. Photobiol., A, 2010, 209, 49–55 CrossRef CAS.
- W.-Y. Liu, Y.-S. Xie, B.-X. Zhao, B.-S. Wang, H.-S. Lv, Z.-L. Gong, S. Lian and L.-W. Zheng, J. Photochem. Photobiol., A, 2010, 214, 135–144 CrossRef CAS.
- Z.-L. Gong, B.-X. Zhao, W.-Y. Liu and H.-S. Lv, J. Photochem. Photobiol., A, 2011, 218, 6–10 CrossRef CAS.
- C. J. Fahrni, L. Yang and D. G. VanDerveer, J. Am. Chem. Soc., 2003, 125, 3799–3812 CrossRef CAS.
- W. Y. Liu, H. Y. Li, B. X. Zhao and J. Y. Miao, Analyst, 2012, 137, 3466–3469 RSC.
- N. Omer, F. Zhang, G. Zhao, S. Guang and H. Xu, Analyst, 2019, 144, 3414–3421 RSC.
- S. Anbu, R. Ravishankaran, M. F. Guedes da Silva, A. A. Karande and A. J. Pombeiro, Inorg. Chem., 2014, 53, 6655–6664 CrossRef CAS.
- Y. Wang, Z. G. Wang, X. Q. Song, Q. Chen, H. Tian, C. Z. Xie, Q. Z. Li and J. Y. Xu, Analyst, 2019, 144, 4024–4032 RSC.
- Z.-L. Gong, F. Ge and B.-X. Zhao, Sens. Actuators, B, 2011, 159, 148–153 CrossRef CAS.
- Q. Hu, C. Zhuo, Y. Wang, C. Hu and J. Lang, Inorg. Chem., 2017, 56, 10204–10214 CrossRef CAS PubMed.
- C. Chen, G. Men, W. Bu, C. Liang, H. Sun and S. Jiang, Sens. Actuators, B, 2015, 220, 463–471 CrossRef CAS.
- T. L. Chang and H. C. Cheung, J. Phys. Chem., 1992, 96, 4874–4878 CrossRef CAS.
- Q. Huang, Q. Li, Y. Chen, L. Tong, X. Lin, J. Zhu and Q. Tong, Sens. Actuators, B, 2018, 276, 82–88 CrossRef CAS.
- J. Feng, L. X. Duan, Z. B. Shang, J. B. Chao, Y. Wang and W. J. Jin, Spectrochim. Acta, Part A, 2018, 201, 185–192 CrossRef CAS.
- Y. Q. Gu, W. Y. Shen, Y. Zhou, S. F. Chen, Y. Mi, B. F. Long, D. J. Young and F. L. Hu, Spectrochim. Acta, Part A, 2019, 209, 141–149 CrossRef CAS.
- P. N. Borase, P. B. Thale and G. S. Shankarling, Dyes Pigm., 2016, 134, 276–284 CrossRef CAS.
- S. D. Shahida Parveen, B. Suresh Kumar, S. Raj Kumar, R. Imran Khan and K. Pitchumani, Sens. Actuators, B, 2015, 221, 75–80 CrossRef CAS.
- C. C. Zhuo, L. Li, C. J. Hu and J. P. Lang, Sci. Rep., 2017, 7, 3829 CrossRef.
- Z. Guo, T. Hu, X. Wang, T. Sun, T. Li and Q. Niu, J. Photochem. Photobiol., A, 2019, 371, 50–58 CrossRef CAS.
- K. Tiwari, S. Kumar, V. Kumar, J. Kaur, S. Arora and R. K. Mahajan, Spectrochim. Acta, Part A, 2018, 191, 16–26 CrossRef CAS.
- Y. Jia, T. Sun, Y. Jiang, W. Sun, Y. Zhao, J. Xin, Y. Hou and W. Yang, Analyst, 2018, 143, 5145–5150 RSC.
- Y. Wang, M.-Y. Yang, M.-H. Zheng, X.-L. Zhao, Y.-Z. Xie and J.-Y. Jin, Tetrahedron Lett., 2016, 57, 2399–2402 CrossRef CAS.
Footnotes |
| † Electronic supplementary information (ESI) available. CCDC 1936105 for L. For ESI and crystallographic data in CIF or other electronic format see DOI: 10.1039/c9ra06227k |
| ‡ Yun-Qiong Gu and Wen-Ying Shen contributed equally to this work. |
| This journal is © The Royal Society of Chemistry 2019 |


