 Open Access Article
A novel and fast responsive turn-on fluorescent probe for the highly selective detection of Cd2+ based on photo-induced electron transfer†
Meng-Xia Huanga,
Cai-Hua Lva,
Qing-Da Huanga,
Jia-Ping Lai *a and
Hui Sun*b
aSchool of Chemistry & Environment, South China Normal University, Guangzhou 510006, Guangdong, China. E-mail: laijp@scnu.edu.cn; Fax: +86-20-39310187; Tel: +86-20-39310257
bCollege of Environmental Science & Engineering, Guangzhou University, Guangzhou 510006, Guangdong, China. E-mail: cherrysunhui@aliyun.com
First published on 5th November 2019
Abstract
A novel, highly sensitive and fast responsive turn-on fluorescence probe, 2,2′-((1E,1′E)-((1,10-phenanthroline-2,9-diyl)bis(methanylylidene)) bis(azanylylidene)) diphenol (ADMPA), for Cd2+ was successfully developed based on 2,9-dimethyl-1,10-phenanthroline and o-aminophenol. ADMPA showed a remarkable fluorescence enhancement toward Cd2+ against other competing cations, owing to the suppression of the photo-induced electron transfer (PET) and CH![[double bond, length as m-dash]](https://www.rsc.org/images/entities/char_e001.gif) N isomerization. A good linear relationship (R2 = 0.9960) was obtained between the emission intensity of ADMPA and the concentration of Cd2+ (0.25–2.5 μM) with a detection limit of 29.3 nM, which was much lower than that reported in literature. The binding stoichiometry between ADMPA and Cd2+ was 2
N isomerization. A good linear relationship (R2 = 0.9960) was obtained between the emission intensity of ADMPA and the concentration of Cd2+ (0.25–2.5 μM) with a detection limit of 29.3 nM, which was much lower than that reported in literature. The binding stoichiometry between ADMPA and Cd2+ was 2![[thin space (1/6-em)]](https://www.rsc.org/images/entities/char_2009.gif) :
:![[thin space (1/6-em)]](https://www.rsc.org/images/entities/char_2009.gif) 1 as confirmed by the Job's Plot method, which was further confirmed by a 1H NMR titration experiment. Moreover, the ADMPA probe was successfully applied to detect Cd2+ in real water samples with a quick response time of only 6.6 s, which was about 3–40 times faster than the reported cadmium ion probe.
1 as confirmed by the Job's Plot method, which was further confirmed by a 1H NMR titration experiment. Moreover, the ADMPA probe was successfully applied to detect Cd2+ in real water samples with a quick response time of only 6.6 s, which was about 3–40 times faster than the reported cadmium ion probe.
Introduction
Cadmium is a highly toxic heavy metal that has been classified as a category I human carcinogen by the International Agency for Research on Cancer (IARC).1 Nowadays, cadmium contamination in the environment, as we all know, mainly comes from the emission from the industrial production of batteries, fertilizers, pigments, metallurgy and electroplates. In particular, in recent years, an increasing number of quantum dots containing cadmium have been synthesized and used widely in various laboratories. The pollution to the environment due to these quantum dots should not be neglected. However, the cadmium that enters the soil and water is absorbed by animals and plants, which can finally enter humans body through intake, thus posing a serious potential threat to human health.2–4 Moreover, the long-term exposure to cadmium-containing environments for humans or animals not only impedes the normal deposition of calcium in the bones and causes osteoporosis, but also impairs the normal function of the immune, nervous, renal and reproductive systems.5,6 Therefore, it is of great significance to develop a rapid and accurate method for the qualitative and quantitative detection of cadmium ions in environmental samples.To date, the primary means for detecting cadmium ions are atomic absorption spectrometry (AAS),7,8 inductively coupled plasma mass spectrometry (ICP-MS),9,10 electrochemical methods11–14 and microfluidic technologies.15 These detection methods have the advantages of high sensitivity, low detection limit and wide linear range. However, these methods have high maintenance costs and complicated sample pretreatment methods. In this regard, a fluorescent probe/sensor is a promising alternative route for metal ion and anion detection due to their advantages of an excellent selectivity, high sensitivity, low cost, handy operation and biological compatibility compared with other detection methods. Therefore, the fluorescent probe/sensor has attracted increasing attention for its design and development.16–22 Although cadmium ion fluorescent probes/sensors have been reported in literature,23–28 there are still some difficulties that need to be overcome such as the complicated synthesis procedure, poor water solubility and slow response speed.
In the present work, a simply synthesized, highly sensitive and fast responsive turn-on fluorescence probe for Cd2+ based on a photo-induced electron transfer (PET) and CH![[double bond, length as m-dash]](https://www.rsc.org/images/entities/char_e001.gif) N isomerization was successfully synthesized. The fluorescence characterization of the obtained probe towards metal ions was investigated in detail. The synthetic probe exhibited an evident fluorescence enhancement and quick response to Cd2+. Meanwhile, the binding stoichiometry and binding mechanism were also explored through the Job's Plot method, FT-IR characterization and 1H NMR titration experiment.
N isomerization was successfully synthesized. The fluorescence characterization of the obtained probe towards metal ions was investigated in detail. The synthetic probe exhibited an evident fluorescence enhancement and quick response to Cd2+. Meanwhile, the binding stoichiometry and binding mechanism were also explored through the Job's Plot method, FT-IR characterization and 1H NMR titration experiment.
Experimental section
Materials and apparatus
All reagents and solvents employed for the synthesis were purchased from commercial suppliers and used without further purification. ADMPA was dissolved in methanol at a concentration of 2 mM as a stock solution and stored in the refrigerator at 4 °C. All of the metal ions, including Ag+, Al3+, Ba2+, Be2+, Ca2+, Cd2+, Co2+, Cr3+, Cu2+, Fe2+, Fe3+, Hg2+, K+, Mg2+, Mn2+, Ni2+, Pb2+ and Zn2+ were in the chloride form or nitrate form. All the other reagents and solvents used in the synthesis and analysis were of analytical reagent grade and distilled water was used throughout the experiment.1H NMR and 13C NMR experiments were conducted on a Varian AS 400 MHz NMR system in DMSO-d6 with TMS as an internal standard. Elemental analyses for C, H and N were performed on a Vario EL III Organic Element Analyzer (Elementar, GER). The emission spectra were recorded on a FL-4600 spectrometer (Hitachi, Japan). The time-resolved fluorescence lifetime measurement was measured using a FLS920 transient fluorescence spectrometer (EI, UK). The FT-IR spectra were measured in the 4000–400 cm−1 range with KBr pellets on a Spectrum Two FT-IR spectrometer (PerkinElmer, USA). The mass spectral data for DMP-CHO was measured on a LCQ DECA XP MAX mass spectrometer (Thermo, USA).
Synthesis
Fluorescence characterization
![[thin space (1/6-em)]](https://www.rsc.org/images/entities/char_2009.gif) :
:![[thin space (1/6-em)]](https://www.rsc.org/images/entities/char_2009.gif) 7) solution. After mixing the fluorescent probe with metal ions properly, the fluorescence spectra of ADMPA was obtained on a FL-4600 spectrometer at room temperature. The excitation wavelength of the fluorescence spectrometer was set at 275 nm. The λex slit width was 2.5 nm, except for the quantitative determination experiments (5 nm). The λem slit width was 5 nm and the voltage was 700 V.
7) solution. After mixing the fluorescent probe with metal ions properly, the fluorescence spectra of ADMPA was obtained on a FL-4600 spectrometer at room temperature. The excitation wavelength of the fluorescence spectrometer was set at 275 nm. The λex slit width was 2.5 nm, except for the quantitative determination experiments (5 nm). The λem slit width was 5 nm and the voltage was 700 V.FT-IR characterization
For the FT-IR characterization, ADMPA powder, cadmium nitrate powder and potassium bromide powder were thoroughly mixed and ground at a mass ratio of 1![[thin space (1/6-em)]](https://www.rsc.org/images/entities/char_2009.gif) :
:![[thin space (1/6-em)]](https://www.rsc.org/images/entities/char_2009.gif) 0.5
0.5![[thin space (1/6-em)]](https://www.rsc.org/images/entities/char_2009.gif) :
:![[thin space (1/6-em)]](https://www.rsc.org/images/entities/char_2009.gif) 100, 1
100, 1![[thin space (1/6-em)]](https://www.rsc.org/images/entities/char_2009.gif) :
:![[thin space (1/6-em)]](https://www.rsc.org/images/entities/char_2009.gif) 1
1![[thin space (1/6-em)]](https://www.rsc.org/images/entities/char_2009.gif) :
:![[thin space (1/6-em)]](https://www.rsc.org/images/entities/char_2009.gif) 100, and 1
100, and 1![[thin space (1/6-em)]](https://www.rsc.org/images/entities/char_2009.gif) :
:![[thin space (1/6-em)]](https://www.rsc.org/images/entities/char_2009.gif) 2
2![[thin space (1/6-em)]](https://www.rsc.org/images/entities/char_2009.gif) :
:![[thin space (1/6-em)]](https://www.rsc.org/images/entities/char_2009.gif) 100. After grinding, these powders were dried in a vacuum oven at 50 °C overnight. Finally, ADMPA and the different mass ratios of ADMPA-Cd2+ were measured using a Spectrum Two FT-IR spectrometer (PerkinElmer, USA).
100. After grinding, these powders were dried in a vacuum oven at 50 °C overnight. Finally, ADMPA and the different mass ratios of ADMPA-Cd2+ were measured using a Spectrum Two FT-IR spectrometer (PerkinElmer, USA).
1H NMR titration experiments
For the 1H NMR titration experiments, 0, 0.25, 0.5 and 1.0 equiv. of Cd2+ were added into the ADMPA (4.18 mg, 0.01 mmol) DMSO-d6 solution to obtain different mole fractions of the ADMPA-Cd2+ complex. Then, the 1H NMR spectra of these solutions were recorded on a Varian 400 MHz NMR system.Recovery investigation
Tap water, Yanhu water and Zhujiang River (Guangzhou, China) water were filtered with a 0.22 μm microporous membrane and then mixed with DMF at a volume ratio of 7![[thin space (1/6-em)]](https://www.rsc.org/images/entities/char_2009.gif) :
:![[thin space (1/6-em)]](https://www.rsc.org/images/entities/char_2009.gif) 3. Owing to the low concentration level of Cd2+ in the real sample, the addition recovery method was adopted. The concentration of ADMPA and Cd2+ were fixed to 5 μM and 1 μM, respectively.
3. Owing to the low concentration level of Cd2+ in the real sample, the addition recovery method was adopted. The concentration of ADMPA and Cd2+ were fixed to 5 μM and 1 μM, respectively.
Results and discussion
Selectivity of the ADMPA probe towards Cd2+
The selectivity of the fluorescent probe is very important for the selective determination of target analytes. For this purpose, the recognition ability of the ADMPA probe was investigated via the fluorescence characterization towards metal ions, including Ag+, Al3+, Ba2+, Be2+, Ca2+, Cd2+, Co2+, Cr3+, Cu2+, Fe2+, Fe3+, Hg2+, K+, Mg2+, Mn2+, Ni2+, Pb2+ and Zn2+. As shown in Fig. 1, the ADMPA probe presented a fluorescence emission at 377 nm under an excitation wavelength of 275 nm. However, only Cd2+ ion produced a noticeable turn-on fluorescence response to ADMPA (Fig. 1, black line) when the same amount of ADMPA was added into above mentioned cations. This was attributed to the formation of a ADMPA-Cd2+ complex with a more rigid conjugated structure, which hindered the rotation of CH![[double bond, length as m-dash]](https://www.rsc.org/images/entities/char_e001.gif) N and the suppression of the photo-induced electron transfer (PET) quenching process that resulted in the chelation-enhanced fluorescence (CHEF) effect.31,32
N and the suppression of the photo-induced electron transfer (PET) quenching process that resulted in the chelation-enhanced fluorescence (CHEF) effect.31,32
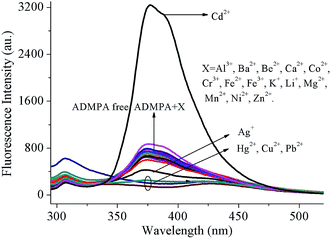 | ||
Fig. 1 Emission spectral changes for ADMPA (5 μM) induced by the addition of various metal ions (5 μM) in a DMF-water (v/v, 3![[thin space (1/6-em)]](https://www.rsc.org/images/entities/char_2009.gif) : :![[thin space (1/6-em)]](https://www.rsc.org/images/entities/char_2009.gif) 7) solution at room temperature. 7) solution at room temperature. | ||
In order to investigate if the probe/sensor could be applied to detect target analytes in complicated environmental samples, the selectivity and anti-interference capability were critical factors used to evaluate the properties of the chemosensor. Thus, to further investigate the anti-interference capability of the ADMPA probe towards Cd2+ against 18 other competitive metal ions, binding competition experiments were performed. It can be seen from Fig. 2 that the fluorescence emission intensity changes for ADMPA in a DMF-water (v/v, 3![[thin space (1/6-em)]](https://www.rsc.org/images/entities/char_2009.gif) :
:![[thin space (1/6-em)]](https://www.rsc.org/images/entities/char_2009.gif) 7) solution upon the addition of 2 equiv. of the other single metal ions (black bars). The results showed that most of the competing ions had no influence on the emission spectra of ADMPA apart from Cu2+ and Pb2+, which produced a certain fluorescence quenching after continuous treatment with 1 equiv. of Cd2+. This was attributed to the fact that Cu2+ and Pb2+ were in the same group of elements as Cd2+, which possessed the same charge and a similar electronic layer structure. Nevertheless, the quenching degree of the fluorescence intensity at 377 nm was relatively acceptable when the 18 mixed metal ions were added into the ADMPA-Cd2+ complex (Fig. S5†). All of the above mentioned phenomena strongly certified that ADMPA could be used as a highly selective and sensitive fluorescent ‘turn-on’ chemosensor for Cd2+.
7) solution upon the addition of 2 equiv. of the other single metal ions (black bars). The results showed that most of the competing ions had no influence on the emission spectra of ADMPA apart from Cu2+ and Pb2+, which produced a certain fluorescence quenching after continuous treatment with 1 equiv. of Cd2+. This was attributed to the fact that Cu2+ and Pb2+ were in the same group of elements as Cd2+, which possessed the same charge and a similar electronic layer structure. Nevertheless, the quenching degree of the fluorescence intensity at 377 nm was relatively acceptable when the 18 mixed metal ions were added into the ADMPA-Cd2+ complex (Fig. S5†). All of the above mentioned phenomena strongly certified that ADMPA could be used as a highly selective and sensitive fluorescent ‘turn-on’ chemosensor for Cd2+.
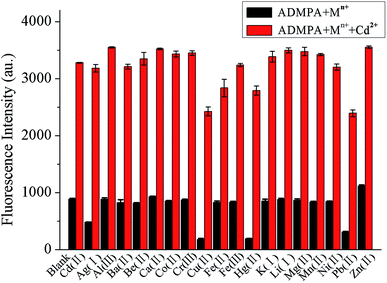 | ||
Fig. 2 The influence of single metal ions (10 μM) on the interaction between ADMPA (5 μM) and Cd2+ (5 μM) in a DMF-water (v/v, 3![[thin space (1/6-em)]](https://www.rsc.org/images/entities/char_2009.gif) : :![[thin space (1/6-em)]](https://www.rsc.org/images/entities/char_2009.gif) 7) solution. 7) solution. | ||
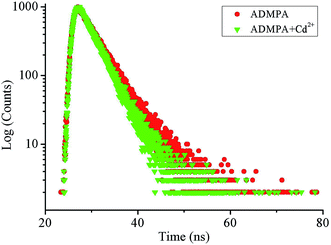
The fluorescence lifetime of the fluorescent molecular probe was closely related to its own structure and the micro-environment of the fluorescent probe. Researchers can directly understand the changes in the studied system by measuring the time-resolved fluorescence spectrum. Herein, the time-resolved fluorescence spectra of ADMPA and ADMPA-Cd2+ were measured. As shown in Fig. 3, the lifetime decays fit a single exponential decay profile with a lifetime of 3.78 ns (χ2 = 1.031) and 3.31 ns (χ2 = 1.072) for ADMPA and the ADMPA-Cd2+ complex, respectively, which were attributed to the inhibition of CH![[double bond, length as m-dash]](https://www.rsc.org/images/entities/char_e001.gif) N isomerization and the rearrangement of the charge rendered by the suppression of the photo-induced electron transfer (PET).
N isomerization and the rearrangement of the charge rendered by the suppression of the photo-induced electron transfer (PET).
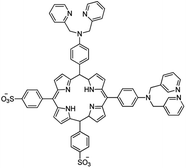
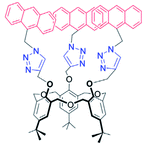
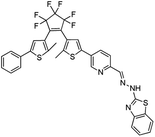
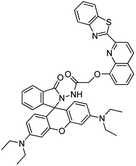
The response time for the probe towards the target is also an essential criteria for judging its performance, which determines whether it is suitable for on-site or/and on-line detection. Therefore, the response time for ADMPA towards Cd2+ was investigated by monitoring the fluorescence intensity change of ADMPA after the addition of Cd2+ on a FL-4600 fluorescence spectrophotometer. As shown in Fig. 4, it was clear that the fluorescence intensity of ADMPA sharply increased after the addition of an equal amount of Cd2+. Then, the signal remained roughly unchanged. It is worthwhile to note that the quick response time of ADMPA towards Cd2+ was only 6.6 s, which was 3–40 times faster than the reported cadmium ion probe (Table 1). The fast response time allows for the possibility of the on-site or on-time detection of Cd2+.
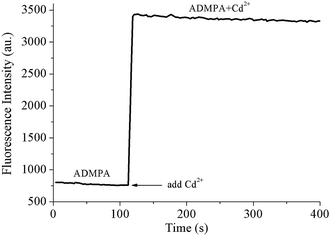 | ||
Fig. 4 On-line monitoring of the reaction velocity process for ADMPA (20 μM) and Cd2+ (20 μM) in a DMF-water (v/v, 3![[thin space (1/6-em)]](https://www.rsc.org/images/entities/char_2009.gif) : :![[thin space (1/6-em)]](https://www.rsc.org/images/entities/char_2009.gif) 7) solution. 7) solution. | ||
| Probe | Solvent | λex/λem | LOD (μM) | Response time | Ref. |
|---|---|---|---|---|---|
 |
DMSO/Tris–HCl (1![[thin space (1/6-em)]](https://www.rsc.org/images/entities/char_2009.gif) : :![[thin space (1/6-em)]](https://www.rsc.org/images/entities/char_2009.gif) 9) 9) |
620/639 | — | 20 s | 23 |
 |
HEPES | 418/611![[thin space (1/6-em)]](https://www.rsc.org/images/entities/char_2009.gif) 653 653 |
0.032 | 4 min | 24 |
 |
DMSO/H2O (1![[thin space (1/6-em)]](https://www.rsc.org/images/entities/char_2009.gif) : :![[thin space (1/6-em)]](https://www.rsc.org/images/entities/char_2009.gif) 1) 1) |
341/473 | 0.314 | — | 25 |
 |
ACN | 365/418 | 0.128 | — | 26 |
 |
ACN/HEPES (1![[thin space (1/6-em)]](https://www.rsc.org/images/entities/char_2009.gif) : :![[thin space (1/6-em)]](https://www.rsc.org/images/entities/char_2009.gif) 5) 5) |
400/561 | 0.010 | 0.3 min | 27 |
 |
MeOH/H2O (3![[thin space (1/6-em)]](https://www.rsc.org/images/entities/char_2009.gif) : :![[thin space (1/6-em)]](https://www.rsc.org/images/entities/char_2009.gif) 7) 7) |
400/485![[thin space (1/6-em)]](https://www.rsc.org/images/entities/char_2009.gif) 560 560 |
— | — | 33 |
 |
H2O | 460/567 | 0.01 | — | 34 |
 |
HEPES | 315/419 | 0.60 | — | 35 |
 |
ACN | 402/519 | 0.32 | — | 36 |
 |
ACN/HEPES (2![[thin space (1/6-em)]](https://www.rsc.org/images/entities/char_2009.gif) : :![[thin space (1/6-em)]](https://www.rsc.org/images/entities/char_2009.gif) 8) 8) |
308/590 | 0.010 | — | 37 |
 |
MeOH/H2O (1![[thin space (1/6-em)]](https://www.rsc.org/images/entities/char_2009.gif) : :![[thin space (1/6-em)]](https://www.rsc.org/images/entities/char_2009.gif) 4) 4) |
360/470![[thin space (1/6-em)]](https://www.rsc.org/images/entities/char_2009.gif) 585 585 |
0.27 | — | 38 |
 |
DMSO/HEPES (1![[thin space (1/6-em)]](https://www.rsc.org/images/entities/char_2009.gif) : :![[thin space (1/6-em)]](https://www.rsc.org/images/entities/char_2009.gif) 4) 4) |
460/511 | 0.077 | — | 39 |
 |
DMF/H2O (3![[thin space (1/6-em)]](https://www.rsc.org/images/entities/char_2009.gif) : :![[thin space (1/6-em)]](https://www.rsc.org/images/entities/char_2009.gif) 7) 7) |
275/377 | 0.029 | 6.6 s | This work |
Quantitative determination of Cd2+
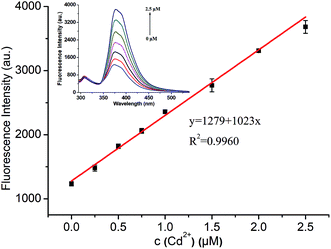
The fluorescence sensing properties of ADMPA towards Cd2+ were also explored by fluorescence titration experiments in a DMF-water (v/v, 3![[thin space (1/6-em)]](https://www.rsc.org/images/entities/char_2009.gif) :
:![[thin space (1/6-em)]](https://www.rsc.org/images/entities/char_2009.gif) 7) solution. As shown in Fig. 5, the fluorescence intensity of ADMPA (5 μM) at 377 nm gradually increased with the increase in the Cd2+ concentration. A good linear relationship (R2 = 0.9960) between the fluorescence spectra of ADMPA (5 μM) and the Cd2+ concentration was obtained from 0.025 to 2.5 μM with a detection limit of 29.3 nM according to the equation, DL = 3SD/S, where SD is the standard deviation of ten times the blank measurements and S is the slope of the calibration curve. The detection limit of ADMPA towards Cd2+ in this work was much lower than most values reported in literature (Table 1). Furthermore, the response time of ADMPA towards Cd2+ (6.6 s) was also much faster than reported literature (Table 1). Finally, the ADMPA probe was applied for the detection of Cd2+ in tap water, lake water and Zhujiang River water. Satisfactory recoveries between 97.72% and 101.1% with a RSD (n = 3) under 4.8% were obtained, which suggested that the proposed method possessed a good accuracy (Table 2 and S2†).
7) solution. As shown in Fig. 5, the fluorescence intensity of ADMPA (5 μM) at 377 nm gradually increased with the increase in the Cd2+ concentration. A good linear relationship (R2 = 0.9960) between the fluorescence spectra of ADMPA (5 μM) and the Cd2+ concentration was obtained from 0.025 to 2.5 μM with a detection limit of 29.3 nM according to the equation, DL = 3SD/S, where SD is the standard deviation of ten times the blank measurements and S is the slope of the calibration curve. The detection limit of ADMPA towards Cd2+ in this work was much lower than most values reported in literature (Table 1). Furthermore, the response time of ADMPA towards Cd2+ (6.6 s) was also much faster than reported literature (Table 1). Finally, the ADMPA probe was applied for the detection of Cd2+ in tap water, lake water and Zhujiang River water. Satisfactory recoveries between 97.72% and 101.1% with a RSD (n = 3) under 4.8% were obtained, which suggested that the proposed method possessed a good accuracy (Table 2 and S2†).
| Real sample | Added/μM | Detected/μM | Recovery/% | RSD/% (n = 3) |
|---|---|---|---|---|
| Tap water | 1.0 | 1.004 | 100.4 | 3.7 |
| Yanhu water | 1.0 | 1.011 | 101.1 | 2.6 |
| Zhujiang River water | 1.0 | 0.9772 | 97.72 | 4.8 |
Binding affinity of ADMPA to Cd2+
In order to explore the binding mode for the coordination of ADMPA and Cd2+, a Job's plot analysis was performed. As shown in Fig. 6, it was clear that the fluorescence intensity reached a maximum value when the molar ratio of [Cd2+]/[Cd2+] + [ADMPA] was about 0.33. This clearly suggested that the ratio of ADMPA bound with Cd2+ was 2![[thin space (1/6-em)]](https://www.rsc.org/images/entities/char_2009.gif) :
:![[thin space (1/6-em)]](https://www.rsc.org/images/entities/char_2009.gif) 1. The binding constant (Ka) for the ADMPA-Cd2+ complex was calculated with fluorescence titration spectra from Fig. 5 using a revised Benesi–Hildebrand equation:40,41 I0/I − I0 = (a/b − a)(1/Ka[C] + 1), where I0 and I are the fluorescence intensities of ADMPA at 377 nm in the absence and existence of Cd2+, respectively, a and b are constants, Ka is the association constant and [C] is the concentration of Cd2+.42 The calculated binding constant was 3.15 × 10⁵ M−1 from the plot of 1/(I − I0) against 1/[C] for Cd2+.
1. The binding constant (Ka) for the ADMPA-Cd2+ complex was calculated with fluorescence titration spectra from Fig. 5 using a revised Benesi–Hildebrand equation:40,41 I0/I − I0 = (a/b − a)(1/Ka[C] + 1), where I0 and I are the fluorescence intensities of ADMPA at 377 nm in the absence and existence of Cd2+, respectively, a and b are constants, Ka is the association constant and [C] is the concentration of Cd2+.42 The calculated binding constant was 3.15 × 10⁵ M−1 from the plot of 1/(I − I0) against 1/[C] for Cd2+.
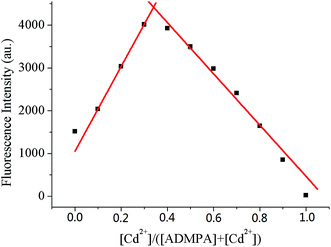 | ||
Fig. 6 Job's plot for determining the stoichiometry of ADMPA bound with Cd2+ in a DMF-water (v/v, 3![[thin space (1/6-em)]](https://www.rsc.org/images/entities/char_2009.gif) : :![[thin space (1/6-em)]](https://www.rsc.org/images/entities/char_2009.gif) 7) solution. The total concentration was 10 μM. 7) solution. The total concentration was 10 μM. | ||
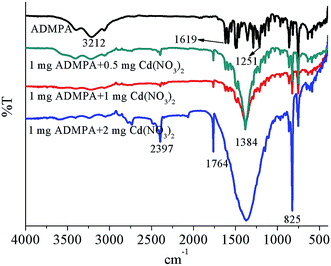
To further elucidate the mechanism for the binding modes between the ADMPA probe and Cd2+, FT-IR titration experiments for ADMPA towards Cd(NO3)2 were also performed. The infrared spectra for the ADMPA probe and different mass ratios of the ADMPA-Cd(NO3)2 complex were obtained. As shown in Fig. 7, there were apparent changes in the IR spectra between free ADMPA and ADMPA-Cd(NO3)2. Three distinct peaks for ADMPA at 3212 cm−1, 1619 cm−1 and 1251 cm−1 represented a O–H vibration, CH![[double bond, length as m-dash]](https://www.rsc.org/images/entities/char_e001.gif) N vibration and C–O vibration, respectively. Those peaks gradually disappeared in the spectrum of ADMPA-Cd(NO3)2 with the increase in the Cd(NO3)2 mass. Meanwhile, new peaks at 2397 cm−1, 1764 cm−1, 1383 cm−1 and 825 cm−1 appeared. Among them, the peak at 1764 cm−1 was obviously the stretching vibration peak of C
N vibration and C–O vibration, respectively. Those peaks gradually disappeared in the spectrum of ADMPA-Cd(NO3)2 with the increase in the Cd(NO3)2 mass. Meanwhile, new peaks at 2397 cm−1, 1764 cm−1, 1383 cm−1 and 825 cm−1 appeared. Among them, the peak at 1764 cm−1 was obviously the stretching vibration peak of C![[double bond, length as m-dash]](https://www.rsc.org/images/entities/char_e001.gif) O and the other three peaks were the characteristic peaks of CO2, NO3− and NO2−, respectively. These changes clearly implied that the phenolic hydroxyl and imine may have been involved in the complex reaction between ADMPA and Cd2+. Owing to the electron transfer from ADMPA to Cd2+, the double bond in C
O and the other three peaks were the characteristic peaks of CO2, NO3− and NO2−, respectively. These changes clearly implied that the phenolic hydroxyl and imine may have been involved in the complex reaction between ADMPA and Cd2+. Owing to the electron transfer from ADMPA to Cd2+, the double bond in C![[double bond, length as m-dash]](https://www.rsc.org/images/entities/char_e001.gif) O was formed and the fluorescence was enhanced.
O was formed and the fluorescence was enhanced.
For a better understanding, 1H NMR titration experiments were performed by adding various amounts of Cd2+ to ADMPA in DMSO-d6. As shown in Fig. 8, the peak for OH5 at 9.29 ppm gradually disappeared with the increase of Cd2+, while the signal for other hydrogen atoms at a different downfield shift changed from 0.04 ppm to 1.54 ppm (Table 3). These changes suggested that OH5 participated in the coordination of ADMPA towards Cd2+ and the formation of the complex changed the conjugated structure of ADMPA, causing a shift in the hydrogen atoms of the benzene ring and phenanthroline skeleton.
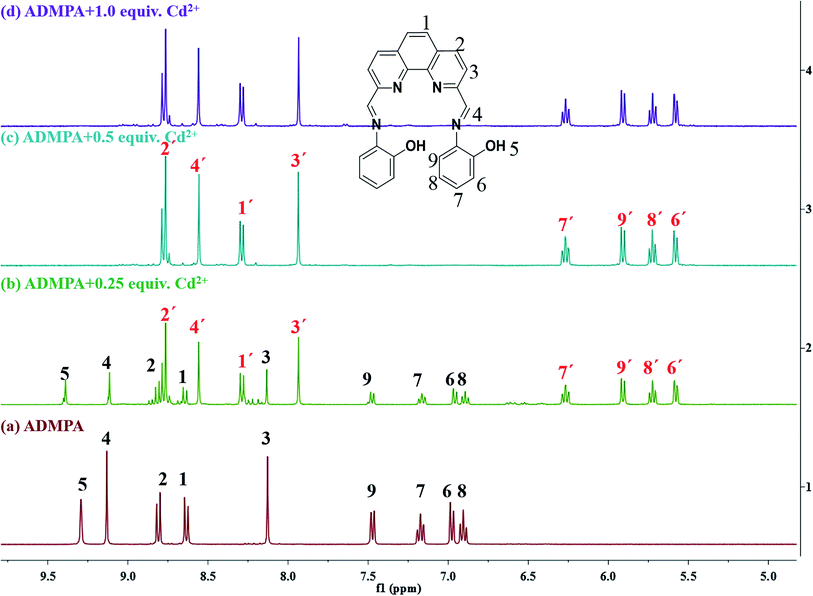 | ||
| Fig. 8 1H NMR titration of ADMPA and ADMPA with Cd2+ (DMSO-d6) for (a) ADMPA only, (b) ADMPA with 0.25 equiv. of Cd2+, (c) ADMPA with 0.5 equiv. of Cd2+ and (d) ADMPA with 1.0 equiv. of Cd2+. | ||
| H atom | ADMPA | ADMPA + Cd2+ (mole ratio 2![[thin space (1/6-em)]](https://www.rsc.org/images/entities/char_2009.gif) : :![[thin space (1/6-em)]](https://www.rsc.org/images/entities/char_2009.gif) 1) 1) |
Downfield shift |
|---|---|---|---|
| H1 | 8.62 | 8.30 | 0.32 |
| H2 | 8.80 | 8.76 | 0.04 |
| H3 | 8.13 | 7.93 | 0.20 |
| H4 | 9.13 | 8.56 | 0.57 |
| H5 | 9.29 | Disappear | — |
| H6 | 6.97 | 5.59 | 1.38 |
| H7 | 7.17 | 6.27 | 0.90 |
| H8 | 6.91 | 5.72 | 1.19 |
| H9 | 7.46 | 5.92 | 1.54 |
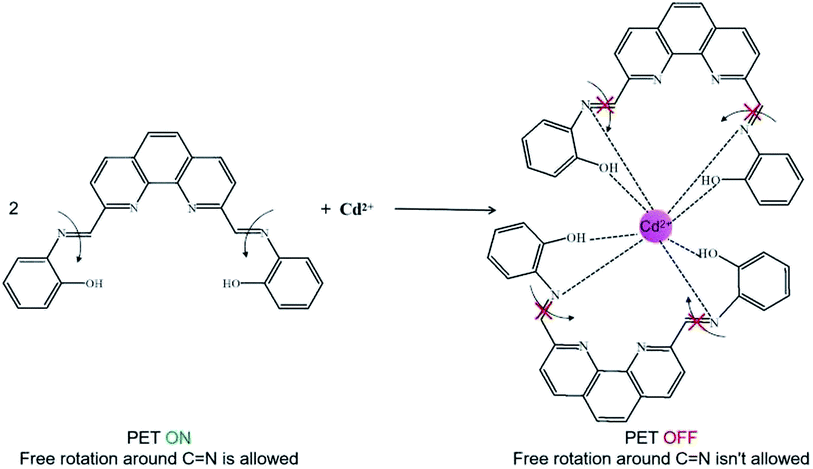
Based on the above results, a possible binding mode for ADMPA towards Cd2+ was proposed, as shown in Fig. 9. In the absence of Cd2+, the nitrogen atom of imine transferred an electron to the phenanthroline ring (PET ON) and the C![[double bond, length as m-dash]](https://www.rsc.org/images/entities/char_e001.gif) N group could rotate freely. When Cd2+ was added, the phenolic hydroxyl and neighboring imine nitrogen reacted with Cd2+, resulting in the restriction of the PET process and C
N group could rotate freely. When Cd2+ was added, the phenolic hydroxyl and neighboring imine nitrogen reacted with Cd2+, resulting in the restriction of the PET process and C![[double bond, length as m-dash]](https://www.rsc.org/images/entities/char_e001.gif) N isomerisation. Meanwhile, there was a full rearrangement in the charge distribution of the entire molecule, which increased the rigidity and turned the fluorescence on.
N isomerisation. Meanwhile, there was a full rearrangement in the charge distribution of the entire molecule, which increased the rigidity and turned the fluorescence on.
Conclusions
In conclusion, a highly-sensitive and fast responsive turn-on fluorescence ADMPA probe for Cd2+ detection was successfully developed based on 2,9-dimethyl- 1,10-phenanthroline and o-aminophenol. The binding mode of ADMPA and Cd2+ was confirmed by a Job's plot analysis and 1H NMR titration experiments with a ratio of 2![[thin space (1/6-em)]](https://www.rsc.org/images/entities/char_2009.gif) :
:![[thin space (1/6-em)]](https://www.rsc.org/images/entities/char_2009.gif) 1. The obtained ADMPA probe was applied for the detection of Cd2+ at a concentration as low as 29.3 nM in DMF-water. The proposed method was applied to detect Cd2+ in an actual sample with a satisfactory recovery. More importantly, the excellent response velocity provided a possibility for the real-time detection of Cd2+. Thus, the proposed method could be a promising alternative route for Cd2+ detection in environmental samples.
1. The obtained ADMPA probe was applied for the detection of Cd2+ at a concentration as low as 29.3 nM in DMF-water. The proposed method was applied to detect Cd2+ in an actual sample with a satisfactory recovery. More importantly, the excellent response velocity provided a possibility for the real-time detection of Cd2+. Thus, the proposed method could be a promising alternative route for Cd2+ detection in environmental samples.
Conflicts of interest
There are no conflicts to declare.Acknowledgements
This work was supported and sponsored by the National Natural Science Foundation of China (21677053 and 21876033).References
- M. Taki, M. Desaki, A. Ojida, S. Iyoshi, T. Hirayama, I. Hamachi and Y. Yamamoto, J. Am. Chem. Soc., 2008, 130(38), 12564–12565 CrossRef CAS PubMed.
- M. J. Mclaughlin and B. R. Singh, Cadmium in Soils and Plants. Springer Netherlands, 1999 Search PubMed.
- S. Satarug, J. R. Baker, S. Urbenjapol, M. Haswell-Elkins, P. E. B. Reilly, D. J. Williams and M. R. Moore, Toxicol. Lett., 2003, 137(1–2), 65–83 CrossRef CAS.
- S. Clemens, Biochimie, 2006, 88(11), 1707–1719 CrossRef CAS.
- L. Strumylaite, A. Kontrimaviciute, R. Kregzdyte and S. Ryselis, Epidemiology, 2003, 14(5), S54 CrossRef.
- X. Huo, C. W. Gu and X. Xu, J. Neurotrauma, 2008, 25(7), 881 Search PubMed.
- Z. Nazari, M. A. Taher and H. Fazelirad, RSC Adv., 2017, 7(71), 44890–44895 RSC.
- M. Sadeghi, E. Rostami, D. Kordestani, H. Veisi and M. Shamsipur, RSC Adv., 2017, 7(44), 27656–27667 RSC.
- J. White, A. Celik, R. Washington, V. Yilmaz, T. Mitchum and Z. Arslan, Microchem. J., 2018, 139, 242–249 CrossRef CAS.
- E. Begu, B. Snell and Z. Arslan, Microchem. J., 2019, 145, 412–418 CrossRef CAS.
- X. Y. Zheng, S. Chen, J. B. Chen, Y. H. Guo, J. Peng, X. C. Zhou, R. X. Lv, J. D. Lin and R. Y. Lin, RSC Adv., 2018, 8(14), 7883–7891 RSC.
- J. Z. Huang, S. L. Bai, G. Q. Yue, W. X. Cheng and L. S. Wang, RSC Adv., 2017, 7(45), 28556–28563 RSC.
- D. F. Qin, A. R. Chen, X. Mamat, Y. T. Li, X. Hu, P. Wang, H. Cheng, Y. M. Dong and G. Z. Hu, Anal. Chim. Acta, 2019, 1078, 32–41 CrossRef CAS.
- Y. S. Fang, B. Cui, J. Z. Huang and L. S. Wang, Sens. Actuators, B, 2019, 284, 414–420 CrossRef CAS.
- M. Kim, J. W. Lim, H. J. Kim, S. K. Lee, S. J. Lee and T. Kim, Biosens. Bioelectron., 2015, 65, 257–264 CrossRef CAS.
- S. Ellairaja, R. Manikandan, M. T. Vijayan, S. Rajagopal and V. S. Vasantha, RSC Adv., 2015, 5(78), 63287–63295 RSC.
- Q. Yang, J. H. Li, X. Y. Wang, H. L. Peng, H. Xiong and L. X. Chen, Biosens. Bioelectron., 2018, 112, 54–71 CrossRef CAS PubMed.
- P. A. Gale and C. Caltagirone, Coord. Chem. Rev., 2018, 354, 2–27 CrossRef CAS.
- L. Li, L. F. Liao, Y. P. Ding and H. Y. Zeng, RSC Adv., 2017, 7(17), 10361–10368 RSC.
- J. S. Wu, W. M. Liu, J. C. Ge, H. Y. Zhang and P. Wang, Chem. Soc. Rev., 2011, 40(7), 3483–3495 RSC.
- H. N. Kim, W. X. Ren, J. S. Kim and J. Yoon, Chem. Soc. Rev., 2012, 41(8), 3210–3244 RSC.
- D. Wu, A. C. Sedgwick, T. Gunnlaugsson, E. U. Akkaya, J. Yoon and T. D. James, Chem. Soc. Rev., 2017, 46(23), 7105–7123 RSC.
- T. Y. Cheng, T. Wang, W. P. Zhu, X. L. Chen, Y. J. Yang, Y. F. Xu and X. H. Qin, Org. Lett., 2011, 13(14), 3656–3659 CrossRef CAS.
- W. B. Huang, W. Gu, H. X. Huang, J. B. Wang, W. X. Shen, Y. Y. Lv and J. Shen, Dyes Pigm., 2017, 143, 427–435 CrossRef CAS.
- A. Sil, A. Maity, D. Giri and S. K. Patra, Sens. Actuators, B, 2016, 226, 403–411 CrossRef CAS.
- X. K. Jiang, Y. Ikejiri, C. C. Jin, C. Wu, J. L. Zhao, X. L. Ni, X. Zeng, C. Redshaw and T. Yamato, Tetrahedron, 2016, 72(32), 4854–4858 CrossRef CAS.
- S. Chithiraikumar, C. Balakrishnan and M. A. Neelakantan, Sens. Actuators, B, 2017, 249, 235–245 CrossRef CAS.
- S. S. Zehra, R. A. Khan, A. Alsalme and S. Tabassum, J. Fluoresc., 2019, 29(4), 1029–1037 CrossRef CAS PubMed.
- S. D. Gupta, B. Revathi, G. I. Mazaira, M. D. Galigniana, C. V. S. Subrahmanyam, N. L. Gowrishankar and N. M. Raghavendra, Bioorg. Chem., 2015, 59, 97–105 CrossRef PubMed.
- S. Ameerunisha and P. S. Zacharias, Polyhedron, 1994, 13(15–16), 2327–2332 CrossRef CAS.
- T. Sun, Q. F. Niu, Y. Li, T. D. Li and H. X. Liu, Sens. Actuators, B, 2017, 248, 24–34 CrossRef CAS.
- X. L. Yue, Z. Q. Wang, C. R. Li and Z. Y. Yang, Tetrahedron Lett., 2017, 58(48), 4532–4537 CrossRef CAS.
- W. P. Ye, S. X. Wang, X. M. Meng, Y. Feng, H. T. Sheng, Z. L. Shao, M. Z. Zhu and Q. X. Guo, Dyes Pigm., 2014, 101(1), 30–37 CrossRef CAS.
- Y. Liu, Q. Qiao, M. Zhao, W. T. Yin, L. Miao, L. Q. Wang and Z. C. Xu, Dyes Pigm., 2016, 133, 339–344 CrossRef CAS.
- X. J. Jiang, Y. Fu, H. Tang, S. Q. Zang, H. W. Hou, T. C. W. Mak and H. Y. Zhang, Sens. Actuators, B, 2014, 190(1), 844–850 CrossRef CAS.
- D. B. Zhang, S. Y. Li, R. M. Lu, G. Liu and S. Z. Pu, Dyes Pigm., 2017, 146, 305–315 CrossRef CAS.
- M. Maniyazagan, R. Mariadasse, J. Jeyakanthan, N. K. Lokanath, S. Naveen, K. Premkumar, P. Muthuraja, P. Manisankar and T. Stalin, Sens. Actuators, B, 2017, 238, 565–577 CrossRef CAS.
- K. Aich, S. Goswami, S. Das, C. Das Mukhopadhyay, C. K. Quah and H. K. Fun, Inorg. Chem., 2015, 54(15), 7309–7315 CrossRef CAS.
- S. B. Maity, S. Banerjee, K. Sunwoo, J. S. Kim and P. K. Bharadwaj, Inorg. Chem., 2015, 54(8), 3929–3936 CrossRef CAS.
- P. Madhu and P. Sivakumar, J. Mol. Struct., 2019, 1185, 410–415 CrossRef CAS.
- P. Ravichandiran, A. Boguszewska-Czubara, M. Masłyk, A. P. Bella, P. M. Johnson, S. A. Subramaniyan, K. S. Shim and D. J. Yoo, Dyes Pigm., 2020, 172, 107828 CrossRef CAS.
- R. Dwivedi, D. P. Singh, B. S. Chauhan, S. Srikrishna, A. K. Panday, L. H. Choudhury and V. P. Singh, Sens. Actuators, B, 2018, 258, 881–894 CrossRef CAS.
Footnote |
| † Electronic supplementary information (ESI) available. See DOI: 10.1039/c9ra06356k |
| This journal is © The Royal Society of Chemistry 2019 |


