 Open Access Article
A stimuli responsive triplet–triplet annihilation upconversion system and its application as a ratiometric sensor for Fe3+ ions†
Shuoran Chen a,
Fuming Chena,
Pengju Han
 *a,
Changqing Ye
 *a,
Suqin Huanga,
Lei Xua,
Xiaomei Wanga and
Yanlin Song
 b
b
aResearch Centre for Green Printing Nanophotonic Materials, Jiangsu Key Laboratory for Environmental Functional Materials, Institute of Chemistry, Biology and Materials Engineering, Suzhou University of Science and Technology, Suzhou 215009, P. R. China. E-mail: yechangqing@mail.usts.edu.cn
bKey Laboratory of Green Printing, Institute of Chemistry, Chinese Academy of Sciences, Beijing 100190, P. R. China
First published on 8th November 2019
Abstract
A ratiometric fluorescent sensor for the detection of Fe3+ ions is achieved based on triplet–triplet annihilation upconversion (TTA-UC) luminescence. A new anthracene derivative (named as DHTPA) is designed and synthesized and reveals similar optical properties to 9,10-diphenylanthracene (DPA) and is used as a stimuli responsive annihilator in a TTA-UC system due to its complexation ability. As a result, the UC emission can be significantly quenched by Fe3+ ions, while the phosphorescence (PL) emission of sensitizer palladium(II) octaetylporphyrin (PdOEP) remains nearly constant, which makes the PL signal an appropriate internal reference for the UC signal. The UC and ratio signals (IUC/IPL) both reveal a good linear relationship with Fe3+ ion concentration, which for the first time makes the TTA-UC system a perfect ratiometric sensor for Fe3+ ion detection. This sensing method will open a novel avenue to achieve ratiometric sensors in chemical and biological fields.
Introduction
As a class of trace elements, metals play significant roles in the constitution and metabolism of living organisms.1 The imbalance of metal elements can cause various diseases.2 As the main uptake form of iron, Fe3+ is the key component of haemoglobin and myoglobin for oxygen transport and of enzymes for metabolism balance of tissue cells.3 Nevertheless, long-term excess uptake of Fe3+ will cause detrimental effects to tissues and organs,4 eventually resulting in neurodegenerative diseases5 such as Alzheimer's6 and Parkinson's.7 Thus, it is of great significance to keep Fe3+ ions inside human and animal bodies at normal levels. Unfortunately, iron has been overly and inappropriately used in areas including manufacturing,8 architecture9 and agriculture,10 causing high concentrations of iron, mainly Fe3+, gradually emerging in living regions, especially in domestic water.11 Therefore, it is urgent to develop efficient methods for the detection of Fe3+ ions in environmental samples.Among all the reported strategies on Fe3+ detection including electrochemical process,12 atomic absorption spectrometry,13 nanosensors14 and fluorescent spectrometry,15 molecular fluorescent probes have attracted great research attention due to their high simplicity, selectivity, sensitivity and response rate. Selective weak interaction or complexation may occur between molecular probes and Fe3+ ions, leading to the change of molecular structure of the probes and the corresponding varying of the fluorescent signals (e.g. fluorescence intensity, shift or lifetime).16
In the past decades, considerable efforts have been devoted to the development of fluorescent probes for Fe3+ ions.17 The majority of the reported probes are based on traditional down-converting fluorescence of dyes excited under UV or visible irradiation,18 which have drawbacks including low media penetration and potential harm to human health. Besides, autofluorescence derived from fluorescent proteins19 or other biological fluorescein20 in the biological samples will in turn interfere the detection signals of the probes.21 Whereas, all above issues can be solved by using photoluminescent probes based on frequency upconversion (UC),22 which is a process converting low energy photons to higher ones. The long wavelength excitation brings good penetrability, which makes UC a useful probe in many complicated application environments. Besides, it can avoid the harm from common UV excitation irradiation, either to organism or chromophore structure.23 Among all the present mechanisms of UC, triplet–triplet annihilation upconversion (TTA-UC) has drawn widely research interests due to its relatively higher (>10%) quantum yield (QY) and lower (<10 mW cm−2) threshold excitation intensity (Ith).24 Particularly, TTA-UC is a double-dye system consisting of triplet sensitizers and annihilators, which may simultaneously cause two photoluminescent emissions from the two kinds of dyes. Briefly, when exciting light of specific wavelength irradiating the TTA-UC system, the UC luminescence through a triplet–triplet energy transfer (TTET) process from sensitizer to annihilator and the phosphorescence luminescence (PL) of sensitizer itself occur at the same time.25 Interestingly, the UC and PL signals may show different responsive behaviours to the external stimulus or environment, which makes a perfect foundation for a ratiometric sensor. It is well-known that ratiometric sensors can eliminate most of the influences like optical properties of solution, concentration of the fluorescent materials and other experimental or instrumental factors.26 Great efforts have been made on developing TTA-UC system as a ratiometric platform for sensing oxygen27 and temperature.28 However, to the best of our knowledge so far, there is still no report on a ratiometric sensor based on TTA-UC for metal-ion detection. This new strategy elaborately utilizes the double-dye nature of the TTA-UC system and does not need to add an external reference, because the UC and PL signals can be internal reference for each other.
Herein, we designed and synthesized a novel annihilator DHTPA to form a TTA-UC system with sensitizer PdOEP. The system can also be exploited as a ratiometric sensor for the detection of Fe3+ ions. While the UC signal was significantly quenched and showed a good linear relationship with the Fe3+ concentration, the PL signal remained constant. This ratiometric sensor also revealed a high selectivity and sensitivity (7.26 × 10⁻⁷ M) to Fe3+ ions. This method will provide a new angle to build ratiometric sensors for applications in chemical and biological areas.
Experimental
Materials
The compounds 4-bromo-2-hydroxybenzaldehyde (98%, Aladdin), 9,10-anthracenediboronic acid bis(pinacol) ester (97%, Aladdin), tetrakis(triphenylphosphine)palladium (Pd(PPh3)4) (99%, J&K), thiosemicarbazide (99%, Aladdin) and palladium(II) octaetylporphyrin (PdOEP) (Frontier) were used without further purification. The solvents ethanol, dichloromethane, toluene, 1,4-dioxane, petroleum ether and N,N-dimethylformamide (DMF) were of analytical grade and used as received. HEPES buffer solution (HyClone) was purchased from GE Healthcare Life Sciences. Water was deionized and distilled before use. Other chemicals were all purchased from Sinopharm Chemical Reagent Co., Ltd.Characterizations
IR spectra were measured on a Nicolet FT-IR 5DX instrument using solid samples dispersed in potassium bromide (KBr) disks. Mass spectra were measured on a Fourier transform ion cyclotron resonance mass spectrometer (FT-ICR-MS) produced by Bruker Company (bruker solarix X) with 2-[(2E)-3-(4-tert-butylphenyl)-2-methylprop-2-enylidene] malonitrile (DCTB) as the matrix. 1HNMR was measured on an INOVA-400 spectrometer with THF-d8 with the addition of ∼1 vol% hydrazine hydrate (N2H4·H2O) as solvent.Spectroscopic measurements
Absorption spectra were measured on a Shimadzu UV-2600 spectrophotometer. Steady-state fluorescence spectra were measured on an Edinburgh FLS920 fluorophotometer. UC fluorescence spectra were measured on an ideaoptics NOVA fiber spectrometer and an excitation CW laser (532 nm, 60 mW and 2 mm beam diameter).Synthesis
![[thin space (1/6-em)]](https://www.rsc.org/images/entities/char_2009.gif) :
:![[thin space (1/6-em)]](https://www.rsc.org/images/entities/char_2009.gif) 1, v/v). After refluxing for 48 h under nitrogen atmosphere, 9,10-anthracenediboronic acid bis(pinacol) ester was completely reacted. The mixture was then evaporated under reduced pressure and black powder was obtained. The crude powder was washed and extracted by saturated sodium chloride solution and dichloromethane, respectively. Column chromatography was used for separating the DHAPA after dehydrated by anhydrous sodium sulfate and the eluent was dichloromethane/petroleum ether (1
1, v/v). After refluxing for 48 h under nitrogen atmosphere, 9,10-anthracenediboronic acid bis(pinacol) ester was completely reacted. The mixture was then evaporated under reduced pressure and black powder was obtained. The crude powder was washed and extracted by saturated sodium chloride solution and dichloromethane, respectively. Column chromatography was used for separating the DHAPA after dehydrated by anhydrous sodium sulfate and the eluent was dichloromethane/petroleum ether (1![[thin space (1/6-em)]](https://www.rsc.org/images/entities/char_2009.gif) :
:![[thin space (1/6-em)]](https://www.rsc.org/images/entities/char_2009.gif) 1, v/v). Yellow powder was eventually obtained after recrystallization (1.2 g, yield 60%). IR (KBr, cm−1): 3164s (–OH), 1700s (C
1, v/v). Yellow powder was eventually obtained after recrystallization (1.2 g, yield 60%). IR (KBr, cm−1): 3164s (–OH), 1700s (C![[double bond, length as m-dash]](https://www.rsc.org/images/entities/char_e001.gif) O) (Fig. S1†). 1HNMR (400 MHz, chloroform-d) δ 11.29 (d, J = 2.9 Hz, 2H), 10.11 (s, 2H), 7.83 (d, J = 8.0, 2.7 Hz, 2H), 7.72–7.66 (m, 4H), 7.41 (d, J = 6.9, 3.3 Hz, 4H), 7.23–7.13 (m, 4H) (Fig. S4†).
O) (Fig. S1†). 1HNMR (400 MHz, chloroform-d) δ 11.29 (d, J = 2.9 Hz, 2H), 10.11 (s, 2H), 7.83 (d, J = 8.0, 2.7 Hz, 2H), 7.72–7.66 (m, 4H), 7.41 (d, J = 6.9, 3.3 Hz, 4H), 7.23–7.13 (m, 4H) (Fig. S4†).![[thin space (1/6-em)]](https://www.rsc.org/images/entities/char_2009.gif) :
:![[thin space (1/6-em)]](https://www.rsc.org/images/entities/char_2009.gif) 1, v/v) as eluent. 0.5 g faint yellow powder was obtained with yield of 37%. IR (KBr, cm−1): 3188s (–OH), 1635s (C
1, v/v) as eluent. 0.5 g faint yellow powder was obtained with yield of 37%. IR (KBr, cm−1): 3188s (–OH), 1635s (C![[double bond, length as m-dash]](https://www.rsc.org/images/entities/char_e001.gif) N) (Fig. S2†). MS (FT-ICR): C30H24N6O2S2 [M+] 564.14; found 565.15 (Mz) with the isotopic patterns for the corresponding molecular ions (Fig. S3†).1H NMR (400 MHz, DMSO-d6) δ 11.47 (s, 2H), 10.19 (s, 2H), 8.55 (s, 2H), 8.27–7.95 (m, 6H), 7.73–7.63 (m, 4H), 7.46 (d, J = 8.3 Hz, 4H), 7.02–6.82 (m, 4H) (Fig. S5†). Elemental analysis: measuring result (%): C (64.20), H (4.03), N (14.48), S (11.04); calculated result (%): C (63.83), H (4.29), N (14.88), S (11.33).
N) (Fig. S2†). MS (FT-ICR): C30H24N6O2S2 [M+] 564.14; found 565.15 (Mz) with the isotopic patterns for the corresponding molecular ions (Fig. S3†).1H NMR (400 MHz, DMSO-d6) δ 11.47 (s, 2H), 10.19 (s, 2H), 8.55 (s, 2H), 8.27–7.95 (m, 6H), 7.73–7.63 (m, 4H), 7.46 (d, J = 8.3 Hz, 4H), 7.02–6.82 (m, 4H) (Fig. S5†). Elemental analysis: measuring result (%): C (64.20), H (4.03), N (14.48), S (11.04); calculated result (%): C (63.83), H (4.29), N (14.88), S (11.33).Preparation of UC solutions
DHTPA (60 mM) and PdOEP (30 mM) were dissolved in mixed solvents of 10 mL DMF and 5 mL water as a stock solution. Then the solution was nitrogen-bubbled for 40 min and then sealed and stored in dark for further measurements.Detection of the Fe3+ ions by a TTA-UC ratiometric sensor
The TTA-UC based ratiometric sensor was formed by the double-dye TTA-UC solution consisting of responsive annihilator DHTPA and sensitizer PdOEP. Different amount of Fe3+ ions were added into the TTA-UC solution to build environment with varying Fe3+ concentrations, respectively. UC spectrum of each sample excited by a CW 532 nm laser (60 mW power and 2 mm beam diameter) was recorded after 10 min of reaction. The peak area integrations of UC (458 nm) and PL (665 nm) emissions in all the spectra were calculated.For a contrast experiment, the typical fluorescence spectra of DHTPA excited by 398 nm UV light under different Fe3+ concentrations were also recorded after 10 min of reaction. The peak area integrations of fluorescent (455 nm) emissions in all the spectra were calculated.
The pH responsiveness of the TTA-UC ratiometric sensor was measured under different pH environment (pH = 4–11). The pH value was adjusted by adding different amount of hydrogen chloride or sodium hydroxide in the solution. All the UC spectra of different conditions were recorded and the peak area integrations of UC were calculated and compared.
The selectivity for Fe3+ ions was measured by adding other types of metal ions (Mn2+, NH4+, Zn2+, Mg2+, Cd2+, Pb2+, Li+, Na+, K+, Ag+, Ca2+) into the TTA-UC solution after 10 min of reaction, respectively. The concentration of different metal ions in these samples were all the same. It should be pointed out that except silver nitrate, soluble chlorides were also added in this step to avoid the influence of anions. All detection experiments were performed at room temperature. In order to avoid the influence of changing pH values, which are caused by different types of metal salts, on the UC intensities of the detecting sample, proper amount of buffer solution was added into the system.
Results and discussion
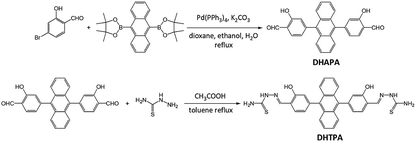
Fig. 1 shows the synthetic route of DHTPA. The intermediate compound DHAPA was synthesized through a Suzuki coupling reaction between 4-bromo-2-hydroxybenzaldehyde and 9,10-anthracenediboronic acid bis(pinacol) ester. The IR spectrum and 1HNMR spectrum are revealed in Fig. S1 and S4,† respectively. Subsequently, aldehyde-ammonia condensation reaction between DHAPA and thiosemicarbazide occurred and yielded the responsive annihilator DHTPA. The IR spectrum, mass spectrum and 1HNMR spectrum are shown in Fig. S2, S3 and S5,† respectively.The normalized absorption and steady-state photoluminescence spectra of DHTPA and PdOEP in DMF are shown in Fig. 2. There are three main peaks (344, 378 and 398 nm) in the absorption spectra of DHTPA (Fig. 2a). The probe molecule DHTPA exhibits one-peak fluorescent emission at 455 nm. Fig. 2b shows that as a classic metalloporphyrin complex sensitizer, PdOEP possesses a Soret absorption band at 395 nm and a Q-band at 547 nm and also reveals PL emission at 655 nm when excited by a 532 nm laser.
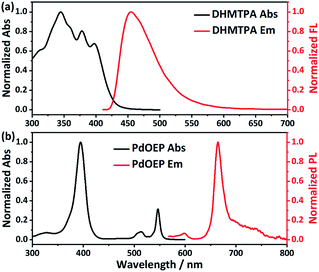 | ||
| Fig. 2 Normalized absorption and steady-state photoluminescence spectra of (a) DHTPA and (b) PdOEP in DMF at room temperature. | ||
UC spectrum of DHTPA/PdOEP solution is shown in Fig. 3. The UC emission is at 458 nm under excitation of 532 nm, and meanwhile the PL emission of PdOEP is at 665 nm. To enhance the absolute intensity of UC emission from DHTPA and obtain a relatively higher SNR (signal to noise ratio) for the sensor, the ratio of PdOEP/DHTPA was investigated by fixing DHTPA concentration and increasing PdOEP concentration (Fig. S6†). The ratio of PdOEP/DHTPA was 1![[thin space (1/6-em)]](https://www.rsc.org/images/entities/char_2009.gif) :
:![[thin space (1/6-em)]](https://www.rsc.org/images/entities/char_2009.gif) 2 when UC intensity reached the maximum. In order to eliminate the disturbance of pH changing during the detection of metal ions and to find an optimal operating condition, the integrated UC intensity of DHTPA/PdOEP system at different pH environments were measured and shown in the inset of Fig. 3. It is found that the UC intensity nearly remains constant and maximal under the pH from 6 to 9, which reveals that the sensor can be fully functional in a relatively broad neutral pH range, exhibiting a possibility of applications in biological field.
2 when UC intensity reached the maximum. In order to eliminate the disturbance of pH changing during the detection of metal ions and to find an optimal operating condition, the integrated UC intensity of DHTPA/PdOEP system at different pH environments were measured and shown in the inset of Fig. 3. It is found that the UC intensity nearly remains constant and maximal under the pH from 6 to 9, which reveals that the sensor can be fully functional in a relatively broad neutral pH range, exhibiting a possibility of applications in biological field.
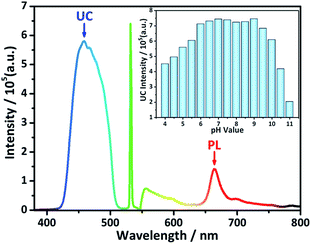 | ||
| Fig. 3 UC emission spectrum of DHTPA/PdOEP system; inset: histogram of integrated UC intensity under different pH environments. | ||
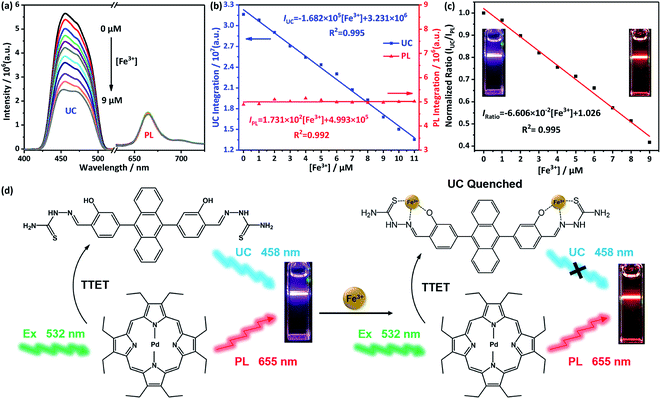
The UC emission spectra of DHTPA/PdOEP system at environments of different concentration of Fe3+ ions are shown in Fig. 4a. All the spectra were recorded after the spectral signals are stable, since the reaction between DHTPA and Fe3+ ions would stop in 10 min (Fig. S7†). As a result, the Fe3+ ions have a great quenching effect on UC emission and meanwhile barely no influence on PL emission. Before adding Fe3+ ions, the blank sample displays purple emission light when excited by 532 nm laser. As the Fe3+ ions are added, the UC emission is effectively quenched and emission colour turn into red (insets of Fig. 4c). The obvious colour change can be easily distinguished by naked eyes. Interestingly, both the UC and PL emission intensities reveal good linear relationships with concentration of Fe3+ ions (Fig. 4b), which makes the DHTPA/PdOEP TTA-UC system a perfect candidate for ratiometric sensors. Particularly, the PL intensity shows nearly no change through the concentration increasing of Fe3+ ions, making it a very appropriate internal reference for UC signal. Finally, a good linear relationship (R2 = 0.995) between ratio intensity (IUC/IPL) and Fe3+ concentration (0–9 μM) is shown in Fig. 4c, yielding an effective ratiometric sensor for Fe3+ ion detection (Fig. 4d). As shown in Fig. 4d, the TTET process still existed after adding Fe3+ ions into the system, which can be verified by Fig. S8 and S9.† When varying the amount of added Fe3+ ions (0–10 μM), the absorption spectra of DHTPA are almost constant (Fig. S8†). The changing of PL lifetime of PdOEP can reflect the environments in the solution (Fig. S9†). When only PdOEP was added in the solution, the PL lifetime was relatively long. After adding DHTPA, the PL lifetime reduced obviously due to the emerging of TTET process. At last, Fe3+ ions (10 μM) were added into the solution, and the PL lifetime did not change much. If the TTET can be blocked by Fe3+ ions, the PL lifetime should increase obviously. In that case, the Fe3+ ions do not affect the TTET process, which also provides evidence to contant PL intensity.
The limit of detection (LOD) of this ratiometric sensor is 7.26 × 10⁻⁷ M, calculated by using eqn (S1).† Because of the presence of internal reference, ratiometric sensors can eliminate the negative influence from the devices, environment or probes themselves on the detecting results, improving the selectivity, sensitivity and stability of the sensor.29
In order to further prove the responsive nature of DHTPA to Fe3+ ions, the fluorescent emission of DHTPA dependent on Fe3+ ions is also investigated, and the results are shown in Fig. S10.† The fluorescence of DHTPA can also be quenched by Fe3+ ions (0–9 μM), and its intensity exhibits good linear relationship with Fe3+ concentration, yielding a normal one-channel Fe3+ sensor based on a fluorescent probe. The binding constant Ka of the complexing reaction derived from titration data in Fig. 4a and S6† are calculated based on Benesi–Hildebrand equation (Fig. S11†).30 The Ka from the UC signal is 2.218 × 10⁴ M−1, while the Ka from the FL signal is 2.536 × 10⁴ M−1. The similar Ka indicates that although different probes were used for Fe3+ sensing, the reaction between the metal ions and DHTPA is pretty much the same in the two situations.
The selectivity of the ratiometric sensor is shown in Fig. 5. The responsiveness of UC emission of DHTPA/PdOEP system to twelve types of metal ions (Fe3+, Mn2+, NH4+, Zn2+, Mg2+, Cd2+, Pb2+, Li+, Na+, K+, Ag+, Ca2+) is thoroughly studied. The results show that among those metal ions, only Fe3+ has a significant quenching effect on the UC emission (Fig. 5a). The quenching ratio of the Fe3+ ions is up to 64.8%, while no other metal ions are more than 4% (Fig. 5b), which shows a highly selectivity of the ratiometric sensor to Fe3+ among 12 types of metal ions.
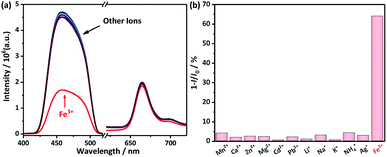 | ||
| Fig. 5 (a) UC emission spectra of DHTPA/PdOEP system at environments of different types of metal ions (10 μM); (b) histogram of quenching ratio calculated from UC emissions in (a). | ||
The mechanism of the responsiveness of UC emission to Fe3+ ions is due to the complexation between Fe3+ and DHTPA, which turned the fluorescent “D–π–D” structure into non-fluorescent “A–π–A” structure. The selectivity reveals that Fe3+ ions have stronger complex strength and faster complex reaction dynamics, yielding the DHTPA/PdOEP TTA-UC system a highly selective and effective ratiometric sensor for Fe3+ ions.
For the future perspective, since the oxygen sensitivity is an unavoidable issue in TTA-UC system, solutions must be considered to develop TTA-UC based ratiometric sensor with long term stability. So far great efforts have been made in solid-state UC materials and deoxygenating solvents,24 which will authentically make the TTA-UC material a promising candidate for sensing applications.
Conclusions
In conclusion, we designed and synthesized a new responsive annihilator DHTPA to form a TTA-UC system by combining PdOEP as sensitizer. When excited by a 532 nm green laser, blue UC emission and red PL emission were simultaneously obtained from the TTA-UC system. Because of the complexation between DHTPA and Fe3+ ions, UC emission can be significantly quenched and show linear relationship with Fe3+ concentration increasing. Meanwhile, the PL showed no responsive behaviour to Fe3+ ions and remained constant. By regarding PL signal as an internal reference for UC signal, the TTA-UC system can be employed as a ratiometric sensor for the detection of Fe3+ ions. The ratio signal also revealed good linear relationship (R2 = 0.995) with Fe3+ concentration (0–9 μM). The LOD of the ratiometric sensor is 7.26 × 10⁻⁷ M, and it showed highly selectivity to Fe3+ ions among twelve types of metal ions. The double-chromophore nature of TTA-UC system exhibited multiple emissions with different responsive behaviour, making it a perfect candidate for ratiometric sensor. This sensing method will provide a new angle for preparing ratiometric sensors for applications in many areas.Conflicts of interest
There are no conflicts to declare.Acknowledgements
This work was supported by National Natural Science Foundation of China (Grant No. 51603141, 51873145, 51673143); Natural Science Foundation of Jiangsu Province (BK20160358); Natural Science Foundation of Jiangsu Province Excellent Youth Foundation (BK20170065); Natural Science Foundation of the Higher Education Institutions of Jiangsu Province; 5th 333 High-level Talents Training Project of Jiangsu Province (No. BRA2018340); Six Talent Summits Project of Jiangsu Province (No. XCL-79); Qing Lan Project; Suzhou Key Laboratory for Nanophotonic and Nanoelectronic Materials and Its Devices (SZS201812).References
- B. L. Logeman and D. J. Thiele, J. Biol. Chem., 2018, 293, 15497 CrossRef CAS; Y. Z. Lu, L. Fu, N. Li, J. Ding, Y. N. Bai, P. Samaras and R. J. Zeng, Chemosphere, 2018, 198, 370 CrossRef; X. W. Huang, É. Boutroy, S. Makvandi, G. Beaudoin, L. Corriveau and A. F. D. Toni, Miner. Deposita, 2019, 54, 525 CrossRef.
- Y. Peng, H. Huang, Y. Zhang, C. Kang, S. Chen, L. Song, D. Liu and C. Zhong, Nat. Commun., 2018, 9, 187 CrossRef.
- G. Mun, S. H. Jung, A. Ahn, S. S. Lee, M. Y. Choi, D. H. Kim, J. Y. Kim and J. H. Jung, RSC Adv., 2016, 6, 53912 RSC; A. Yazdanpanah, D. S. M. Ghasimi, G. K. Min, G. Nakhla, H. Hafez and M. Keleman, Environ. Sci. Pollut. Res., 2018, 25, 29240 CrossRef CAS; P. A. Sharp, B. Sugden and J. Sambrook, Biochemistry, 1973, 12, 3055 CrossRef; M. Tsubaki, R. B. Srivastava and N. T. Yu, Biochemistry, 1982, 21, 1132 CrossRef; F. W. Outten and O. G. Djaman, Mol. Microbiol., 2010, 52, 861 CrossRef.
- T. A. Rouault, Nat. Chem. Biol., 2006, 2, 406 CrossRef CAS.
- L. Zecca, M. B. Youdim, P. Riederer, J. R. Connor and R. R. Crichton, Nat. Rev. Neurosci., 2004, 5, 863 CrossRef CAS.
- S. Mandel, T. Amit, O. Baram and M. B. Youdim, Prog. Neurobiol., 2007, 82, 348 CrossRef CAS PubMed.
- D. Benshachar, P. Riederer and M. B. Youdim, J. Neurochem., 2010, 57, 1609 CrossRef.
- A. M. Martinez, A. Støre and K. S. Osen, Metall. Mater. Trans. B, 2018, 49, 783 CrossRef CAS.
- L. Kai, L. Yao, W. Fang, J. Ren and H. Xie, Constr. Build. Mater., 2018, 178, 144 CrossRef.
- B. V. D. Grift, L. Osté, P. Schot, A. Kratz, E. V. Popta, M. Wassen and J. Griffioen, Sci. Total Environ., 2018, 631–632, 115 CrossRef.
- Q. Zhang, Z. Wei, Y. Cui, C. Lyu, L. Tong, R. Zhang, Z. Rui, J. Zheng, Z. Shi and C. Lu, Environ. Sci.: Nano, 2018, 5, 246 RSC.
- B. Haghighi and A. Safavi, Anal. Chim. Acta, 1997, 354, 43 CrossRef CAS.
- R. C. d. C. C. A. NovaAraújo, Anal. Chim. Acta, 2001, 438, 227 CrossRef.
- S. Thatai, P. Khurana, S. Prasad and D. Kumar, Microchem. J., 2014, 113, 77 CrossRef CAS.
- J. Yu, C. Liu, K. Yuan, Z. Lu, Y. Cheng, L. Li, X. Zhang, P. Jin, F. Meng and H. Liu, Nanomaterials, 2018, 8, 233 CrossRef.
- Y. c. Gonül, S. Elif, D. Mahmut, Y. Fatma and K. Adem, Dalton Trans., 2013, 42, 14916 RSC.
- D. Song, E. Ma, Z. M. Sun and H. Zhang, J. Mater. Chem., 2012, 22, 16920 RSC; C. X. Yang, H. B. Ren and X. P. Yan, Anal. Chem., 2013, 85, 7441 CrossRef CAS; M. Zhu, C. Shi, X. Xu, Z. Guo and W. Zhu, RSC Adv., 2016, 6, 100759 RSC; J. Li, Q. Wang, Z. Guo, H. Ma, Y. Zhang, B. Wang, B. Du and Q. Wei, Sci. Rep., 2016, 6, 23558 CrossRef.
- M. Zhao, X. Zhou, J. Tang, Z. Deng, X. Xu, Z. Chen, X. Li, L. Yang and L. J. Ma, Spectrochim. Acta, Part A, 2017, 173, 235 CrossRef CAS.
- J. Nakai, M. Ohkura and K. Imoto, Nat. Biotechnol., 2001, 19, 137 CrossRef CAS.
- Y. Zhou, E. M. Marcus, R. P. Haugland and M. Opas, J. Cell. Physiol., 2010, 164, 9 CrossRef.
- Y. Chen, T. Zhang, X. Gao, W. Pan, N. Li and B. Tang, Chin. Chem. Lett., 2017, 28, 1983 CrossRef CAS.
- J. Zhao, S. Ji and H. Guo, RSC Adv., 2011, 1, 937 RSC; S. Liu, S. Liu, M. Zhou, X. Ye, D. Hou and W. You, RSC Adv., 2017, 7, 36935 RSC; Q. Zhang, Z. Han, J. Tao, W. Zhang, P. Li, L. Tang and Y. Gu, J. Biophotonics, 2018, 11, 1 Search PubMed; L. J. Xiang, H. H. Zhang, H. Li, L. Kong, H. P. Zhou, J. Y. Wu, Y. P. Tian, J. Zhang and Y. F. Mao, Nanoscale, 2017, 9, 18861 RSC; C. Ye, J. Ma, P. Han, S. Chen, P. Ding, B. Sun and X. Wang, RSC Adv., 2019, 9, 17691 RSC.
- X. Yang, J. Han, Y. Wang and P. Duan, Chem. Sci., 2019, 10, 172 RSC; D. Yang, P. Duan and M. Liu, Angew. Chem., Int. Ed., 2018, 57, 9357 CrossRef CAS.
- J. Ma, S. Chen, C. Ye, M. Li, T. Liu, X. Wang and Y. Song, Phys. Chem. Chem. Phys., 2019, 21, 14516 RSC; W. Bao, B. Sun, X. Wang, C. Ye, D. Ping, Z. Liang, Z. Chen, X. Tao and L. Wu, J. Phys. Chem. C, 2014, 118, 141 Search PubMed; C. Ye, J. Wang, X. Wang, P. Ding, Z. Liang and X. Tao, Phys. Chem. Chem. Phys., 2016, 18, 3430 RSC; C. Ye, L. Zhou, X. Wang and Z. Liang, Phys. Chem. Chem. Phys., 2016, 18, 10818 RSC.
- C. Ye, J. Ma, S. Chen, G. Jie and Y. Zhou, J. Phys. Chem. C, 2017, 121, 20158 CrossRef CAS; C. Ye, S. Chen, F. Li, J. Ge, P. Yong, M. Qin and Y. Song, Acta Chim. Sinica, 2018, 76, 237 CrossRef.
- R. Zhang, F. Yan, Y. Huang, D. Kong, Q. Ye, J. Xu and L. Chen, RSC Adv., 2016, 6, 50732 RSC.
- S. M. Borisov, C. Larndorfer and I. Klimant, Adv. Funct. Mater., 2012, 22, 4360 CrossRef CAS.
- M. Xu, X. Zou, Q. Su, W. Yuan, C. Cao, Q. Wang, X. Zhu, W. Feng and F. Li, Nat. Commun., 2018, 9, 2698 CrossRef; N. Nazarova, Y. Avlasevich, K. Landfester and S. Baluschev, ChemPhotoChem, 2019, 3, 1 CrossRef.
- P. Xiaojun, Y. Zhigang, W. Jingyun, F. Jiangli, H. Yanxia, S. Fengling, W. Bingshuai, S. Shiguo, Q. Junle and Q. Jing, J. Am. Chem. Soc., 2011, 133, 6626 CrossRef.
- H. A. Benesi and J. H. Hildebrand, J. Am. Chem. Soc., 1949, 71, 2703 CrossRef CAS.
Footnote |
| † Electronic supplementary information (ESI) available. See DOI: 10.1039/c9ra06524e |
| This journal is © The Royal Society of Chemistry 2019 |

