 Open Access Article
Enhancing the adsorption capability of areca leaf biochar for methylene blue by K2FeO4-catalyzed oxidative pyrolysis at low temperature
Zhibing Yinab,
Nian Liuab,
Siyao Bianab,
Jihui Li *ab,
Shuying Xu*ab and
Yucang Zhangab
aKey Laboratory of Ministry of Education for Advanced Materials in Tropical Island Resources, College of Materials and Chemical Engineering, Hainan University, Haikou 570228, China. E-mail: lijihui@hainanu.edu.cn; xushuying1980@hainanu.edu.cn
bHainan Provincial Key Lab of Fine Chem, College of Materials and Chemical Engineering, Hainan University, Haikou 570228, China
First published on 20th December 2019
Abstract
Catalytic oxidative pyrolysis is a promising method for the preparation of highly adsorptive biochar by introducing oxygen-containing groups. Here, a K2FeO4-catalyzed oxidative pyrolysis was described for enhancing the adsorption capability of areca leaf biochar toward methylene blue at low temperature. It was shown that the maximum adsorption capacity of the biochar pyrolyzed at 200 °C was greatly improved from 122.67 to 251.95 mg g−1 with the catalysis of K2FeO4 due to the introduction of surface oxygen-containing groups. In addition, a high adsorption capability was observed over a wide pH range for the K2FeO4-modified biochar and nearly neutral pH was obtained after adsorption, further demonstrating the great advantages of K2FeO4-catalyzed oxidative pyrolysis. Mechanistic studies revealed that the adsorption of the pristine biochar was mainly determined by hydrogen bonding and electrostatic interaction. Whereas, the adsorption of the K2FeO4-modified biochar was attributed to cation exchange besides hydrogen bonding and electrostatic interactions.
1. Introduction
Biochar, a carbon-rich material made by thermal conversion of biomass under limited oxygen atmosphere, has attracted increasing attention as a green and low-cost adsorbent for environmental remediation.1–3 Generally, pristine biochar can be easily prepared by conventional pyrolysis, gasification, torrefaction and hydrothermal carbonization,4–7 but suffered from low adsorption capability.8 For expanding the application of biochar, acid, alkaline, oxidation and mineral-impregnation modifications have been developed for improving the adsorption capability of biochar in the past decay.9–12 However, excessive chemicals are usually employed,9 causing potential pollution during preparation. Moreover, relatively high pyrolysis temperature is required, causing high energy consumption and loss of functional groups which play an important role in adsorption.13 Thus, green modification with low pyrolysis temperature is highly pursued for enhancing the adsorption capability of biochar.Catalytic pyrolysis, an efficient technology for accelerating carbonization of biomass using a catalytic amount of promoter,14 can be a green method for preparation of biochar. However, it is a challenge to make highly adsorptive biochar via catalytic pyrolysis as easily causing loss of surface functional groups even at low temperature. Comparing with other catalytic pyrolysis, catalytic oxidative pyrolysis can produce additional oxygen-containing groups, thereby cover the shortage of functional group decrease. Anyhow, it is of vital importance to find out a highly active catalyst for the preparation of highly adsorptive biochar. An efficient oxidation catalyst can promote oxidative carbonization of biomass to generate surface functional group-rich biochar at low temperature. To the best of our knowledge, no catalytic oxidative pyrolysis has been developed for improving the adsorption capability of biochar by now.
Methylene blue (MB), a common toxic and coloured pollutant, is widely present in wastewater discarded from printing, paper and textile industries.15,16 MB can be persisted for a long time even exposure to light and water, causing serious threat not only to human health but also to environment.17–19 Great advance has been made for removal of MB using biochar as adsorbent over the past decade.6,16,17 Especially, the ZnCl2,20 H2O2![[thin space (1/6-em)]](https://www.rsc.org/images/entities/char_2009.gif) 21,22 and NaOH-engineered23 biochars were prepared for removal of MB from aqueous solution due to their relatively high adsorption capabilities. Yet, largely excessive modifier and high pyrolysis temperature are required for the preparation of these biochars.
21,22 and NaOH-engineered23 biochars were prepared for removal of MB from aqueous solution due to their relatively high adsorption capabilities. Yet, largely excessive modifier and high pyrolysis temperature are required for the preparation of these biochars.
Here, a K2FeO4-catalyzed oxidative pyrolysis was explored for the preparation of highly adsorptive areca leaf biochar for removal of MB from aqueous solution. Being a strong oxidant, K2FeO4 should effectively catalyze oxidative carbonization of biomass to generate oxygen-containing group-rich biochar at low temperature. The targets of this study were to: (1) developed a green method for improving the adsorption capability of biochar, (2) evaluate the adsorption capability of the biochar toward MB in aqueous solution, (3) illuminate the adsorption mechanism.
2. Materials and methods
2.1 Materials
Areca leaves were obtained from Fengyu farm in Ledong county of Hainan province, China. The chemicals including HCl, KOH, MB and K2FeO4 were analytically pure reagents purchased from Aladdin and Macklin in Shanghai of China. A MB solution (1000 mg L−1) was prepared by dissolving 1000 mg MB into 1 L deionized water, then diluted to the desired concentrations (25–350 mg L−1). The pH of MB solution was adjusted by HCl or NaOH solution with suitable concentration.2.2 Biochar preparation
The dried areca leaves were washed with water to remove impurities, dried in an oven at 60 °C for 24 h. The areca leaves were cut into small pieces, then pulverized and passed through a 60 mesh sieve to obtain a powder having a particle diameter of less than 2.5 mm. The areca leaf powder was pre-treated with K2FeO4 followed by pyrolysis to make modified biochar (MBC). Briefly, 0.5 g K2FeO4 was quickly dissolved in 100 mL of deionized water, then 5 g areca leaf powder was added to the aqueous solution, sonicated in an ultrasonic cleaner for 120 minutes and dried in an oven at 60 °C. The pre-treated areca leaf powder was pyrolyzed at different temperatures in a vacuum tube furnace under nitrogen with a heating rate of 5 °C min−1, kept at the targeted temperature for 1 h. The pyrolyzed product was washed with deionized water until colourless, dried in an oven at 60 °C for 24 h to obtain the MBC. Correspondingly, the pristine biochar (PBC) was directly prepared from areca leaf powder without K2FeO4 treatment. According to pyrolysis temperature, the PBCs and MBCs were named PBC200, PBC300, PBC400, PBC500, PBC600 and MBC200, MBC300, MBC400, MBC500, MBC600, respectively. Additionally, the MBCs pyrolyzed at 200 °C with 1/20 and 1/5 mass ratios of K2FeO4 to biomass were labelled as MBC200-1 and MBC200-2, respectively.2.3 Biochar characterization
The physical parameters including the specific surface area (SSA), pore volume (PV), and pore diameter (PD) were determined by nitrogen gas sorption isotherm on a surface area and porosity analyzer (Micromeritics ASAP 2460, America). The SSA was calculated by Brunauer–Emmett–Teller (BET) method. The PV and PD were calculated by Barret–Joyner–Halenda (BJH) method.Fourier transform infrared spectroscopy (FTIR) was applied to determine the functional groups of biochar. A certain amount of biochar (2 mg) and KBr (1000 mg) were mixed, ground and pressed into sheet, then recorded between 400 and 4000 cm−1 on a FTIR spectrometer (Bruker Tensor 27, Ettlingen, Germany). The surface functional group and element composition was characterized by an X-ray photoelectron spectrometer (XPS) (Thermo Scientific Escalab 250Xi, America).
The element content of biochar was measured on an organic element analyzer (Thermo Scientific Flash 2000 CHNS/O, America) and an inductive couple plasma (ICP) elemental analyzer (Agilent ICPOES 730, America). The possible crystalline of the biochar was examined on an X-ray diffractometer (Brucker D8 Advance, Germany).
2.4 Batch adsorption experiments
Generally, the adsorption experiments were carried out by mixing 20 mg areca leaf biochar and 40 mL MB solution into a 150 mL flask, then shaken in a constant temperature oscillator with 180 rpm speed for desired time. For investigating the effect of pyrolysis temperature, the adsorption was performed at 25 °C for 24 h using 100 mg L−1 MB concentration. The effect of initial pH was investigated in 150 mg L−1 MB solution over a range of pH from 3 to 9 for 24 h. The 1/8, 1/4, 1/2, 3/4, 4/4, 5/4 ratios of biochar to MB solution (mg mL−1) were employed to study the effect of biochar dosage by performing the adsorption in 100 mg L−1 MB solution for 36 h. The kinetic adsorption experiments were investigated at 25 °C and pH 7 with different time intervals (0.25, 0.5, 1, 2, 4, 8, 12, 16, 24, 30, 36 and 48 h), 75, 100, 150 and 200 mg L−1 concentrations were tested. A series of concentrations (25, 50, 75, 100, 150, 200, 250, 300 and 350 mg L−1) were applied for studying adsorption isotherms at pH 7 for 48 h, and the adsorption experiment was conducted at 15, 25, 35 and 45 °C, respectively. All the experiments were performed in triplicates.The concentration of MB solution was measured on an UV-vis spectrophotometer (MAPADA UV-3300PC, Shanghai of China) at 665 nm. The adsorption capability was determined by the difference of MB concentrations before and after adsorption. The adsorption capabilities of PBC and MBC were calculated by the equation expressed as:
| Qt = (C0 − Ct)V/M |
3. Results and discussion
3.1 Biochar characterization
As shown in Table 1, both pristine and modified biochars were of mesoporous as other ones.24 The SSA of pristine biochar increased as the pyrolysis temperature increased from 200 to 500 °C, and sharply decreased while rose to 600 °C. For the modified biochar, the SSA always increased with pyrolysis temperature. It was noted that both PBC200 and MBC200 were poor of SSA and PV. Thus, these properties contributed less to the adsorption capacities of PBC200 and MBC200.| BC | SSA (m2 g−1) | PV (cm3 g−1) | PD (nm) |
|---|---|---|---|
| PBC200 | 0.62 | 0.0022 | 11.69 |
| PBC300 | 2.15 | 0.0103 | 16.86 |
| PBC400 | 6.45 | 0.0177 | 10.25 |
| PBC500 | 42.98 | 0.0229 | 4.03 |
| PBC600 | 1.16 | 0.0156 | 41.53 |
| MBC200 | 0.66 | 0.0033 | 17.41 |
| MBC300 | 1.28 | 0.0070 | 18.44 |
| MBC400 | 5.23 | 0.0121 | 16.01 |
| MBC500 | 5.43 | 0.0127 | 29.79 |
| MBC600 | 79.29 | 0.0234 | 9.93 |
The total element composition of biochar was presented in Table 2. The pristine biochar was mainly comprised of C, O, N and H with small amount of Fe and K. The modified biochar had similar elements with PBC200, but owned much more iron and potassium which could be derived from K2FeO4. The O content of both biochars decreased with increasing pyrolysis temperature as expected. Importantly, the O/C ratio of the modified biochar was usually higher than that of the pristine biochar, so new oxygen containing groups were introduced through K2FeO4 oxidation. N/C ratio of MBC200 was comparable to PBC200, suggesting nitrogen-containing groups could survive with K2FeO4 catalysis.
| Biochar | Organic elemental compositions (wt%) | ICP (wt%) | ||||||
|---|---|---|---|---|---|---|---|---|
| C | O | N | H | O/Ca | N/Ca | Fe | K | |
| a Mol ratio. | ||||||||
| PBC200 | 47.87 | 35.83 | 1.43 | 5.89 | 0.56 | 0.026 | 0.02 | 0.01 |
| PBC300 | 55.06 | 21.68 | 1.63 | 4.73 | 0.30 | 0.025 | 0.03 | 0.49 |
| PBC400 | 55.88 | 15.51 | 1.75 | 3.71 | 0.21 | 0.027 | 0.04 | 0.75 |
| PBC500 | 60.17 | 10.66 | 1.63 | 3.22 | 0.13 | 0.023 | 0.06 | 1.03 |
| PBC600 | 68.01 | 8.56 | 1.88 | 2.64 | 0.09 | 0.024 | 0.09 | 0.65 |
| MBC200 | 43.36 | 33.95 | 1.27 | 5.59 | 0.59 | 0.025 | 5.40 | 1.41 |
| MBC300 | 47.45 | 27.46 | 1.61 | 4.32 | 0.43 | 0.029 | 8.36 | 1.45 |
| MBC400 | 48.63 | 23.57 | 1.40 | 3.68 | 0.36 | 0.025 | 8.16 | 2.94 |
| MBC500 | 47.90 | 20.96 | 1.23 | 2.46 | 0.33 | 0.022 | 9.53 | 3.40 |
| MBC600 | 50.96 | 19.40 | 1.18 | 2.48 | 0.29 | 0.020 | 10.21 | 3.13 |
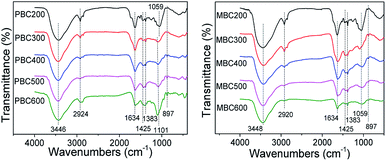
The FTIR spectra of biochars pyrolyzed at different temperatures were shown in Fig. 1. The broad peaks at approximately 3446 cm−1 were assigned to –OH stretching vibrations. The peaks around 2924 cm−1 belonged to aliphatic C–H stretching vibrations.25,26 The peaks at 1634 cm−1 attributed to C![[double bond, length as m-dash]](https://www.rsc.org/images/entities/char_e001.gif) O and aromatic C
O and aromatic C![[double bond, length as m-dash]](https://www.rsc.org/images/entities/char_e001.gif) C stretching vibrations.27 The adjacent peaks at about 1425 cm−1 were also assigned to aromatic C
C stretching vibrations.27 The adjacent peaks at about 1425 cm−1 were also assigned to aromatic C![[double bond, length as m-dash]](https://www.rsc.org/images/entities/char_e001.gif) C stretching vibrations. The peaks around 1383 cm−1 represented –COOH asymmetric bending vibrations.28 The peaks around 1101 and 1059 cm−1 corresponded to aromatic and aliphatic C–O stretching vibrations, respectively. The peaks at 897 cm−1 represented aromatic C–H bending vibrations.29
C stretching vibrations. The peaks around 1383 cm−1 represented –COOH asymmetric bending vibrations.28 The peaks around 1101 and 1059 cm−1 corresponded to aromatic and aliphatic C–O stretching vibrations, respectively. The peaks at 897 cm−1 represented aromatic C–H bending vibrations.29
The pristine biochar was mainly consisted of OH, COOH, C![[double bond, length as m-dash]](https://www.rsc.org/images/entities/char_e001.gif) O, C
O, C![[double bond, length as m-dash]](https://www.rsc.org/images/entities/char_e001.gif) C, C–O and aliphatic C–H groups as prepared at low temperature (≦400 °C). As previous reports,30,31 the C
C, C–O and aliphatic C–H groups as prepared at low temperature (≦400 °C). As previous reports,30,31 the C![[double bond, length as m-dash]](https://www.rsc.org/images/entities/char_e001.gif) O peaks decreased and aromatic structure formed while higher temperature was applied. Interestingly, the pristine biochar prepared at 500 and 600 °C was still rich of C–O groups as C–O peaks (1101 cm−1) became stronger. This was opposed to other reports.31–33 Comparing to the corresponding pristine biochar, the modified biochar was much richer in aliphatic C–O and COOH groups as pyrolyzed at 200 °C. The aliphatic C–O groups of modified biochar decreased but no aromatic rings formed while increasing pyrolysis temperature. Moreover, strong peaks of C
O peaks decreased and aromatic structure formed while higher temperature was applied. Interestingly, the pristine biochar prepared at 500 and 600 °C was still rich of C–O groups as C–O peaks (1101 cm−1) became stronger. This was opposed to other reports.31–33 Comparing to the corresponding pristine biochar, the modified biochar was much richer in aliphatic C–O and COOH groups as pyrolyzed at 200 °C. The aliphatic C–O groups of modified biochar decreased but no aromatic rings formed while increasing pyrolysis temperature. Moreover, strong peaks of C![[double bond, length as m-dash]](https://www.rsc.org/images/entities/char_e001.gif) O around 1634 cm−1 were always observed for the modified biochar. This demonstrated that K2FeO4 catalyzed pyrolysis could generate oxygen containing groups. As a result, K2FeO4 catalysis was beneficial to preparing oxygen containing group-rich biochar at low temperature.
O around 1634 cm−1 were always observed for the modified biochar. This demonstrated that K2FeO4 catalyzed pyrolysis could generate oxygen containing groups. As a result, K2FeO4 catalysis was beneficial to preparing oxygen containing group-rich biochar at low temperature.
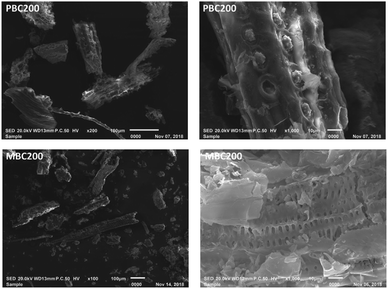
The morphology of PBC200 and MBC200 was shown in Fig. 2. PBC200 was consisted of inhomogenous microparticles of which the surface was embedded with nbeans in row. With catalysis of K2FeO4, smaller microparticles with flocculences and micropores were obtained for MBC200. Therefore, K2FeO4 could efficiently accelerate the decomposition of areca leaf, which was helpful for making thermostable biochar at low pyrolysis temperature.
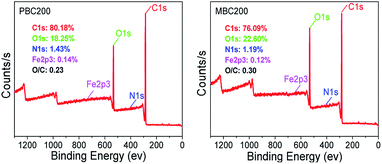
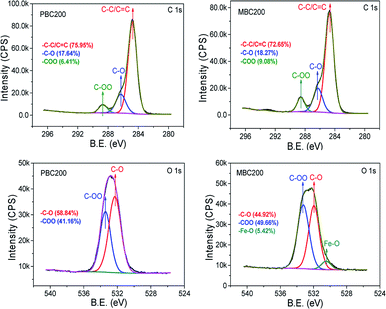
XPS spectra showed that the surface oxygen of MBC200 was much more than that of PBC200 due to K2FeO4 oxidation (Fig. 3). Whereas, only trace amount of iron was detected on the surface of MBC200, thereby iron was mostly embedded inside MBC200. The C 1s and O 1s spectra and their deconvolution results were shown in Fig. 4. The peaks centered at 284.8, 286.3 and 288.6 eV represented C–C, C–O and –CO2– groups,34,35 respectively. Both biochars were consisted of C–C/C![[double bond, length as m-dash]](https://www.rsc.org/images/entities/char_e001.gif) C, C–O and –CO2– groups. Obviously, both C–O and –CO2– groups of MBC200 were higher than that of PBC200, indicating new oxygen-containing groups were generated onto the surface of MBC200 with K2FeO4 oxidation. Moreover, a new peak at 530.5 eV, which could be assigned to Fe–O groups,36,37 was observed on MBC200, indicating iron oxides were introduced.
C, C–O and –CO2– groups. Obviously, both C–O and –CO2– groups of MBC200 were higher than that of PBC200, indicating new oxygen-containing groups were generated onto the surface of MBC200 with K2FeO4 oxidation. Moreover, a new peak at 530.5 eV, which could be assigned to Fe–O groups,36,37 was observed on MBC200, indicating iron oxides were introduced.
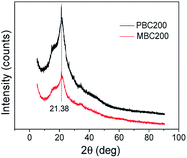
The XRD patterns showed that a sharp diffraction peak at 21.38° and a broad diffraction peak between 8.30° and 27.02° (Fig. 5) were obtained for both PBC200 and MBC200. The peak around 21.38° could be attributed to well crystalline aliphatic carbon.38 The broad peaks represented (110) and (200) planes of cellulose I.39,40 The diffraction peak intensity of MBC200 was much weaker than that of PBC200 due to the oxidation of K2FeO4. No diffraction peaks of magnetic iron oxides such as Fe3O4 and γ-Fe2O3 were observed for MBC200, so no magnetism was obtained.
3.2 Adsorption behaviours toward MB
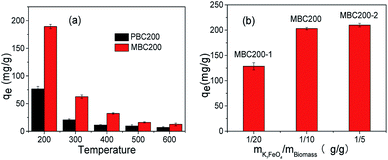
The dosage of K2FeO4 was also investigated (Fig. 6b). It was found that the adsorption capability remarkably increased as enhancing the weight ratio of K2FeO4 to biomass from 1/20 to 1/10, and rarely increased as further rising the dosage to 1/5. Anyway, these modifications all leaded to the increase of adsorption capability, demonstrating that the improvement of adsorption capability could be realized by using catalytic amount of K2FeO4. Considering both adsorption efficiency and K2FeO4 dosage, PBC200 and MBC200 were applied for studying their adsorption behaviours in the following experiments.
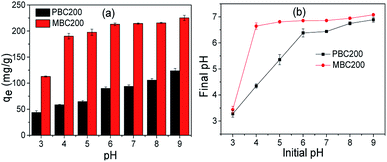
The change of pH was recorded after adsorption (Fig. 7b). For PBC200, the pH slightly increased as the adsorption was performed between pH 3 and pH 6, and almost kept constant at about 7 while carried out beyond pH 6. For MBC200, the pH increased a little as pH 3 was applied and almost maintained around 7 when the adsorption was performed above pH 3.
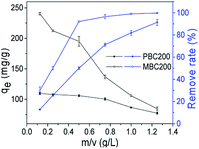
The effect of biochar dosage was also investigated (Fig. 8). The removal rate of MB by PBC200 gradually increased as enhancing the dosage from 0.125 to 1.25 g L−1. Removing 90% of MB required 1.25 g L−1 PBC200. For MBC200, the removal rate of MB rapidly increased up to 92.16% with the increase of dosage from 0.125 to 0.5 g L−1, and slightly rose as further increasing the dosage. This also demonstrated that MBC200 surpassed PBC200 for removing MB from aqueous solution.
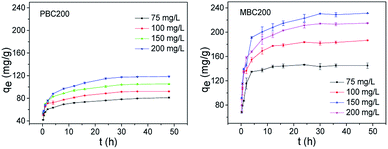 | ||
| Fig. 9 Adsorption kinetics (20 mg biochar, 40 mL MB solution, pH = 7, 25 °C, 180 rpm). The error bars represented the standard deviation of triplicates. | ||
The adsorption kinetic data was matched by pseudo-first-order and pseudo-second-order model (Table 3).44 The adsorption kinetics of PBC200 and MBC200 were better fitted by pseudo-second-order model than pseudo-first-order model with extremely high determination coefficients. Moreover, the calculated equilibrium adsorption capabilities of pseudo-second-order model were much closer to the experimental results than that of pseudo-first-order model for both biochars. This suggested that the adsorptions should be chemisorption-controlled processes.45
| BC | C0 (mg L−1) | Pseudo-first model: ln(qe − qt) = ln![[thin space (1/6-em)]](https://www.rsc.org/images/entities/char_2009.gif) qe − k1t qe − k1t |
|||||||
|---|---|---|---|---|---|---|---|---|---|
| qe,exp | qe,cal | k1 | R2 | qe,exp | qe,cal | k2 | R2 | ||
| PBC200 | 75 | 81.06 | 27.97 | 0.079 | 0.96380 | 81.06 | 81.16 | 0.0134 | 0.99855 |
| 100 | 92.14 | 41.22 | 0.136 | 0.92976 | 92.14 | 93.37 | 0.0118 | 0.99866 | |
| 150 | 105.27 | 46.53 | 0.121 | 0.96643 | 105.27 | 106.61 | 0.0098 | 0.99884 | |
| 200 | 118.46 | 63.08 | 0.128 | 0.98586 | 118.46 | 120.92 | 0.0068 | 0.99835 | |
| MBC200 | 75 | 146.38 | 29.44 | 0.187 | 0.68100 | 146.38 | 146.62 | 0.0169 | 0.99984 |
| 100 | 186.54 | 54.28 | 0.215 | 0.84167 | 186.54 | 187.26 | 0.0085 | 0.99974 | |
| 150 | 214.70 | 93.92 | 0.309 | 0.94537 | 214.70 | 218.34 | 0.0052 | 0.99954 | |
| 200 | 231.17 | 103.21 | 0.283 | 0.90626 | 231.17 | 234.74 | 0.0044 | 0.99932 | |
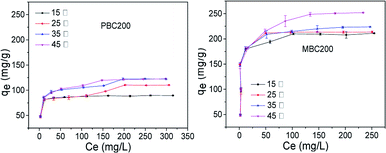 | ||
| Fig. 10 Adsorption isotherms of PBC200 and MBC200 (20 mg biochar, 40 mL MB solution, pH = 7, 48 h, 180 rpm). The error bars represented the standard deviation of triplicates. | ||
The adsorption isotherm data was simulated by Langmuir and Freundlich models (Table 4).46 The adsorption processes of PBC200 and MBC200 were better described by Langmuir model than Freundlich model with extremely high correlation coefficients. In addition, the experimental maximum adsorption capacities approximated to the calculated results of Langmuir model. This indicated the removal of MB was a monolayer adsorption process.15 It was noted that the adsorption capacity of MBC200 was superior or comparable to that of most adsorbents reported in the literature (Table 5).
| BC | T (°C) | Freundlich: qe = KFCe1/n | ||||||
|---|---|---|---|---|---|---|---|---|
| qexp,max | qcal,max | KL | R2 | KF | 1/n | R2 | ||
| PBC200 | 15 | 89.66 | 90.09 | 0.444 | 0.99993 | 52.03 | 0.107 | 0.64727 |
| 25 | 110.40 | 113.64 | 0.073 | 0.99073 | 45.41 | 0.158 | 0.85621 | |
| 35 | 122.57 | 125.15 | 0.102 | 0.99554 | 48.61 | 0.172 | 0.85968 | |
| 45 | 122.67 | 125.47 | 0.123 | 0.99877 | 49.43 | 0.173 | 0.90803 | |
| MBC200 | 15 | 211.05 | 213.22 | 0.279 | 0.99945 | 85.99 | 0.179 | 0.51464 |
| 25 | 213.47 | 216.45 | 0.352 | 0.99957 | 87.13 | 0.183 | 0.50834 | |
| 35 | 223.71 | 226.75 | 0.259 | 0.99963 | 86.25 | 0.191 | 0.56792 | |
| 45 | 251.95 | 257.73 | 0.169 | 0.99904 | 81.84 | 0.226 | 0.66859 | |
| Adsorbent | qmax (mg g−1) | Ref. |
|---|---|---|
| NaOH-activated carbon | 890 | 47 |
| Ca(NO3)2-activated carbon fiber | 295 | 48 |
| Carbon polyhedra | 354 | 49 |
| Magnetic chitosan/graphene oxide composite | 180.83 | 50 |
| Graphene oxide | 598.8 | 51 |
| Citric acid modified kenaf core fibre | 131.6 | 52 |
| Lotus leaf | 221.7 | 53 |
| Biochar/AlOOH nanocomposite | 85.03 | 54 |
| H2O2-assisted microwave activated biochar | 91.0 | 21 |
| K2FeO4-modified biochar | 251.95 | This work |
As shown in Fig. 11, the C–N feature peaks of MB at 1398 and 1339 cm−1 shifted to 1385 and 1325 cm−1 as MB was adsorbed onto PBC200 and MBC200. Meanwhile, the COOH peaks of PBC200 and MBC200 around 1733 cm−1 almost disappeared after adsorption, probably attributing to the red shift of COOH peaks to lower wave-numbers which was overlapped by the peaks around 1628 cm−1. Moreover, the COOH peaks appeared after desorption of MB in mixture of acetic acid/ethanol (1/9 volume ratio). These clearly demonstrated that hydrogen bonds were formed between MB and both biochars during adsorption.
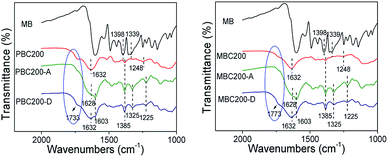 | ||
| Fig. 11 FTIR spectra of biochars after adsorption and desorption. (PBC200-A or MBC200-A: biochar after adsorption; PBC200-D or MBC200-D: regenerated biochar). | ||
As PBC200 and MBC200 were rich of surface oxygen containing groups, negatively charged surface might be generated under neutral conditions. Hence, the MB cation could be adsorbed onto the biochar surface by electrostatic interaction at pH 7.
In brief, the adsorption of PBC200 could be mainly attributed to hydrogen bonding and electrostatic interaction. Differently, the adsorption of MBC200 involved cation exchange besides hydrogen bonding and electrostatic interaction.
4. Conclusions
A catalytic amount of K2FeO4 could effectively promote oxidative pyrolysis of areca leaf for preparation of highly adsorptive biochar for MB at 200 °C. The oxygen-containing groups were introduced onto the biochar through K2FeO4-catalyzed oxidative pyrolysis, where the functional groups of areca leaf were also mostly reserved. Therefore, the biochar displayed much higher adsorption capability than the pristine one. Moreover, high adsorption capability was observed over a wide pH range and nearly neutral pH was gained after adsorption. This will make the biochar serve as a promising adsorbent for remediation of MB-polluted wastewater in practice.Conflicts of interest
There are no conflicts of interest to declare.Acknowledgements
The Hainan Provincial Natural Science Foundation of China (519QN175) and the National Natural Science Foundation of China (21801053) were acknowledged.Notes and references
- F. R. Oliveira, A. K. Patel, D. P. Jaisi, S. Adhikari, H. Lu and S. K. Khanal, Bioresour. Technol., 2017, 246, 110–122 CrossRef CAS.
- T. Xie, K. R. Reddy, C. Wang, E. Yargicoglu and K. Spokas, Crit. Rev. Environ. Sci. Technol., 2015, 45, 939–969 CrossRef CAS.
- S. Ye, M. Yan, X. Tan, J. Liang, G. Zeng, H. Wu, B. Song, C. Zhou, Y. Yang and H. Wang, Appl. Catal., B, 2019, 250, 78–88 CrossRef CAS.
- H. S. Kambo and A. Dutta, Renewable Sustainable Energy Rev., 2015, 45, 359–378 CrossRef CAS.
- L. Lonappan, T. Rouissi, R. K. Das, S. K. Brar, A. A. Ramirez, M. Verma, R. Y. Surampalli and J. R. Valero, Waste Manag., 2016, 49, 537–544 CrossRef CAS PubMed.
- L. Sun, S. Wan and W. Luo, Bioresour. Technol., 2013, 140, 406–413 CrossRef CAS PubMed.
- Y. Wang and R. Liu, Fuel Process. Technol., 2017, 160, 55–63 CrossRef CAS.
- S. J. Liu, Y. G. Liu, X. F. Tan, S. B. Liu, M. F. Li, N. Liu, Z. h. Yin, S. R. Tian and Y. H. Zhou, J. Chem. Technol. Biotechnol., 2019, 94, 2187–2197 CAS.
- M. B. Ahmed, J. L. Zhou, H. H. Ngo, W. Guo and M. Chen, Bioresour. Technol., 2016, 214, 836–851 CrossRef CAS PubMed.
- T. Sizmur, T. Fresno, G. Akgul, H. Frost and E. Moreno-Jimenez, Bioresour. Technol., 2017, 246, 34–47 CrossRef CAS PubMed.
- X.-F. Tan, Y.-G. Liu, Y.-L. Gu, Y. Xu, G.-M. Zeng, X.-J. Hu, S.-B. Liu, X. Wang, S.-M. Liu and J. Li, Bioresour. Technol., 2016, 212, 318–333 CrossRef CAS PubMed.
- P. Zhang, S. Liu, X. Tan, Y. Liu, G. Zeng, Z. Yin, S. Ye and Z. Zeng, Process Saf. Environ. Prot., 2019, 128, 329–341 CrossRef CAS.
- P. Godlewska, H. P. Schmidt, Y. S. Ok and P. Oleszczuk, Bioresour. Technol., 2017, 246, 193–202 CrossRef CAS PubMed.
- G. Kabir and B. H. Hameed, Renewable Sustainable Energy Rev., 2017, 70, 945–967 CrossRef CAS.
- K. S. Tong, M. J. Kassim and A. Azraa, Chem. Eng. J., 2011, 170, 145–153 CrossRef CAS.
- M. T. Yagub, T. K. Sen, S. Afroze and H. M. Ang, Adv. Colloid Interface Sci., 2014, 209, 172–184 CrossRef CAS PubMed.
- M. S. Chiou and H. Y. Li, Chemosphere, 2003, 50, 1095–1105 CrossRef CAS PubMed.
- E. N. El Qada, S. J. Allen and G. M. Walker, Chem. Eng. J., 2006, 124, 103–110 CrossRef CAS.
- Y. M. Slokar and A. M. L. Marechal, Dyes Pigm., 1997, 37, 335–356 CrossRef.
- L. Shi, G. Zhang, D. Wei, T. Yan, X. Xue, S. Shi and Q. Wei, J. Mol. Liq., 2014, 198, 334–340 CrossRef CAS.
- V. Nair and R. Vinu, Bioresour. Technol., 2016, 216, 511–519 CrossRef CAS PubMed.
- D. V. Suriapparao, N. Pradeep and R. Vinu, Energy Fuels, 2015, 29, 2571–2581 CrossRef CAS.
- X. Han, L. Chu, S. Liu, T. Chen, C. Ding, J. Yan, L. Cui and G. Quan, BioResources, 2015, 10, 2836–2849 CAS.
- Q. Chen, J. Zheng, L. Zheng, Z. Dang and L. Zhang, Chem. Eng. J., 2018, 350, 1000–1009 CrossRef CAS.
- S. Kumari, G. S. Chauhan and J. H. Ahn, Chem. Eng. J., 2016, 304, 728–736 CrossRef CAS.
- S. Liu, J. Li, S. Xu, M. Wang, Y. Zhang and X. Xue, Bioresour. Technol., 2019, 282, 48–55 CrossRef CAS PubMed.
- L. Qian and B. Chen, J. Agric. Food Chem., 2014, 62, 373–380 CrossRef CAS PubMed.
- F. Lian, B. Xing and L. Zhu, J. Colloid Interface Sci., 2011, 360, 725–730 CrossRef CAS PubMed.
- W. A. W. A. K. Ghani, A. Mohd, G. da Silva, R. T. Bachmann, Y. H. Taufiq-Yap, U. Rashid and A. a. H. Al-Muhtaseb, Ind. Crops Prod., 2013, 44, 18–24 CrossRef.
- B. Chen and Z. Chen, Chemosphere, 2009, 76, 127–133 CrossRef CAS.
- S. Xu, W. Yu, S. Liu, C. Xu, J. Li and Y. Zhang, Sustainability, 2018, 10, 4250 CrossRef CAS.
- D. Chen, X. Yu, C. Song, X. Pang, J. Huang and Y. Li, Bioresour. Technol., 2016, 218, 1303–1306 CrossRef CAS PubMed.
- S. Duan, W. Ma, Y. Pan, F. Meng, S. Yu and L. Wu, J. Taiwan Inst. Chem. Eng., 2017, 80, 835–841 CrossRef CAS.
- H. Peng, P. Gao, G. Chu, B. Pan, J. Peng and B. Xing, Environ. Pollut., 2017, 229, 846–853 CrossRef CAS PubMed.
- P. Zhang, X. Tan, S. Liu, Y. Liu, G. Zeng, S. Ye, Z. Yin, X. Hu and N. Liu, Chem. Eng. J., 2019, 378, 122141 CrossRef CAS.
- T. Yamashita and P. Hayes, J. Electron Spectrosc. Relat. Phenom., 2006, 152, 6–11 CrossRef CAS.
- F. Yang, S. Zhang, H. Li, S. Li, K. Cheng, J.-S. Li and D. C. W. Tsang, Chem. Eng. J., 2018, 348, 191–201 CrossRef CAS.
- F. Yang, S. Zhang, Y. Sun, K. Cheng, J. Li and D. C. W. Tsang, Bioresour. Technol., 2018, 265, 490–497 CrossRef CAS PubMed.
- A. D. French, Cellulose, 2013, 21, 885–896 CrossRef.
- J. Miao, Y. Yu, Z. Jiang and L. Zhang, Cellulose, 2016, 23, 1209–1219 CrossRef CAS.
- Y. Sun, B. Gao, Y. Yao, J. Fang, M. Zhang, Y. Zhou, H. Chen and L. Yang, Chem. Eng. J., 2014, 240, 574–578 CrossRef CAS.
- K. Sapana, S. C. Ghanshyam and A. Jou-Hyeon, Chem. Eng. J., 2016, 304, 728–736 CrossRef.
- D. L. Guerra, H. C. P. Oliveira, P. C. C. da Costa, R. R. Viana and C. Airoldi, Catena, 2010, 82, 35–44 CrossRef CAS.
- J.-P. Simonin, Chem. Eng. J., 2016, 300, 254–263 CrossRef CAS.
- M. K. Aroua, C. Y. Yin, F. N. Lim, W. L. Kan and W. M. Daud, J. Hazard. Mater., 2009, 166, 1526–1529 CrossRef CAS PubMed.
- P. K. Gessner and M. M. Hasan, J. Pharm. Sci., 1987, 76, 319–327 CrossRef CAS PubMed.
- A. M. M. Vargas, A. L. Cazetta, M. H. Kunita, T. L. Silva and V. C. Almeida, Chem. Eng. J., 2011, 168, 722–730 CrossRef CAS.
- S. Lei, J.-I. Miyamoto, H. Kanoh, Y. Nakahigashi and K. Kaneko, Carbon, 2006, 44, 1884–1890 CrossRef CAS.
- J. Wang, C. Xue, Z. Wu, W. Li, Y. Lv, A. M. Asiri, B. Tu and D. Zhao, Carbon, 2012, 50, 2546–2555 CrossRef CAS.
- L. Fan, C. Luo, M. Sun, X. Li, F. Lu and H. Qiu, Bioresour. Technol., 2012, 114, 703–706 CrossRef CAS PubMed.
- H. Yan, X. Tao, Z. Yang, K. Li, H. Yang, A. Li and R. Cheng, J. Hazard. Mater., 2014, 268, 191–198 CrossRef CAS PubMed.
- M. S. Sajab, C. H. Chia, S. Zakaria, S. M. Jani, M. K. Ayob, K. L. Chee, P. S. Khiew and W. S. Chiu, Bioresour. Technol., 2011, 102, 7237–7243 CrossRef CAS PubMed.
- X. Han, W. Wang and X. Ma, Chem. Eng. J., 2011, 171, 1–8 CrossRef CAS.
- M. Zhang and B. Gao, Chem. Eng. J., 2013, 226, 286–292 CrossRef CAS.
| This journal is © The Royal Society of Chemistry 2019 |

