 Open Access Article
Effect of synthesis pH on the structure and catalytic properties of FeMo catalysts†
Shuai Zhang and
Minghan Han*
Department of Chemical Engineering, Beijing Key Laboratory of Green Reaction Engineering and Technology, Tsinghua University, Beijing 100084, China. E-mail: hanmh@tsinghua.edu.cn
First published on 17th December 2019
Abstract
The effect of pH on polynuclear molybdenum species (isopolymolybdates) synthesis was investigated by Raman spectroscopy. As the pH decreased from 6.0 to 1.0, the main isopolymolybdates changed from MoO42− to Mo7O246− to Mo8O246− to Mo36O1168−. They began to aggregate and their solubility decreased with decreasing pH. The FeMo catalysts comprised particle- and plate-like structures, which were Fe2(MoO4)3 and MoO3, respectively. When a low pH value was used in the catalyst preparation, there was severe aggregation of the particles which have a high Mo/Fe mole ratio and Mo enrichment on the surface layer, which decreased the activity and selectivity of the FeMo catalyst.
1. Introduction
Formaldehyde is an important intermediate in the chemical industry.1,2 The world production of formaldehyde from methanol uses a heterogeneous catalytic process based on silver3 or FeMo catalysts.4 The silver-catalyzed process is being replaced by the FeMo catalyzed process because of the high formaldehyde yield and longer lifetime of the catalyst, although the lifetime is still rather short (∼1 year) due to deactivation, which is a major problem.5 Deactivation of FeMo catalysts is believed to be due to Mo content loss when volatiles of Mo–methanol are formed and phase separation into MoO3 and Fe2O3, which not only decreases the activity but also the selectivity.6–8 Therefore, in industry use, the Mo/Fe mole ratio of FeMo catalysts is usually higher than the stoichiometric ratio of iron molybdate to replenish Mo loss during the reaction.9,10The preparation of FeMo catalysts has been investigated by many researchers.11–13 Trifiro14 pointed that the structure of the isopolymolybdates in aqueous solution is a crucial aspect in the preparation of FeMo catalysts. Alessandrini et al.15 reported that for a constant Mo/Fe ratio in the parent solution, the ratio in the precipitate decreased when the final pH during precipitation was increased. In addition, Pernicone16 found that the catalyst activity correlated mainly with the pH of the synthesis solution after precipitation, and concluded that the performance of the catalyst was influenced by the different structure of the isopolymolybdates during the preparation of the catalyst at different pH values. Due to the complexity of the characterization of the structure of isopolymolybdates and chemistry of isopolymolybdates, this has been an area of continuing research for several decades.
Raman spectroscopy provides an effective method to characterize the structure of isopolymolybdates because the asymmetric stretch of Mo![[double bond, length as m-dash]](https://www.rsc.org/images/entities/char_e001.gif) O in the Raman spectra is sensitive to small changes in the structure of the isopolymolybdate.17 Since there is agreement that the pH has a large influence on the structure of isopolymolybdates,18 therefore, clarifying the isopolymolybdate species in solutions of different pH will benefit the understanding of the structure of Mo-based catalysts synthesized at different pH, such as selective oxidation, ammoxidation of alcohol or alkene, and other types of reaction.19–22 It is also important to correlate the activity and selectivity of the catalyst with the effect of the pH value.
O in the Raman spectra is sensitive to small changes in the structure of the isopolymolybdate.17 Since there is agreement that the pH has a large influence on the structure of isopolymolybdates,18 therefore, clarifying the isopolymolybdate species in solutions of different pH will benefit the understanding of the structure of Mo-based catalysts synthesized at different pH, such as selective oxidation, ammoxidation of alcohol or alkene, and other types of reaction.19–22 It is also important to correlate the activity and selectivity of the catalyst with the effect of the pH value.
In this work, Raman spectroscopy was used to identify the structure of the isopolymolybdates prepared at various pH values using ammonium heptamolybdate tetrahydrate (AHM) aqueous solution as the stock solution. Knowing the structure and stability of the isopolymolybdates at different pH is useful for understanding the preparation of catalysts based on molybdenum. The catalysts synthesized at different pH were characterized, and the connection between the structure and catalytic performance, such as activity and selectivity, is discussed.
2. Experimental
2.1. Chemicals
AHM, iron nitrate nonahydrate and methanol were purchased from Sinopharm Chemical Reagent Ltd. Corporation. Nitric acid and ammonia, with mass fraction of 65–68% and 25–28%, respectively, were obtained from Beijing Chemical Works. All reagents were analytical grade and used without further purification.2.2. Preparation of isopolymolybdates and catalysts
2.3. Catalytic activity
The selective oxidation of methanol to formaldehyde was carried out in a steel microreactor (8.0 mm i.d. × 0.7 m). The catalyst was ground into 100–300 mesh powder and 0.41 g was placed in the middle of the micro-reactor. Methanol was pumped in at a flow rate of 0.011 ml min−1 and mixed with air at a flow rate of 97.8 ml min−1 (STD), which gave the mole ratios of MeOH![[thin space (1/6-em)]](https://www.rsc.org/images/entities/char_2009.gif) :
:![[thin space (1/6-em)]](https://www.rsc.org/images/entities/char_2009.gif) O2
O2![[thin space (1/6-em)]](https://www.rsc.org/images/entities/char_2009.gif) :
:![[thin space (1/6-em)]](https://www.rsc.org/images/entities/char_2009.gif) N2 = 1
N2 = 1![[thin space (1/6-em)]](https://www.rsc.org/images/entities/char_2009.gif) :
:![[thin space (1/6-em)]](https://www.rsc.org/images/entities/char_2009.gif) 3.8
3.8![[thin space (1/6-em)]](https://www.rsc.org/images/entities/char_2009.gif) :
:![[thin space (1/6-em)]](https://www.rsc.org/images/entities/char_2009.gif) 12.7. The product was sampled online at 120 °C and sent by a thermally insulated tubing to be analyzed by a gas chromatograph (GC, 9790IIT-2, FULI, China) equipped with a TCD detector and a packed column (Porpark N, 3 mm × 5 m, Hichina Zhicheng Technology Ltd., China).
12.7. The product was sampled online at 120 °C and sent by a thermally insulated tubing to be analyzed by a gas chromatograph (GC, 9790IIT-2, FULI, China) equipped with a TCD detector and a packed column (Porpark N, 3 mm × 5 m, Hichina Zhicheng Technology Ltd., China).
In addition to the main product of formaldehyde, byproducts of DME, CO and CO2 were also detected. The relative contents of the products were determined by the normalization method. The conversion of methanol and selectivity of the products were calculated as:
 | (1) |
 | (2) |
2.4. Catalyst characterization
Powder X-ray diffraction (XRD) was used to identify the crystal structure using an X-ray powder diffractometer (Bruker-AXS D8 Advance, Germany) with Cu Kα radiation source operated at the speed of 5° min−1. Raman spectra were obtained using an excitation wavelength of 633 nm with a Horiba Jobin Yvon LabRAM HR800 Raman spectrometer. Scanning electron microscopy (SEM, JEM 7401F, JEOL, Japan) was used to characterize the morphology of the catalysts. Transmission electron microscopy (TEM, JEM-2010, JEOL, Japan) was used to examine the difference between the catalyst bulk and interface. High-angle annular dark-field scanning TEM (HAADF-STEM) was performed using a JEOL ARM200F microscope (JEOL, Tokyo, Japan) with a STEM aberration corrector operated at 100 kV. Energy-dispersive X-ray spectroscopy (EDS) was used to analyze the composition (Mo/Fe mole ratio) in selected areas of the catalysts. The overall composition of the catalyst was determined by an inductively coupled plasma optical emission spectrometer (ICP-OES, Spectro Arcos FHX22, Germany). The particle area distribution at different pH values was obtained by calculating the area of different scale of particles in Auto CAD 2017. NH3/CO2-TPD characterization of the catalysts was performed using temperature programmed desorption unit (TPD, Quantachrome Instruments, Chembet PULSAR). The sample was flushed with He at 300 °C for 30 min, then cooled to 30 °C and kept under flowing 5% NH3/CO2/He for 30 min. Physically adsorbed NH3/CO2 was removed by flushing with He at 100 °C for 30 min, then chemically adsorbed NH3/CO2 on the catalyst was measured by heating from 100 to 700 °C at a heating rate of 10 °C min−1. The specific surface areas with the catalysts were determined by N2 adsorption using a Quadrasorb-S1 instrument (Quantachrome, USA) and the Brunauer–Emmett–Teller (BET) method. The sample was pre-treated before analysis by removing physically adsorbed water by heating at 300 °C for 8 h under vacuum.3. Results and discussion
3.1. pH effect on isopolymolybdates
Fig. S1† shows the Raman spectra of some pure solid isopolymolybdates: MoO42−, Mo2O72−, Mo4O132−, Mo7O246− and γ-Mo8O264−. The peaks at 896, 934, 965 cm−1 were assigned to the symmetric stretch of Mo![[double bond, length as m-dash]](https://www.rsc.org/images/entities/char_e001.gif) O in MoO42−,23 asymmetric stretch of Mo
O in MoO42−,23 asymmetric stretch of Mo![[double bond, length as m-dash]](https://www.rsc.org/images/entities/char_e001.gif) O in Mo7O246− (ref. 24) and symmetric stretch of terminal Mo
O in Mo7O246− (ref. 24) and symmetric stretch of terminal Mo![[double bond, length as m-dash]](https://www.rsc.org/images/entities/char_e001.gif) O in γ-Mo8O264−,25–27 respectively.
O in γ-Mo8O264−,25–27 respectively.
To investigate the pH effect on the isopolymolybdate solutions, nitric acid or ammonia was added to adjust the pH value to get the different isopolymolybdate solutions. Fig. 1 shows the Raman spectra of the solutions with pH values from 7.0 to 1.8. When the solution was made alkaline with ammonia to raise the pH value to 6.0, the 939 cm−1 line decreased in height, and simultaneously, there was an increase of the Raman line at 897 cm−1. Further addition of alkali led to the disappearance of the 939 cm−1 line completely. In the narrow pH range of 7.0–5.4, the intensity of the 897 and 939 cm−1 lines changed continuously, indicating that there were no intermediate species between MoO42− and Mo7O246−.
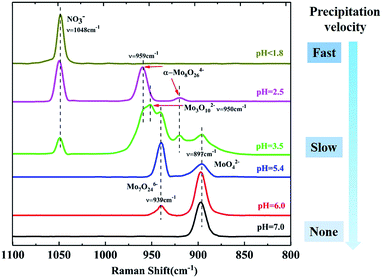 | ||
| Fig. 1 Raman spectra change with changes in the pH of isopolymolybdate solutions and the precipitation velocity of isopolymolybdates. | ||
When the solution was acidified to pH = 3.5 with nitric acid, the Raman lines at 897 and 939 cm−1 decreased in intensity, while two new Raman lines at 950 and 959 cm−1 appeared, which were assigned to the symmetric stretch of the middle group (MoO2) in Mo3O102− (ref. 28) and the symmetric stretch of terminal Mo![[double bond, length as m-dash]](https://www.rsc.org/images/entities/char_e001.gif) O in α-Mo8O246−,17,27 respectively. As the pH was lowered further, the 897, 939 and 950 cm−1 lines disappeared, and only the Raman line of α-Mo8O246− existed. Below pH = 1.8, Mo species precipitated rapidly and there was no Raman signal, except for the NO3− peak at 1048 cm−1.29
O in α-Mo8O246−,17,27 respectively. As the pH was lowered further, the 897, 939 and 950 cm−1 lines disappeared, and only the Raman line of α-Mo8O246− existed. Below pH = 1.8, Mo species precipitated rapidly and there was no Raman signal, except for the NO3− peak at 1048 cm−1.29
Acidification of the Mo7O246− solution changed the structure of isopolymolybdates with different precipitation velocity. Many precipitates appeared immediately when the pH value was below 1.8. Little precipitation appeared slowly when the pH value between 2.5 and 3.5. No precipitation appeared when the pH value above 5.4. This meant that the isopolymolybdates were much aggregated and the solubility decreased at low pH values.
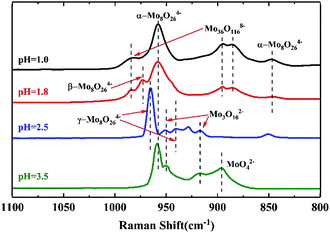
Fig. 2 shows the Raman spectra of the precipitates at different pH values. There were four Raman lines at 959, 949, 918, and 897 cm−1 at pH = 3.5, which were assigned to α-Mo8O246−, Mo3O102− and MoO42−. This was in accord with the isopolymolybdate solution at pH = 3.5. As the pH was lowered to 2.5, part of the α-Mo8O246− transformed into γ-Mo8O246− and the Raman line of MoO42− at 897 cm−1 disappeared. Compared with the species in solution at pH = 2.5, which gave the Raman line of α-Mo8O246− only, this indicated that γ-Mo8O246− was not stable in the more acidic solution of pH = 1.8 and it precipitates, while α-Mo8O246− can exist in a solution of pH = 2.5.
As the pH was lowered to 1.8, the Raman line of γ-Mo8O246− at 965 cm−1 disappeared completely, and a new line of α-Mo8O246− at 959 cm−1 emerged, with a shoulder at 972 cm−1 assigned to β-Mo8O246−, and three weak lines at 984 cm−1, 895 cm−1 and 885 cm−1, which represented symmetric stretch of Mo![[double bond, length as m-dash]](https://www.rsc.org/images/entities/char_e001.gif) O group in Mo36O1168−.30 With further addition of acid until pH = 1.0, the Raman line of β-Mo8O246− changed into the line of α-Mo8O246− in parallel with an increase in height of the Raman lines of Mo36O1168−. This result showed that at low pH, α-Mo8O246− is more stable than β-Mo8O246−.
O group in Mo36O1168−.30 With further addition of acid until pH = 1.0, the Raman line of β-Mo8O246− changed into the line of α-Mo8O246− in parallel with an increase in height of the Raman lines of Mo36O1168−. This result showed that at low pH, α-Mo8O246− is more stable than β-Mo8O246−.
In summary, as the pH is lowered, more isopolymolybdates were aggregated and precipitated. The main species in solution or precipitate are summarized as:17
3.2. Characterization of FeMo catalysts before calcination
SEM images of the FeMo catalysts synthesized at different pH values before calcination are shown in Fig. 3(a–d). There were plentiful aggregates of the particles at pH = 1.0, while particle aggregation became less at higher pH. The cross-sectional area of the aggregated particles was used to measure the aggregation degree rather than their linear dimensions because their shapes were various and irregular. Some typical shapes and areas of aggregated particles are marked in Fig. 3(a–d). The distribution of the areas with different pH values are shown in Fig. 3(e). There were no small particles smaller than 0.01 μm2 at pH = 1.0, that is, there were only bigger particles. The percentage of aggregates larger than 0.5 μm2 decreased with increasing pH until no aggregates existed with the catalyst prepared at pH = 3.5.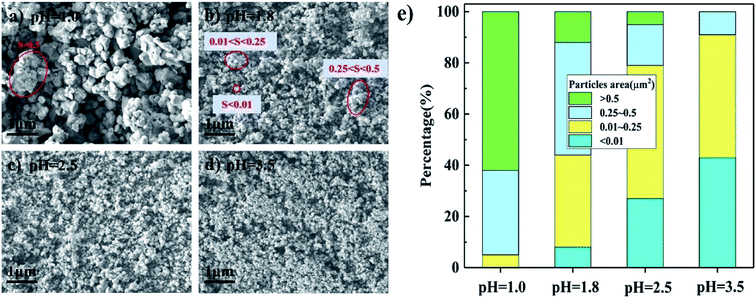 | ||
| Fig. 3 SEM images (a–d) and particles area distribution (e) of catalysts synthesized at different pH before these were calcined. | ||
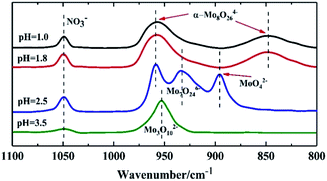
Raman spectra of the FeMo catalysts synthesized at different pH values before calcination are shown in Fig. 4. The structure of the isopolymolybdates in the catalysts synthesized at both pH = 1.0 and 1.8 showed that there was only α-Mo8O246−. However, Mo36O1168− emerged in the precipitates at pH = 1.8 and 1.0 when the Mo7O246− solution was acidified. It was inferred that the high temperature in the preparation of the catalyst prevented the formation of Mo36O1168−.14 The catalyst synthesized at pH = 1.0 showed a more severe aggregation than that at pH = 1.8, which was due to the low solubility of α-Mo8O246− at low pH. With increased pH, only the Raman lines of MoO42− and Mo7O246− existed, until the pH value of 3.5. At the pH value of 3.5, only Mo3O102− existed. This trend showed that the aggregation degree of the precipitates was lower with a higher pH.
3.3. Characterization of catalysts after calcination
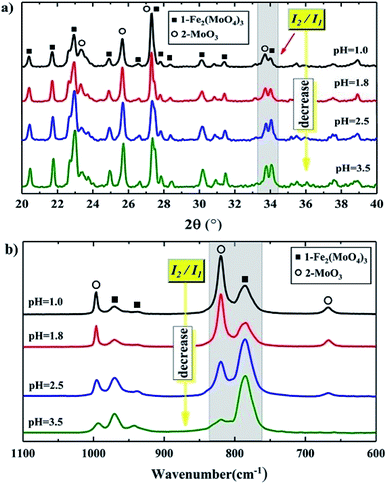
Fig. 5(a) shows the XRD patterns of the catalysts synthesized at different pH after calcination. They showed the same lines, where 2θ = 20.4°, 21.7°, 22.9°, 24.9°, 26.6°, 30.1° and 34.1° were due to Fe2(MoO4)3, and 2θ = 23.1°, 25.7°, 27.3° and 33.7° were assigned to α-MoO3. Fig. 5(b) shows the Raman spectra of these catalysts, where the lines of 936 and 783 cm−1 are the symmetric stretch and asymmetric stretch of terminal Mo![[double bond, length as m-dash]](https://www.rsc.org/images/entities/char_e001.gif) O in iron molybdate,31 respectively. The two bonds at 996 and 820 cm−1 were assigned to the symmetric and asymmetric stretch of Mo
O in iron molybdate,31 respectively. The two bonds at 996 and 820 cm−1 were assigned to the symmetric and asymmetric stretch of Mo![[double bond, length as m-dash]](https://www.rsc.org/images/entities/char_e001.gif) O in α-MoO3,32 respectively. This illustrated that the catalysts synthesized at different pH had the same Fe2(MoO4)3 and MoO3 structures.
O in α-MoO3,32 respectively. This illustrated that the catalysts synthesized at different pH had the same Fe2(MoO4)3 and MoO3 structures.
A further analysis, shown in Fig. 5(a) and (b), illustrates that the relative intensities of the XRD and Raman lines varied as the pH changed. Here, we use I1 and I2 to represent the intensity of the peaks of Fe2(MoO4)3 and MoO3 in the selected area, respectively. I2/I1 roughly represents the relative amount of MoO3 to Fe2(MoO4)3. As the pH was lowered, I2/I1 increased, which meant that there was more MoO3 compared to Fe2(MoO4)3. That is, as the pH was lowered, the relative amount of MoO3 increased. This was also shown by ICP-OES, which gave a more directly measured and accurate Mo/Fe mole ratio of the whole catalyst. As shown in Table 1, the Mo/Fe mole ratio increased with decreasing pH value, indicating that there are more MoO3 in the precipitates at a lower pH value.
| Catalyst | Mo/Fe mole ratio | Loss in filtratesb | Yield of catalysts | BET surface area, m−1 g−1 | ||
|---|---|---|---|---|---|---|
| ICP | EDSa | Mo | Fe | |||
| a From the analysis of the particles in the catalysts.b Mo and Fe lost in the filtrate as percentage of the feed from ICP-AES analysis. | ||||||
| pH = 1.0 | 3.0 | 2.8 | 8.1% | 23.4% | 91.9% | 7.17 |
| pH = 1.8 | 2.5 | 1.9 | 3.5% | 1.5% | 97.5% | 8.85 |
| pH = 2.5 | 2.2 | 1.7 | 7.8% | 3.2% | 92.2% | 9.04 |
| pH = 3.5 | 2.1 | 1.7 | 12.5% | 6.1% | 87.5% | 9.09 |
Fig. 6(a–d) show SEM images of the catalysts synthesized at different pH after calcination. It can be clearly seen that the catalysts comprised particle- and plate-like structures. The EDS measurement results in Fig. 6(e and f) show that the mole ratio of the particles was between 1.7 and 2.8, while the mole ratio of the plate-like structures ranged from 5.0 to 11.6. Combined with the analysis of the XRD patterns and Raman spectra, it was concluded that the particle- and plate-like structures were Fe2(MoO4)3 and MoO3, respectively. Due to that the particles stuck to the plate-like structure, the mole ratio of pure MoO3 is below infinity. The plate-like MoO3 decreased when the pH increased, which is consistent with the XRD patterns and Raman spectra.
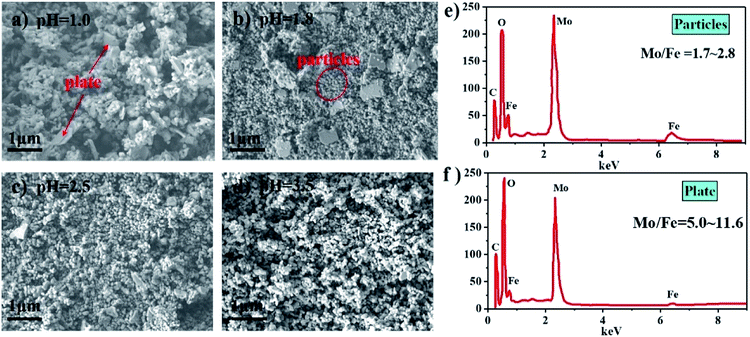 | ||
| Fig. 6 SEM images of catalysts synthesized at different pH (a–d) and EDS results of particles and plate (e and f). | ||
In addition to the effect on the structure of the FeMo catalysts, the Mo/Fe mole ratio also changed with different pH. Table 1 shows the overall Mo/Fe mole ratio of the catalyst, including the particles and plates, analyzed by ICP-OES. The Mo/Fe mole ratio at pH = 1.0 is higher than the mole ratio of the feed because more Fe was lost in the filtrate. At pH = 1.8, the loss of Mo and Fe in the filtrate was lowest and the yield of precipitates in the preparation of the catalyst was highest. With increased pH to 2.5 and 3.5, more Mo and Fe were lost in the filtrate, instead of forming precipitates, because the solubility of the isopolymolybdates increased with decreased pH.
In addition to the influence on the Mo/Fe mole ratio of the total catalysts, the pH also affected the Mo/Fe mole ratio of the iron molybdate particles. As shown in Table 1, the EDS analysis gave a Mo/Fe mole ratio that was lower than that obtained with ICP. This was because the EDS analysis only used the iron molybdate particles, while there existed another structure in these catalysts, which were MoO3 with high a Mo/Fe mole ratio. Since the Mo/Fe mole ratio of the iron molybdate particles was higher than the nominal value for iron molybdate, especially at low pH = 1.0, this implied that the excess Mo was due to more MoO3 adhered to the particles, leading to more severe aggregation. This is consistent with the SEM images in Fig. 6 that there only a few dispersed particles existed while there mainly were severely aggregated particles at the low pH = 1.0.
Fig. 7(a–d) are TEM images of the particles in the catalysts synthesized at different pH values. These clearly showed that there was an amorphous structure on the external layer, and it was thicker as the pH value decreased. The HAADF-STEM image in Fig. 8(a) was taken with a whole particle from the catalyst synthesized at pH = 1.8. Fig. 8(b) gives the weight fraction of Mo, Fe and O from the EDS line scan across the particle marked in Fig. 8(a). This showed that the amorphous layer was enriched in Mo and depleted in Fe as compared with the bulk composition. We concluded that the particles of the catalyst synthesized at the low pH value were enriched in Mo species at the surface.
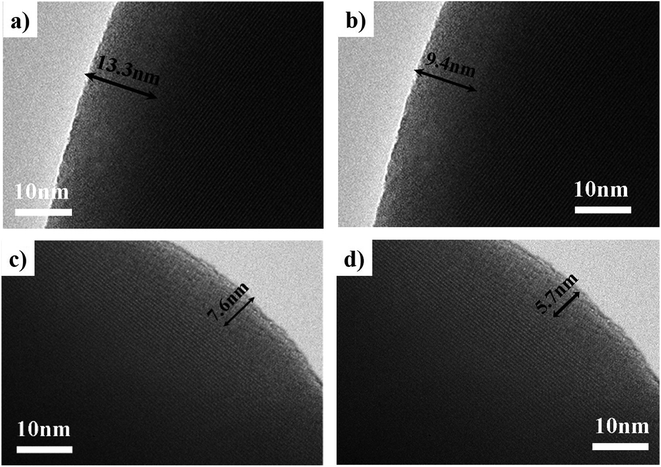 | ||
| Fig. 7 TEM images of catalysts synthesized at pH = 1.0 (a), pH = 1.8 (b), pH = 2.5 (c), pH = 3.5 (d). | ||
 | ||
| Fig. 8 (a) HAADF-STEM image of the catalyst synthesized at and pH = 1.8. (b) EDS line scan showing the Mo, Fe and O distributions along the arrow marked in (a). | ||
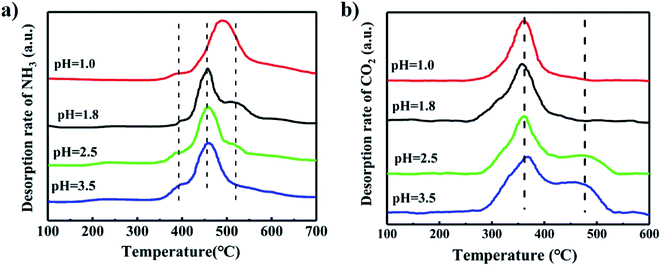
Fig. 9(a) shows the NH3-TPD profiles of the catalysts synthesized at different pH values. The peak at the low temperature near 400 °C was assigned to desorption of NH3 adsorbed on weak acid sites. The peak at the higher temperature above 450 °C was attributed to the desorption of NH3 adsorbed on strong acid sites.33,34 The catalyst synthesized at pH = 1.0 has the highest desorption temperature of NH3, which implied it has the strongest acid site. The small peak above 500 °C was larger with decreased pH, indicating enhancement in the strength of the strong acid sites. We inferred that the low pH value in the synthesis solution caused more plate-like MoO3 to form, which increased the acidity of the catalyst because MoO3 has strong acidity than iron molybdate.35–37
Fig. 9(b) illustrates the CO2-TPD profiles of the catalysts synthesized at different pH values. The peak at 360 °C was ascribed to the desorption of weakly adsorbed CO2. The peak near 480 °C was assigned to desorption of strongly adsorbed CO2, and represents a strong basic site.38,39 The catalyst synthesized at pH value of 1.0 and 1.8 had no strong basic sites, but those synthesized at both 2.5 and 3.5 have the strong basic sites. This is indicated that a low pH value in the catalyst preparation resulted in Mo enrichment on the surface and decreased the basicity of the catalyst.
In summary, when the pH value of the synthesis solution was lowered, the Mo/Fe mole ratio of the catalysts increased. There was more MoO3 with plate-like structure, and the particles were severely aggregated due to much aggregation and poor solubility of the isopolymolybdates at a low pH value. Besides, the low pH also resulted in Mo enrichment on the surface. These factors increased the acidity and decreased the basicity of the catalyst.
3.4. Catalytic performance of the catalysts
As shown in Fig. 10(a), the catalysts synthesized at pH = 2.5 and 3.5 gave better methanol conversion than the catalysts synthesized at pH = 1.8, and especially much better than that at pH = 1.0. A low pH led to severe aggregation of particles, and formed more MoO3 with plate-like structure. The BET results shown in Table 1 shows that the catalysts synthesized at low pH has a low surface area and that at pH = 2.5 and 3.5 have higher surface areas, which is the same trend as the activity test. Iron molybdate is the active phase in FeMo catalysts,40,41 and the activity of MoO3 is extremely poor as shown in Fig. S2† with a methanol conversion that was only 10% at 300 °C. The methanol conversion of all the FeMo catalysts was above 95% at 300 °C. It can be concluded that the low pH in the preparation of a FeMo catalyst led to much aggregation of isopolymolybdates, resulting in severe aggregation of iron molybdate, and gave more MoO3, which severely decreased the activity and the surface area of the catalyst.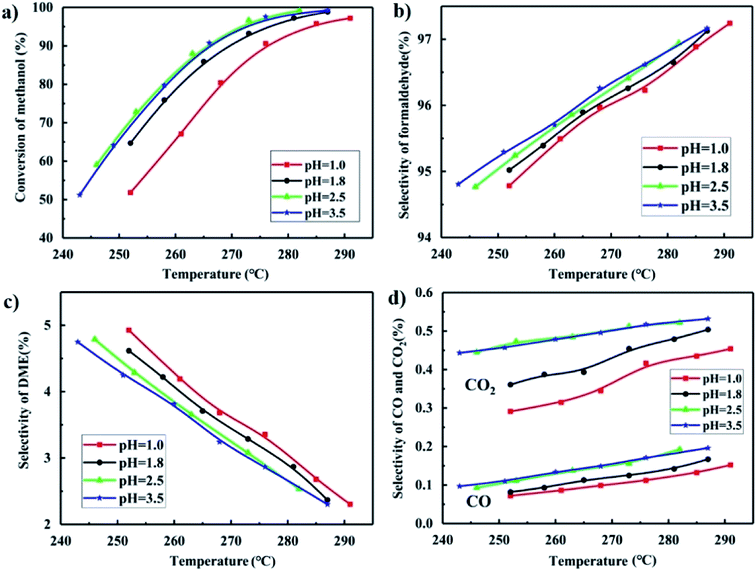 | ||
| Fig. 10 Methanol conversion (a), formaldehyde selectivity (b), DME selectivity (c) and CO and CO2 selectivity (d) of catalysts synthesized at different pH. | ||
In addition to the activity, the pH value also influenced the selectivity of formaldehyde, DME, CO and CO2 as shown in Fig. 10(b–d). The catalysts synthesized at pH = 2.5 and 3.5 gave higher selectivity of the desired product formaldehyde and lower selectivity of the main byproduct DME but higher CO and CO2 selectivity.
The mechanism of the selective oxidation of methanol over FeMo catalyst follows the Mars-van Krevelen mechanism,42 forming the desired product formaldehyde and byproduct DME. The first reaction step is the dissociative chemical adsorption of methanol to form methoxy on the dual acid–base site.43,44 The strong acid sites improved the ability to break the C–H bond with the absorbed methanol than weak acid sites, which has been generally accepted to be rate determining step.45 However, the desorption of reaction products will be harder in a strong than a weak acid site.46 If the acid sites are too strong, the reaction species have enough time to form DME species.47,48 As shown in Fig. 9(a) and 10(c), the catalyst synthesized at pH = 1.0 has the strongest acid and highest DME selectivity. If the basic sites are strong, the absorbed formaldehyde intermediate are oxidized into formate species, and further oxidized to CO and CO2. It is consistent with the basic strength in Fig. 9(b) and the CO and CO2 selectivity in Fig. 10(d).
The conversion of methanol and selectivity of the desired product formaldehyde for the catalysts prepared at pH = 2.5 and 3.5 were approximately the same with the catalyst synthesized at pH = 1.8. However, the yield of the precipitates in the preparation of the catalyst is highest at pH = 1.8, which is of economic value.49 Moreover, the Mo/Fe mole ratio of the catalyst synthesized at pH = 1.8 was higher than at pH = 2.5 and 3.5, which would slow down the deactivation of the catalyst. Therefore, the most suitable pH value in the synthesis condition is pH = 1.8.
4. Conclusions
The structure of synthesized isopolymolybdates, which was determined by Raman spectroscopy, was influenced by the pH of the synthesis solution. The solubility of isopolymolybdates decreased and they were much aggregated at low pH. The FeMo catalysts comprised separated phases of particle- and plate-like structures, which were Fe2(MoO4)3 and MoO3, respectively. A low pH used in the catalyst preparation resulted in severely aggregation of the particles, a high Mo/Fe mole ratio and Mo enrichment of the surface layer, all of which are factors that decreased the activity and selectivity of the FeMo catalyst.Conflicts of interest
There are no conflicts to declare.Acknowledgements
We are grateful for the discussion of the experimental results with our group members.References
- V. Hemmilä, S. Adamopoulos, O. Karlsson and A. Kumar, RSC Adv., 2017, 7, 38604–38630 RSC.
- P. Wallis, E. Schönborn, V. N. Kalevaru, A. Martin and S. Wohlrab, RSC Adv., 2015, 5, 69509–69513 RSC.
- P. Hu, Z. Amghouz, Z. Huang, F. Xu, Y. Chen and X. Tang, Environ. Sci. Technol., 2015, 49, 2384–2390 CrossRef CAS PubMed.
- K. Routray, W. Zhou, C. J. Kiely, W. Grünert and I. E. Wachs, J. Catal., 2010, 275, 84–98 CrossRef CAS.
- V. Soares, M. F. Portela and A. Kiennemann, Catal. Rev., 2005, 47, 125–174 CrossRef.
- V. Raun, J. Johannessen, K. McCormack, C. C. Appel, S. Baier, M. Thorhauge, M. Høj and A. D. Jensen, Chem. Eng. J., 2018, 361, 1285–1295 CrossRef.
- N. Pernicone, Catal. Today, 1991, 11, 85–91 CrossRef CAS.
- N. Burriesci, F. Garbassi, M. Petrera, G. Petrini and N. Pernicone, Solid State Reactions in Fe-Mo Oxide Catalysts for Methanol Oxidation During Aging in Industrial Plants, Stud. Surf. Sci. Catal., 1980, 115–126 CrossRef CAS.
- S. Jacques, O. Leynaud, D. Strusevich, A. Beale, G. Sankar, C. Martin and P. Barnes, Angew. Chem., 2006, 118, 459–462 CrossRef.
- G. Jin, W. Weng, Z. Lin, N. F. Dummer, S. H. Taylor, C. J. Kiely, J. K. Bartley and G. J. Hutchings, J. Catal., 2012, 296, 55–64 CrossRef CAS.
- G. Hill Jr and J. H. Wilson III, J. Mol. Catal., 1990, 63, 65–94 CrossRef.
- J. Uhlrich, J. Sainio, Y. Lei, D. Edwards, R. Davies, M. Bowker, S. Shaikhutdinov and H.-J. Freund, Surf. Sci., 2011, 605, 1550–1555 CrossRef CAS.
- R. Yeo, G. J. Pudge, K. G. Bugler, A. V. Rushby, S. Kondrat, J. Bartley, S. Golunski, S. H. Taylor, E. Gibson and P. P. Wells, Surf. Sci., 2016, 648, 163–169 CrossRef.
- F. Trifiro, Catal. Today, 1998, 41, 21–35 CrossRef CAS.
- G. Alessandrini, L. Cairati, P. Forzatti, P. Villa and F. Trifirò, J. Less-Common Met., 1977, 54, 373–386 CrossRef CAS.
- N. Pernicone, J. Less-Common Met., 1974, 36, 289–297 CrossRef CAS.
- S. Himeno, H. Niiya and T. Ueda, Bull. Chem. Soc. Jpn., 1997, 70, 631–637 CrossRef CAS.
- A. Tsigdinos, H. Y. Chen and B. J. Streusand, Ind. Eng. Chem. Res., 1981, 20, 619–623 CrossRef.
- C. Hong and Y. Li, Chin. J. Chem. Eng., 2006, 14, 670–675 CrossRef CAS.
- Y. Gao, T. Luan, T. Lü, K. Cheng and H. Xu, Chin. J. Chem. Eng., 2013, 21, 1–7 CrossRef CAS.
- C. Liu, Z. Zhou, Y. Huang, Z. Cheng and W. Yuan, Chin. J. Chem. Eng., 2014, 22, 383–391 CrossRef CAS.
- F. Zhang, X. Ren, H. Huang, J. Huang, M. Sudhakar and L. Liu, Chin. J. Chem. Eng., 2018, 26, 1031–1040 CrossRef CAS.
- H. Busey and O. Keller Jr, J. Chem. Phys., 1964, 41, 215–225 CrossRef.
- B. Courcot and A. J. Bridgeman, J. Phys. Chem. A, 2009, 113, 10540–10548 CrossRef CAS PubMed.
- A. Feghhi, R. Malakooti, S. Malakooti and N. Hooshmand, ChemistrySelect, 2019, 4, 2551–2561 CrossRef CAS.
- L. Niven, J. J. Cruywagen and J. B. B. Heyns, J. Chem. Soc., Dalton Trans., 1991, 2007–2011 RSC.
- H. Yang, B. Jiang, Y. Sun, L. Zhang, Z. Sun, J. Wang and X. Tantai, Chem. Eng. J., 2017, 317, 32–41 CrossRef CAS.
- K. Voronko, A. A. Sobol and V. E. Shukshin, Inorg. Mater., 2014, 50, 844–849 CrossRef.
- D. Wharton, J. T. Kloprogge, L. Hickey and R. L. Frost, Am. Mineral., 2002, 87, 623–629 CrossRef.
- J.-l. Zhang, J.-t. Hu and L.-f. Zhang, Chin. J. Chem. Phys., 2016, 29, 425–429 CrossRef CAS.
- Q. Xu, G. Jia, J. Zhang, Z. Feng and C. Li, J. Phys. Chem. C, 2008, 112, 9387–9393 CrossRef CAS.
- M. Py, P. E. Schmid and J. Vallin, Il Nuovo Cimento B, 1977, 38, 271–279 CrossRef.
- S. Liu, H. Zhou, Q. Song and Z. Ma, J. Taiwan Inst. Chem. Eng., 2017, 76, 18–26 CrossRef CAS.
- S. Masiero, N. R. Marcilio and O. W. Perez-Lopez, Catal. Lett., 2009, 131, 194–202 CrossRef CAS.
- M. de Almeida, F. T. C. Souza, M. A. C. Júnior, N. J. A. Albuquerque, S. M. P. Meneghetti and M. R. Meneghetti, Catal. Commun., 2014, 46, 179–182 CrossRef.
- V. Soares, M. Farinha Portela, A. Kiennemann, L. Hilaire and J. M. M. Millet, Appl. Catal., A, 2001, 206, 221–229 CrossRef.
- K.-a. Thavornprasert, M. Capron, L. Jalowiecki-Duhamel, O. Gardoll, M. Trentesaux, A.-S. Mamede, G. Fang, J. Faye, N. Touati, H. Vezin, J.-L. Dubois, J.-L. Couturier and F. Dumeignil, Appl. Catal., B, 2014, 145, 126–135 CrossRef CAS.
- A. Siahvashi and A. A. Adesina, Ind. Eng. Chem. Res., 2013, 52, 15377–15386 CrossRef CAS.
- W.-J. Hong, S. Iwamoto and M. Inoue, Catal. Today, 2011, 164, 489–494 CrossRef CAS.
- H. Kim, B. Ramachandra, J. S. Choi, M. Saidutta, K. Y. Choo, S.-D. Song and Y.-W. Rhee, Catal. Lett., 2004, 98, 161–165 CrossRef.
- V. Raun, L. F. Lundegaard, J. Chevallier, P. Beato, C. C. Appel, K. Nielsen, M. Thorhauge, A. D. Jensen and M. Høj, Catal. Sci. Technol., 2018, 8, 4626–4637 RSC.
- E. Farneth, F. Ohuchi, R. H. Staley, U. Chowdhry and A. W. Sleight, J. Phys. Chem., 1985, 89, 2493–2497 CrossRef.
- M. Ai, J. Catal., 1978, 54, 426–435 CrossRef CAS.
- N. Pernicone, F. Lazzerin, G. Liberti and G. Lanzavecchia, J. Catal., 1969, 14, 293–302 CrossRef CAS.
- M. Bowker, Top. Catal., 2015, 58, 606–612 CrossRef CAS.
- S. Chung, R. Miranda and C. O. Bennett, J. Catal., 1988, 114, 398–410 CrossRef.
- Y. Meng, T. Wang, S. Chen, Y. Zhao, X. Ma and J. Gong, Appl. Catal., B, 2014, 160–161, 161–172 CrossRef CAS.
- G. Jin, W. Weng, Z. Lin, N. F. Dummer, S. H. Taylor, C. J. Kiely, J. K. Bartley and G. J. Hutchings, J. Catal., 2012, 296, 55–64 CrossRef CAS.
- M. Henckens, P. Driessen and E. Worrell, Resour., Conserv. Recycl., 2018, 134, 61–69 CrossRef.
Footnote |
| † Electronic supplementary information (ESI) available. See DOI: 10.1039/c9ra07202k |
| This journal is © The Royal Society of Chemistry 2019 |

