 Open Access Article
Determination of total phosphorus in soil and sludge by an effective headspace gas chromatographic method
Yukai Zhenga,
Weide Fua,
Rencheng Zhua,
Zhanbo Hu *a,
Gang Chenb and
Xin-Sheng Chai
 b
b
aSchool of Resource, Environment and Material, Guangxi University, Nanning, China. E-mail: huzhanbo@gxu.edu.cn; Tel: +86 771 3233545
bState Key Laboratory of Pulp and Paper Engineering, South China University of Technology, Guangzhou, China
First published on 11th December 2019
Abstract
This paper reported a novel method for the determination of total phosphorus (TP) content in soil and sludge by a headspace gas chromatography (HS-GC) method. It was based on a reaction between the soluble phosphate in the digestion solution and calcium oxalate solid to form a calcium phosphate precipitate and release oxalate ions, which can react with permanganate to form carbon dioxide, which was then measured by HS-GC. The results showed the complete conversion of phosphate (meanwhile to free oxalate ions in calcium oxalate) in 15 min at 60 °C. The present method has good repeatability (RSD < 2.6%) and good accuracy (RD < 7.3%) compared to the reference method. Therefore, the present HS-GC method can become a more effective method for determining the TP content in soil and sludge samples.
1. Introduction
Total phosphorus (TP) content is a basic physicochemical index of soil and sludge, since it reflects the potential of their utilization. For example, poor soil usually has a low TP content, while there are some difficulties in the biochemical treatment of sludge with a low TP content.1 However, if the TP content in soil and sludge is too high, it could be a risk to the environment, typically leading to eutrophication due to its leaching into the water.2 Therefore, a method that can effectively determine the TP content in soil and sludge will play an important role in the research and development of soil melioration and the application of sludge as a resource.Because the TP content in soil and sludge samples includes both inorganic and organic phosphorus species, it is mandatory to convert all forms of these species into soluble phosphate through digestion before testing.3 For the TP analysis, the colorimetric method based on ammonium molybdate as a chromogenic agent to form a phosphor-molybdenum blue complex with a maximum absorptivity at 700 nm is the most widely used method.4 Although this method could provide an accurate analysis of phosphate in many water samples, it shows a significant error on testing soil and sludge samples because some co-existing species, mainly silicon, arsenic and vanadium, can also react with molybdate to form a blue-colored complex.4,5 To minimize the effect of these interference species on the spectral measurement, the adjustment of the pH to 4.4 in the test solution has been suggested4 to prevent them from the molybdenum blue related complex formation. However, the results showed that such treatments cannot completely eliminate the effect of silicon's interference because its content in soil samples is too high.6,7 In addition, some organic cations such as cationic dyes and quaternary ammonium ions in the samples also have an impact on the phosphor-molybdenum blue measurements.7
In order to eliminate the interference of other substances in the sample matrix, separation-based detection techniques such as ion chromatography (IC) and high-performance liquid chromatography (HPLC) have also been proposed. Although these methods have a high sensitivity for phosphate detection,8,9 there is a great risk in deteriorating the column separation portion in IC or HPLC systems due to the presence of tiny particles, organic acids and inorganic salts in the digestion solution.10 As a result, time-consuming and tedious pretreatment procedures such as solvent extraction and filtration must be applied to remove these species before IC or HPLC testing. The extractant used is usually a toxic organic solvent, e.g., chloroform, which is harmful to both the environment and operators.11 Therefore, these methods are very limited in practical applications. Although the phosphate content can be determined by inductively-coupled plasma emission spectrometry (ICP-OES) or inductively coupled plasma mass spectrometry (ICP-MS),12–14 the high level of inorganic salts in the soil or sludge samples has a great impact on the accuracy of the results.15,16
The headspace gas chromatography (HS-GC) technique is an effective technique for directly determining the volatile species in samples with a complex matrix, without or with less pretreatment.17 If the non-volatile components in the samples are converted into volatile species by chemical reactions, e.g., neutralization and redox, the applicability of HS-GC could be greatly broadened. In the previous work,18,19 we successfully determined the amounts of oxalate and hydrogen peroxide in the industrial process effluents by an oxidation–reduction reaction. Because phosphate can react with calcium ions in calcium oxalate to form insoluble calcium phosphate and release oxalate ions in the solution,20 it can be indirectly determined by measuring the carbon dioxide (CO2) produced by the reaction between a strong oxidant (e.g., potassium permanganate) and the free oxalate ions in the supernatant in a sealed vial using a HS-GC technique. Compared to the abovementioned method, sample pretreatment before the instrument test is greatly simplified.
In this work, we proposed a redox reaction-based HS-GC method for the determination of TP in soil and sludge samples. The main focus of this work was the establishment of the method, optimization of the conditions for calcium phosphate formation with an excess amount of calcium oxalate and the selection of the conditions (mainly the equilibrium time and temperature) in the HS-GC measurement. The performance of the method was also evaluated. The present method was effective and could be a valuable tool for the determination of TP content in soil and sludge samples.
2. Experimental
2.1 Chemicals and samples
All chemicals used in the experiment were of analytical grade and purchased from commercial sources. The soil samples were collected from the farmland of Guangxi University (at N 22°51′3.21′′ and E 108°17′25.56′′), and the sludge samples were collected from Nanning Jiangnan Sewage Treatment Plant, Nanning, Guangxi Autonomous Region, China (at N 22°46′58.31′′ and E 108°19′14.34′′).2.2 Apparatus and operation
The HS-GC measurements were conducted by an automated headspace sampler (HS 86.50, DANI, Italy) and a GC system (7820A, Agilent, US) equipped with a thermal conductivity detector (TCD). The headspace operating conditions were as follows. The pressurization and carrier gas pressure were 2.0 and 1.5 bar, respectively. The vial pressurization, loop equilibration, and sample-loop fill time were 0.20, 0.05 and 0.20 min, respectively. The capillary column with an i.d. of 0.53 mm and a length of 30 m (Model GS-Q, J&W Scientific, USA) was operated at 30 °C with nitrogen carrier gas (flow rate = 3.1 mL min−1) for separating the CO2 in the GC measurement. The temperature for TCD operation was 220 °C.2.3 Procedures of sample preparation
For the analysis of TP in soil and sludge, sample digestion needed to be performed to ensure that all of the phosphorus species converted to soluble phosphate. Prior to the digestion process, the soil or sludge samples were air-dried, crushed, screened through a 0.149 mm mesh sieve to remove the debris, and well-mixed. Then, a microwave digestion process was performed in the present method,3 in which a set of 100 mL polytetrafluoroethylene (PTFE) digestion vessels and a microwave oven (MWD-600, METASH, China) were selected. Each vessel contained 0.25 g of the dried soil or sludge samples and 10 mL of concentrated HNO3. They were heated for 10 min with 574 W of microwave power to increase the temperature to 175 °C and then maintain the temperature at 175–180 °C.After digestion, the resulting solution was diluted with distilled water to a final volume of 50 mL. Then, 5 mL of the solution was removed and placed in a 50 mL centrifugal tube that contained 10 mL of a sodium hydroxide solution (2.0 mol L−1), 0.5 g of calcium oxalate powder and 40 mL of deionized water. The centrifugal tubes were placed in the incubator for strong agitation. The supernatant of the above solutions was filtered with a 0.45 μm membrane.
The filtrate (0.5 mL) and the 2.0 mL sulfuric acid solution (2.0 mol L−1) were placed in 21.6 mL volume commercial headspace sample vials, which had a small tube containing 0.5 mL of a potassium permanganate solution (0.1 mol L−1). After the headspace vial was sealed with a septum, it was shaken to ensure good mixing and preparation for the HS-GC measurement.
3. Results and discussion
3.1 Methodology
There were two steps involved in the present method, i.e., the soluble phosphate reacted with the calcium oxalate precipitated in the alkaline medium to release free oxalate ions,| 2PO43−(aq) + 3CaC2O4(s) → Ca3(PO4)2(s) + 3C2O42−(aq) | (1) |
Then, the free oxalate ions reacted with permanganate in an acidic medium to generate CO2 in a sealed vial,
| 5C2O42− + 2MnO4− + 16H+ → 2Mn2+ + 8H2O + 10CO2 | (2) |
Thus, by measuring the CO2 in the vial, the phosphate content in the sample was indirectly determined by HS-GC.
3.2 Conditions for the complete conversion of phosphate to oxalate
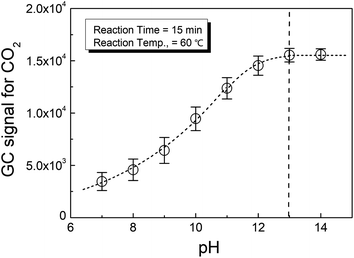
Fig. 1 shows the effect of pH on the phosphate conversion as evaluated by HS-GC, which measured the GC signal for CO2 according to reaction (2). It could be seen from the figure that the CO2 from the reaction increased with pH until it was greater than 13.
This meant that the selection of the pH in the reaction medium was important to the complete conversion of phosphate to release oxalate from calcium oxalate. Therefore, strong alkali conditions, i.e., pH > 13, were suggested for the present method.
3.3 The reaction and equilibration conditions and in the HS-GC measurement
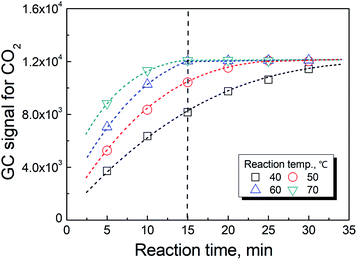
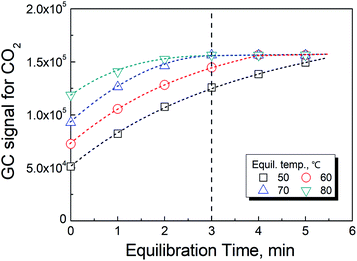
As previously reported,19 the temperature has a significant effect on increasing the rate in reaction (2). However, the rate of the reaction could not be further improved when the temperature was greater than 70 °C as shown in Fig. 3. In actuality, the information shown in these figures also included the time for the phase equilibration at the given temperature. Therefore, we chose 70 °C and 3 min as the conditions for the HS-GC measurement.3.4 Method calibration, precision and validation
![[thin space (1/6-em)]](https://www.rsc.org/images/entities/char_2009.gif) 000 mg kg−1, 0.25 g of dried soil or sludge was suggested. If the TP concentration in the sample was too high, a smaller sample size was used.
000 mg kg−1, 0.25 g of dried soil or sludge was suggested. If the TP concentration in the sample was too high, a smaller sample size was used.
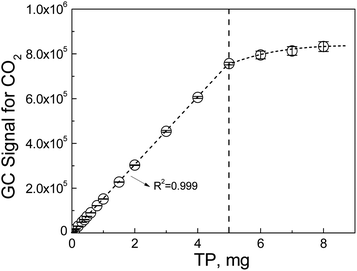
By plotting the GC signals for CO2 vs. the amount of TP in the solutions, a standard calibration curve was obtained that could be expressed as
| A = 464(±181) + 151211(±591) × m (n = 7, R2 = 0.999) | (3) |
Therefore, the phosphate concentration (mg kg−1 P−1) in soil or sludge could be calculated by
 | (4) |
The limit of detection (LOD) and the limit of quantity (LOQ) of the HS-GC method for TP was calculated23 based on the intercept, uncertainty of the intercept and slope in eqn (3). The LOD and LOQ were 2.5 and 8.3 mg kg−1, respectively, when 0.25 g of the dried sample mass was used. Therefore, the present HS-GC method was more sensitive than the reference method for the TP analysis because its LOD and LOQ were 10.0 and 40.0 mg kg−1, respectively.
| Replica no. | TP, mg kg−1 | |||||
|---|---|---|---|---|---|---|
| Soil 1 | Soil 2 | Soil 3 | Sludge 1 | Sludge 2 | Sludge 3 | |
| 1 | 88.2 | 441 | 865 | 326 | 679 | 1486 |
| 2 | 86.5 | 444 | 850 | 319 | 684 | 1512 |
| 3 | 83.2 | 438 | 873 | 332 | 679 | 1444 |
| 4 | 84.3 | 453 | 859 | 328 | 660 | 1509 |
| 5 | 87.7 | 460 | 873 | 333 | 664 | 1473 |
| Average | 86.0 | 447 | 864 | 328 | 673 | 1485 |
| RSD, % | 2.6 | 1.9 | 1.2 | 1.6 | 1.6 | 1.9 |
| Sample no. | TP, mg kg−1 | Recovered, % | |
|---|---|---|---|
| Added | Measured | ||
| 1 | 50 | 55.6 | 111.2 |
| 2 | 100 | 108.1 | 108.1 |
| 3 | 200 | 202.3 | 101.1 |
| 4 | 500 | 482.2 | 96.4 |
| 5 | 1000 | 956.7 | 95.7 |
| 6 | 1500 | 1449.8 | 96.6 |
| 7 | 2000 | 1923.1 | 96.2 |
The accuracy of the present method was evaluated by conducting a comparison test with the traditional colorimetric method4 based on 3 soil and 3 sludge samples from different sources as shown in Table 3. It was seen that there was a good agreement between the results from the traditional colorimetric method and the present HS-GC method. The relative difference (RD) in the data between these two methods was less than 7.3%, indicating that the present method was justifiable for testing the TP content in soil or sludge samples.
| Sample ID | TP, mg kg−1 | RD, % | |
|---|---|---|---|
| Colorimetric method (n = 3) | HS-GC method (n = 3) | ||
| Soil 1 | 92.7 ± 9.8 | 85.9 ± 2.1 | −7.3 |
| Soil 2 | 476 ± 18 | 447 ± 9 | −6.1 |
| Soil 3 | 892 ± 24 | 864 ± 10 | −3.1 |
| Sludge 1 | 336 ± 10 | 328 ± 6 | −2.1 |
| Sludge 2 | 682 ± 15 | 643 ± 11 | −5.7 |
| Sludge 3 | 1584 ± 51 | 1485 ± 28 | −6.3 |
It was also noticed in Table 3 that the TP content measured by the traditional colorimetric method was slightly higher than that of the HS-GC method. We believed that such a positive error was caused by the interfering species, which was a major problem for the colorimetric method when dealing with soil samples.7
The effect of the interference in soil and sludge on the methods for TP determination was studied by adding different amounts (0–500 mg) of SiO2, as a typical co-existing species,5 into the same dried sludge sample (0.25 g). The results are listed in Table 4. It could be seen from the table that the effect of the SiO2 interference on the colorimetric method was more significant with an increase in the added SiO2 mass. However, the addition of SiO2 had no effect on the HS-GC measurement. It further proved that the results from the present method were more objective than the traditional method for the quantification of TP content in soil and sludge samples.
| Sample ID | SiO2 added, mg | TP, mg kg−1 | |
|---|---|---|---|
| Colorimetric method | HS-GC method | ||
| 1 | 0 | 533.5 | 512.2 |
| 2 | 50 | 569.1 | 519.1 |
| 3 | 100 | 605.1 | 509.6 |
| 4 | 200 | 683.5 | 515.4 |
| 5 | 300 | 753.4 | 516.3 |
| 6 | 500 | 895.5 | 514.6 |
3.5. Applications: effect of the hydraulic residence time on the TP level in the residual sludge
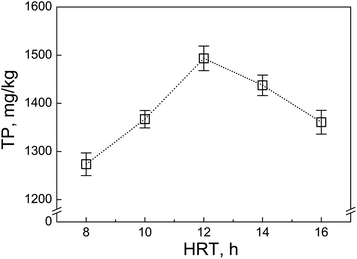
Hydraulic residence time (HRT) is a key operation parameter in wastewater treatment since it could greatly affect the TP removal efficiency and the TP level in residual sludge. Fig. 5 shows the TP concentration in the residual sludge from a lab-scale anoxic/oxic system with different HRT (6–14 h). Clearly, the TP level in the excess sludge increased with increasing HRT. However, if the HRT was too long (>12 h), the TP level decreased. This was because the longer HRT referred to the carbon resource limit occurring in the system, in which the glycogen accumulating organisms (GAOs) became dominant and suppressed the phosphorus release ability of the polyphosphate-accumulating organisms (PAOs) in the sludge.24 It was also noticed that the decrease in the TP level compared with that of the longer HRT seemed more significant under the lower HRT.4. Conclusion
A novel HS-GC method for the determination of TP content in soil and sludge was developed. The results showed that the present method could effectively eliminate interferences from some co-existing species in the samples from the conventional method. The present method had a good precision, accuracy and sensitivity for the TP analysis. Therefore, it was very suitable for testing the TP content in soil and sludge samples.Conflicts of interest
There are no conflicts to declare.Acknowledgements
The authors acknowledge the financial support from the National Key Technologies Research and Development Program, China (Grant No. 2018YFC1902102), the Research and Development Program of Guangxi, China (Grant No. AB19110001), the Key Project of the Science and Technology Ministry of Nanning, China (Grant No. 20183045-2), and the Science and Technology Base and Talent Project of Guangxi, China (Grant No. AD17195092).References
- K. Gorazda, B. Tarko, S. Werle and Z. Wzorek, Waste Manag., 2018, 73, 404–415 CrossRef CAS PubMed.
- W. M. Roberts, J. L. Gonzalez-Jimenez, D. G. Doody, P. Jordan and K. Daly, Sci. Total Environ., 2017, 589, 25–35 CrossRef CAS PubMed.
- B. L. Turner, B. J. Cade-Menun, L. M. Condron and S. Newman, Talanta, 2005, 66, 294–306 CrossRef CAS PubMed.
- APHA, Standard Methods for the Examination of Water and Wastewater, American Public Health Association, Washington D.C., US, 2005 Search PubMed.
- J. M. Estela and V. Cerdà, Talanta, 2005, 66, 307–331 CrossRef CAS PubMed.
- P. Worsfold, I. McKelvie and P. Monbet, Anal. Chim. Acta, 2016, 918, 8–20 CrossRef CAS PubMed.
- B. L. Turner, S. Newman and K. R. Reddy, Environ. Sci. Technol., 2006, 40, 3349–3354 CrossRef CAS PubMed.
- B. López-Ruiz, J. Chromatogr. A, 2000, 881, 607–627 CrossRef.
- M. F. Mesko, M. G. Crizel, D. L. R. Novo, C. A. Hartwig, F. S. Rondan and C. A. Bizzi, Arabian J. Chem., 2018 DOI:10.1016/j.arabjc.2018.03.006.
- V. Ruiz-Calero and M. T. Galceran, Talanta, 2005, 66, 376–410 CrossRef CAS.
- H.-C. Hu, X.-F. Yang, T.-T. He, L.-L. Huang and L.-H. Chen, Energy Fuels, 2015, 29, 7428–7432 CrossRef CAS.
- M. Shah and J. A. Caruso, J. Sep. Sci., 2005, 28, 1969–1984 CrossRef CAS PubMed.
- A. Krejčová, T. Černohorský and D. Meixner, Food Chem., 2007, 105, 242–247 CrossRef.
- C. Lubos, S. Dreibrodt and A. Bahr, J. Archaeol. Sci. Rep., 2016, 9, 44–53 Search PubMed.
- M. F. Mesko, R. S. Picoloto, L. R. Ferreira, V. C. Costa, C. M. P. Pereira, P. Colepicolo, E. I. Muller and E. M. M. Flores, J. Anal. At. Spectrom., 2015, 30, 260–266 RSC.
- J. Weiss, Handbook of Ion Chromatography, 3 Volume Set, John Wiley & Sons, 2016 Search PubMed.
- B. Kolb and L. S. Ettre, Static headspace-gas chromatography: theory and practice, John Wiley & Sons, 2006 Search PubMed.
- H.-C. Hu, H.-J. Jin and X.-S. Chai, J. Chromatogr. A, 2012, 1235, 182–184 CrossRef CAS PubMed.
- H. Li, X.-S. Chai, N. DeMartini, H. Zhan and S. Fu, J. Chromatogr. A, 2008, 1192, 208–211 CrossRef CAS.
- D. L. R. Novo, R. M. Pereira, C. A. Hartwig, C. M. M. Santos and M. F. Mesko, Talanta, 2018, 181, 440–447 CrossRef CAS PubMed.
- S. Chutipongtanate and V. Thongboonkerd, Clin. Chem. Lab. Med., 2012, 50, 1697–1698 CAS.
- B. M. De Borba, R. F. Jack, J. S. Rohrer, J. Wirt and D. Wang, J. Chromatogr. A, 2014, 1369, 131–137 CrossRef CAS.
- J. M. Green, Anal. Chem., 1996, 68, 305A–309A CrossRef CAS.
- M. Carvalheira, A. Oehmen, G. Carvalho, M. Eusébio and M. A. M. Reis, Water Res., 2014, 66, 296–307 CrossRef CAS.
| This journal is © The Royal Society of Chemistry 2019 |

