 Open Access Article
Resin-gel incorporation of high concentrations of W6+ and Zn2+ into TiO2-anatase crystal to form quaternary mixed-metal oxides: effect on the a lattice parameter and photodegradation efficiency†
Lerato Hlekelele *abc,
Shane H. Durbachab,
Vongani P. Chauke
 c,
Farai Dziikeab and
Paul J. Franklyna
aMolecular Science Institute, School of Chemistry, University of the Witwatersrand, Johannesburg, 2050, South Africa. E-mail: LHlekelele@csir.co.za
bDST-NRF Centre of Excellence in Strong Materials, University of the Witwatersrand, WITS, 2050, Johannesburg, South Africa
cPolymers and Composites, Materials Science and Manufacturing, Council for Scientific and Industrial Research, P. O. Box 395, 0001, Pretoria, South Africa
First published on 13th November 2019
Abstract
The search for a viable photocatalyst for water remediation is ongoing and in recent times the efforts have predominantly focused on improving the limitations of the TiO2 photocatalyst. This paper reports a dual strategy for improving the photocatalytic properties of TiO2. The first strategy is to dope up to 30% of W6+ and Zn2+ into the crystal lattice of TiO2 using the resin gel technique to synthesize quaternary mixed metal oxides (QMMOs). It was demonstrated by laser Raman spectroscopy, PXRD and various other strategies, including dislodging the dopants from the crystal lattice of TiO2, that these materials were successfully synthesized. More importantly, UV-DRS showed that these materials could absorb visible light. TiO2 and the QMMOs were also supported on 10% NCNTs synthesized from coal fly ash, by slightly modifying the resin gel technique. It was observed from TEM images that the NCNTs were uniformly coated with TiO2 and QMMO nanoparticles. These composites were observed to have lower photoluminescence emission spectra when compared to neat TiO2 and unsupported QMMOs. The two-part strategy employed in this project worked as the QMMOs supported on 10% NCNTs had higher visible light photodegradation efficiencies compared to neat TiO2 and the unsupported QMMOs.
Introduction
Nanoscale applications of TiO2 are principally derived from its semiconductor properties, the oldest example of this is that of light aided H2 production on a TiO2 anode.1 Research on nanoscale TiO2 has also been expanded to areas such as photovoltaics, photo-electrochemical sensors, medical and biomedical applications and photocatalysis for environmental conservation and water splitting.The photoactivity of TiO2 has been shown to be reliant on its surface and crystal properties; these include morphology, surface area, polymorphic phase, lattice defects, the extent of crystallinity, particle size, the presence of uncoordinated surface sites and exposed crystal facets among other things.2–7 For instance, Thuy-Duong and co-workers demonstrated the photodegradation of methylene blue had a strong dependency on the TiO2 morphology; TiO2 in the shape of a flower containing rutile nano-prisms adhered by anatase nanoparticles showed the best photodegradation efficiency whereas the material with a hierarchical cauliflower morphology had the least photoactivity.8 In another study, He et al. demonstrated how the morphology of TiO2, its crystal size, and calcination progress affected the photodegradation of gaseous benzene.9
Another strategy of improving the photocatalytic properties of TiO2 is by compositing it with other materials like zeolites (molecular sieves), carbon nanomaterials, fly ash, stainless steel, glass, silica, polymers, and zeolites among other materials.10–16 In instances where TiO2 is supported on steel and glass, the aim is usually for just immobilizing the TiO2 nanoparticles to ensure it is easy to separate them from treated water.10,17,18 On the other hand, materials such as zeolites and carbon nanomaterials (CNMs) (including nitrogen-doped carbon nanotubes (NCNTs)) are used as functional materials; they improve the photocatalytic activity of TiO2 by trapping the photo-induced electrons thus separating the active charge carriers.12,14,19,20
Surface doping of TiO2 with metal nanoparticles has also been shown to be an effective way of improving the photocatalytic efficiency of TiO2. Zero-valent transition metals have been loaded onto TiO2 in attempts to improve its photocatalytic efficiencies.21,22 Dziike et al. reported that the photocatalytic activity of TiO2 was increased by loading Ni nanoparticles onto it and attributed the increase in activity to the separation of the active charge carriers.3 This occurs because the Fermi level of TiO2 is higher than that of most of the metal nanoparticles commonly used for this purpose, so the electrons migrate from TiO2 to the metal nanoparticles resulting in a space charge layer at the boundaries between TiO2 and the metal nanoparticles. The electric field created drives the electrons to the inside and the holes are drawn to the interfacial region of TiO2.22 Therefore, in setups like this, metal nanoparticles act as electron sinks thus resulting in the efficacy of the charge carrier separation and subsequent inhibition of recombination.21–23 This is also applicable for noble metal nanoparticles.3,16,24–27 Additionally, when noble metals are dispersed on the surface of TiO2 a plasmonic composite can be formed that allows the material to be able to absorb visible light by surface plasmon resonance (SPR).3,16,28–30
Other scientists have investigated compositing TiO2 with other photocatalytic (semiconductors) materials such as ZnO, NiO, WO3, and Fe2O3.31,32 WO3 is one of the semiconductors that have attracted much attention for compositing with TiO2. Both Do et al. and Know et al. have tested the photoactivity of TiO2/WO3 for the photodegradation of dichlorobenzene under UV-light, and reported superior activities for these composites compared to that of TiO2 alone.33,34 Here, the enhanced activity was due to the electron band positions of WO3 and TiO2 having been favorably positioned for charge separation. The photoactivity of TiO2/WO3 composites have also been measured under visible radiation, as the bandgap of WO3 is narrower (2.8 eV), and was shown to be superior to that of individual WO3 and TiO2 under visible light.25,31,35 ZnO is another semiconductor that has UV-light photoactivity that has rivaled that of TiO2, however, it has been shown to suffer from photocorrosion which significantly reduced its activity and stability.36,37 Fang-Xing Xiao synthesized ZnO–TiO2 nanotubes (TNTs) that were highly ordered and had photoactivity that was higher than that of ZnO and TiO2 separately.38 Here the increased activity was attributed to better charge separation. It was suggested that holes accumulated at the valence band of ZnO and electrons accumulated at the conduction band of TiO2 so that migration could occur with minimal recombination.31,37–39
The abovementioned examples have focused on the formation of mixtures of metal oxides, where a great deal of research has been performed. On the contrary, less research has been focused on the synthesis and use of TiO2-based mixed metal oxides by introducing foreign metal ions into its crystal lattice structure for use in photocatalysis. In order to achieve this, it is important that the crystal structure of TiO2 be understood in order to systematically introduce foreign metal ions into its crystal lattice. One of the important crystal structural properties of anatase is that the atoms are comparatively loosely packed with fairly large vacancies thus the anatase phase has the ability to hold multiple cation oxidation states and environments.40–43 This makes it possible to introduce other metal ions into the anatase crystal, through replacement of Ti ions and/or vacancy occupation.
In this research, the incorporation of Zn2+ and W6+ into the crystal lattice of TiO2 using a novel resin gel method to form quaternary mixed metal oxides (QMMOs) is reported. Franklyn and Narrandes have demonstrated the applicability of the resin gel synthesis technique for the synthesis of TiO2.44
Experimental
Synthesis of QMMOs
The principles of the resin gel technique are described by Franklyn and Narrandes.44 An appropriate volume of TiCl4 (Fluka) was measured and dissolved in 10 ml ethanol (Sigma Aldrich) kept at 0 °C using ice whilst stirring magnetically. An appropriate mass of Zn(NO3)2·4H20 (Merck) was weighed and dissolved in 10 ml ethanol by stirring. Having made the ethanoic Zn2+ solution, 50 g of polyethylene glycol, Mw 8.000 g mol−1 (Sigma Aldrich) was added to it, heated to 150 °C whilst stirring until all the polymer had dissolved. The W6+ solution was prepared by dissolving an appropriate mass of H2WO4 (Sigma Aldrich) in 10 ml NH4OH (Sigma Aldrich). The Ti4+ solution was added to the W6+ solution and stirred for 5 min and the solution consisting of Zn2+ and PEG was added to the mixture and stirred for a further 60 min. The white viscous homogenous solution that formed was then placed under a 200 W incandescent lamp until it was completely desolvated and a hard wax had formed. The samples were then transferred into ceramic crucibles, placed on a sand bath and heated to 300 °C. Here, the sample liquefied. The temperature of the sand bath was then increased to 400 °C, where some of the samples ignited. The samples that had not ignited were burned from above with a Bunsen burner to induce ignition. The burning of the samples was allowed to go on until the flames ceased by themselves at which point the samples were now in the form of black granular powder.The samples were then calcined at 400 °C for 12 h in the air to crystallize the particles and remove the soot. The calcination conditions were optimized where it was realized that 400 °C for 12 h was optimal; calcining at higher temperatures resulted in undesirable phase transformation, whereas lower temperatures were not suitable for the complete removal of soot.
The metal ion ratios (Ti4+![[thin space (1/6-em)]](https://www.rsc.org/images/entities/char_2009.gif) :
:![[thin space (1/6-em)]](https://www.rsc.org/images/entities/char_2009.gif) W6+
W6+![[thin space (1/6-em)]](https://www.rsc.org/images/entities/char_2009.gif) :
:![[thin space (1/6-em)]](https://www.rsc.org/images/entities/char_2009.gif) Zn2+) of the samples prepared were: (9
Zn2+) of the samples prepared were: (9![[thin space (1/6-em)]](https://www.rsc.org/images/entities/char_2009.gif) :
:![[thin space (1/6-em)]](https://www.rsc.org/images/entities/char_2009.gif) 1
1![[thin space (1/6-em)]](https://www.rsc.org/images/entities/char_2009.gif) :
:![[thin space (1/6-em)]](https://www.rsc.org/images/entities/char_2009.gif) 0), (9
0), (9![[thin space (1/6-em)]](https://www.rsc.org/images/entities/char_2009.gif) :
:![[thin space (1/6-em)]](https://www.rsc.org/images/entities/char_2009.gif) 0
0![[thin space (1/6-em)]](https://www.rsc.org/images/entities/char_2009.gif) :
:![[thin space (1/6-em)]](https://www.rsc.org/images/entities/char_2009.gif) 1), (8
1), (8![[thin space (1/6-em)]](https://www.rsc.org/images/entities/char_2009.gif) :
:![[thin space (1/6-em)]](https://www.rsc.org/images/entities/char_2009.gif) 2
2![[thin space (1/6-em)]](https://www.rsc.org/images/entities/char_2009.gif) :
:![[thin space (1/6-em)]](https://www.rsc.org/images/entities/char_2009.gif) 0), (8
0), (8![[thin space (1/6-em)]](https://www.rsc.org/images/entities/char_2009.gif) :
:![[thin space (1/6-em)]](https://www.rsc.org/images/entities/char_2009.gif) 1
1![[thin space (1/6-em)]](https://www.rsc.org/images/entities/char_2009.gif) :
:![[thin space (1/6-em)]](https://www.rsc.org/images/entities/char_2009.gif) 1), (8
1), (8![[thin space (1/6-em)]](https://www.rsc.org/images/entities/char_2009.gif) :
:![[thin space (1/6-em)]](https://www.rsc.org/images/entities/char_2009.gif) 0
0![[thin space (1/6-em)]](https://www.rsc.org/images/entities/char_2009.gif) :
:![[thin space (1/6-em)]](https://www.rsc.org/images/entities/char_2009.gif) 2), (7
2), (7![[thin space (1/6-em)]](https://www.rsc.org/images/entities/char_2009.gif) :
:![[thin space (1/6-em)]](https://www.rsc.org/images/entities/char_2009.gif) 3
3![[thin space (1/6-em)]](https://www.rsc.org/images/entities/char_2009.gif) :
:![[thin space (1/6-em)]](https://www.rsc.org/images/entities/char_2009.gif) 0), (7
0), (7![[thin space (1/6-em)]](https://www.rsc.org/images/entities/char_2009.gif) :
:![[thin space (1/6-em)]](https://www.rsc.org/images/entities/char_2009.gif) 2
2![[thin space (1/6-em)]](https://www.rsc.org/images/entities/char_2009.gif) :
:![[thin space (1/6-em)]](https://www.rsc.org/images/entities/char_2009.gif) 1), (7
1), (7![[thin space (1/6-em)]](https://www.rsc.org/images/entities/char_2009.gif) :
:![[thin space (1/6-em)]](https://www.rsc.org/images/entities/char_2009.gif) 1
1![[thin space (1/6-em)]](https://www.rsc.org/images/entities/char_2009.gif) :
:![[thin space (1/6-em)]](https://www.rsc.org/images/entities/char_2009.gif) 2) and (7
2) and (7![[thin space (1/6-em)]](https://www.rsc.org/images/entities/char_2009.gif) :
:![[thin space (1/6-em)]](https://www.rsc.org/images/entities/char_2009.gif) 0
0![[thin space (1/6-em)]](https://www.rsc.org/images/entities/char_2009.gif) :
:![[thin space (1/6-em)]](https://www.rsc.org/images/entities/char_2009.gif) 3). The pure metal oxides were prepared following the same procedure as for the mixed metal oxides except that the solvents were added without the other metal precursor(s), i.e. TiO2 was synthesized in exactly the same way as QMMOs except for that H2WO3 and Zn(NO3)2·4H2O were not added to the mixture. Such was the case for the synthesis of WO3 and ZnO. The pure metal oxides and QMMOs that were calcined at 400 °C for 12 h in the air were labeled as described in Table S1.†
3). The pure metal oxides were prepared following the same procedure as for the mixed metal oxides except that the solvents were added without the other metal precursor(s), i.e. TiO2 was synthesized in exactly the same way as QMMOs except for that H2WO3 and Zn(NO3)2·4H2O were not added to the mixture. Such was the case for the synthesis of WO3 and ZnO. The pure metal oxides and QMMOs that were calcined at 400 °C for 12 h in the air were labeled as described in Table S1.†
Synthesis and purification of NCNTs
The description of the synthesis and purification processes of the NCNTs that were used in this study have been described in our previous reports.19,45 Concisely, a two-stage quartz tube furnace with independent thermocouples and controllers was used for the synthesis of NCNTs. A gram of the carbon and nitrogen source, melamine (Sigma Aldrich), was placed in a quartz boat and placed in the middle of the first-stage furnace. The coal fly ash catalyst (0.5 g, from Eskom) in a quartz boat was then placed in the middle of a second-stage furnace.The second-stage furnace containing CFA was heated to 900 °C (ramped at 10 °C min−1) whilst N2(g) (AFROX) was flowing (flow rate of 50 ml min−1) into the quartz tube reactor, in through the first furnace and out the second furnace. Once the second stage furnace had reached 900 °C, the temperature of the 2nd stage was heated to 350 °C in 10 min (35 °C min−1). At this temperature, melamine was vaporized and its fumes were carried into the second stage furnace by nitrogen gas for the growth of the NCNTs.
The as-prepared NCNTs were stirred in 20 ml of 5% HF (HF Chemicals) aqueous solution for 24 h at room temperature. The mixture was diluted with 150 ml of distilled water, centrifuged and washed several times with water. The wet mud was transferred into a round bottom flask that contained 30 ml HNO3, 10 ml H2SO4 (both Sigma-Aldrich) and 60 ml water and heated at 60 °C for 12 h.
This was followed by compositing the various QMMOs with NCNTs. Here, the resins were synthesized as described above except that in this instance they were prepared in the presence of NCNTs and were not ignited. An amount of NCNTs corresponding to 10% (m/m) of NCNTs relative to that of the various QMMOs or TiO2, was added to the white homogeneous solution of QMMOs or TiO2 and stirred magnetically for 2 h until a grey homogeneous mixture was formed. The mixtures were then transferred into pressure sealed autoclaves lined with Teflon to complete the reactions at 150 °C for 12 h. Grey precipitates were collected, centrifuged and washed with distilled water. The resulting materials were then calcined at 400 °C for 12 h to remove the soot.
Materials characterization
The materials, i.e. pure metal oxides and the various QMMOs and NCNTs based composites were characterized using several characterization techniques. The crystallization of the materials was characterized by powder X-ray diffraction (PXRD) at 2θ position ranging between 10 and 90° using a Bruker D2 phaser (Bruker AXS, Karlsruhe, Germany) in Bragg–Brenton geometry with a Lynexe detector using Co-Kα radiation at 30 kV and 10 mA. The crystallization of the materials was also studied by laser Raman spectroscopy at an excitation wavelength of 517 nm recorded by means of a Jobin-Yvon T64000 Raman spectrometer equipped with an Olympus BX40 microscope. Transmission electron microscopy (TEM) was used to study the morphological properties of the materials. The TEM used is called an FEI Tecnai G2 Spirit electron microscope (FEICo., Hillsboro, OR, USA) at an accelerating voltage of 120 kV. The TEM is also coupled to an energy-dispersive X-ray spectrometer (EDS) which was used for elemental analysis. UV-vis diffuse reflectance spectroscopy (DRS) was used to study the optical properties. The measurements were done on a commercial Praying Mantis DRS Cary 500. The presence of NCNTs in the composites was also studied using thermogravimetric analysis (PerkinElmer Pyris). The samples were heated from ambient temperature to 900 °C at 10 °C min−1 in air. Photoluminescence spectroscopy studies were done on the same instrument as laser Raman spectroscopy measurements, at an excitation wavelength of 290 nm. Scanning electron microscopy (SEM) coupled to EDS analyses were carried out on a Zeiss Crossbeam 540 FEG. Photocurrent measurements were done on a potentiostat/galvanostat using a three-electrode system comprising of an Ag/AgCl reference electrode, a platinum wire counter electrode and a fluoride doped titanium glass working electrode in a 0.1 M K2SO4 (Merck) supporting electrolyte solution. The working electrode was prepared by mixing 10 parts polyvinylidene difluoride (Sigma-Aldrich) with 1 part TWZ721/10% NCNTs to form a paste which was then applied to the working electrode. The electrode was then allowed to dry in an oven for 5 h at 120 °C at which point a copper wire was attached to it using a silver paste. The electrode was kept at room temperature overnight to allow the paste to dry before it was used.Photocatalytic testing
The photoactivities of these materials were evaluated by the photodegradation of BPA. This was done as reported in our previous reports.16,19 The process is described in the ESI (S2†).Results and discussion
Characterization of pure metal oxides
The pure metal oxides, WO3, ZnO and TiO2-anatase were studied and confirmed by PXRD (Fig. S1†), TEM (Fig. S2a, S3a and S4a†), EDS (Fig. S2c, S3c and S4c†) and laser Raman spectroscopy. Here it was concluded that the resin gel technique yielded desirable and uncontaminated materials, although trace amounts of carbon attributed to the unburned soot were detected.Characterization of QMMOs
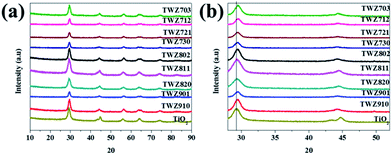 | ||
| Fig. 1 (a) PXRD patterns of TiO2 and various QMMOs and (b) inset showing the (101) and (004) reflections of TiO2 and various QMMOs. | ||
In addition to the variations in the 2θ position of the (101) reflection of QMMOs relative to that of TiO2, similar variations were also observed amongst the different QMMOs (Fig. 1 and Table 1). It was observed that the 2θ value of the (101) reflection of the QMMOs increased with an increasing percentage of dopants. The (101) reflections of QMMOs containing 90% Ti4+ appeared at 2θ values closer to that of TiO2 whereas those that contained 70% Ti4+ were observed at considerably higher 2θ values relative to that of TiO2.
| Sample | 2θ (004)/° | 2θ (101)/° | Particle size (nm) | a (pm) | c (pm) |
|---|---|---|---|---|---|
| TiO2 | 44.732 | 29.275 | 10.5 | 490.077 | 808.121 |
| TWZ910 | 44.416 | 29.338 | 11.7 | 485.644 | 815.854 |
| TWZ901 | 44.479 | 29.316 | 11.2 | 486.603 | 814.757 |
| TWZ820 | 44.469 | 29.465 | 12.3 | 483.547 | 812.555 |
| TWZ811 | 44.606 | 29.461 | 12.8 | 482.811 | 814.930 |
| TWZ802 | 44.484 | 29.405 | 12.6 | 484.694 | 813.663 |
| TWZ730 | 44.479 | 29.576 | 13.3 | 481.053 | 815.087 |
| TWZ721 | 44.479 | 29.546 | 13.4 | 480.983 | 815.070 |
| TWZ712 | 44.460 | 29.531 | 13.2 | 480.713 | 814.757 |
| TWZ703 | 44.461 | 29.528 | 13.2 | 479.955 | 814.757 |
Furthermore, it was observed that the (101) reflection of QMMOs containing more W6+ relative to Zn2+ appeared at higher 2θ values. This indicated that W6+ ions distorted the TiO2 lattice at a higher degree than Zn2+.
The degree of distortions that occurred on the crystal lattice of TiO2 as a result of incorporating W6+ and Zn2+ was estimated by means of calculating the lattice parameters. The lattice parameters were calculated by measuring accurately the 2θ positions of the (004) and (001) peaks. The a lattice parameter of the QMMOs are different from that of TiO2. The a lattice parameter of the QMMOs also varies amongst the different QMMOs. The QMMOs that contained 90% Ti4+ had lattice parameters that were closer to that of TiO2, followed by those that contained 80% Ti4+ and those that contained 70% Ti4+ differed the most to that of TiO2. Furthermore, the a lattice parameters of the QMMOs were observed to vary with varying amounts of W6+ and Zn2+ when comparing a series of QMMOs with the same Ti4+ concentration, e.g. the a lattice parameter of TWZ730 was lower than that of TWZ721 which was in turn lower than that of TWZ712 (Table 1).
The PXRD patterns of TiO2 and the various QMMOs were used to calculate their particle size. The Scherer's equation using the (101) reflection was used for this purpose where it was found that TiO2 nanoparticles are smaller than all the QMMOs particles. Additionally, the size of the QMMOs metal oxide particles increased with decreasing amount of Ti4+.
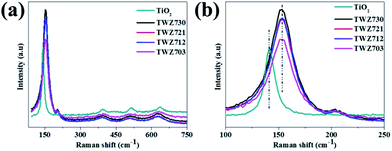
The laser Raman signatures of TiO2 and the QMMOs consisting of 70% Ti4+ were studied. It was observed that the laser Raman signatures of the QMMOs were similar to that of TiO2 (Fig. 2a). This was consistent with what was observed from PXRD measurements. Furthermore, closer investigations of the Eg peaks of the QMMOs and TiO2 showed that the Eg peaks of the QMMOs had shifted to shorter wavelengths relative to that of TiO2, a phenomenon that was observed in PXRD measurements, where the (101) PXRD reflections of the QMMOs were at higher 2θ values relative to that of TiO2. This also indicates that the incorporation of W6+ and Zn2+ ions into the lattice of TiO2 resulted in lattice distortions (Fig. 2b).
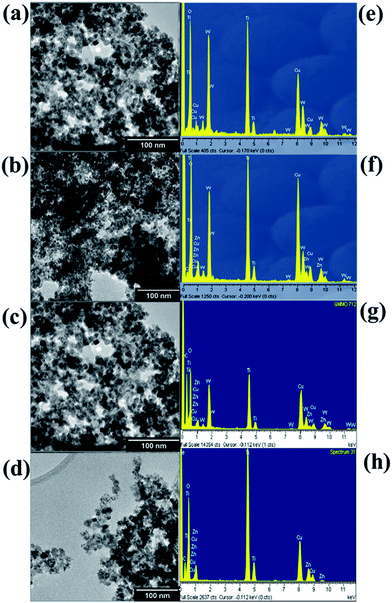 | ||
| Fig. 3 TEM images of (a) TWZ703, (b) TWZ712, (c) TWZ721 and (d) TWZ730. EDS spectrum of (e) TWZ703, (f) TWZ712, (g) TWZ721 and (h) TWZ730. | ||
On the other hand, the EDS spectra of the various QMMOs were found to differ amongst themselves (Fig. 3e and f) and were different from that of TiO2 (Fig. 4c). The EDS spectrum of TWZ730 consisted of elemental Ti, W, and O (Fig. 3e). The same case was observed with the other QMMOs; in the case of TWZ703 no peaks associated with W were present but those of Zn were observed. The other two QMMOs, TWZ712 and TWZ721 had similar EDS spectra showing the presence of elemental Ti, W, Zn, and O.
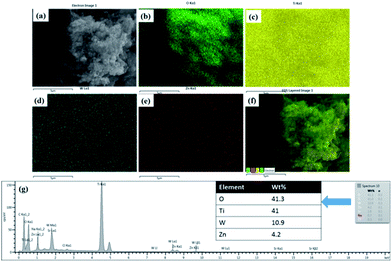 | ||
| Fig. 4 (a) SEM image of TWZ721, EDS elemental maps of (b) oxygen, (c) titanium, (d) tungsten, (e) zinc, (f) EDS layered image of Ti, Zn, O and W, and (g) EDS spectra of TWZ721. | ||
In order to further investigate the presence of tungsten and zinc atoms in the TiO2 crystals SEM and EDS mapping analyses were conducted on TWZ721 (Fig. 4). Here, it was observed that the various elements, Ti, W, Zn, and O were uniformly distributed throughout the sample, in all the crystals even though they differed in amount. This observation also proved that Zn and W ions were incorporated into the crystal lattice of TiO2. The elemental ratio of the 3 cations was calculated from the EDS spectrum of sample TWZ721 and was found to be T(73%)![[thin space (1/6-em)]](https://www.rsc.org/images/entities/char_2009.gif) :
:![[thin space (1/6-em)]](https://www.rsc.org/images/entities/char_2009.gif) W(19%)
W(19%)![[thin space (1/6-em)]](https://www.rsc.org/images/entities/char_2009.gif) :
:![[thin space (1/6-em)]](https://www.rsc.org/images/entities/char_2009.gif) Zn(8%). This was adjudged to be a fair approximation of the sample composition given the quantitative shortcomings of EDS.
Zn(8%). This was adjudged to be a fair approximation of the sample composition given the quantitative shortcomings of EDS.
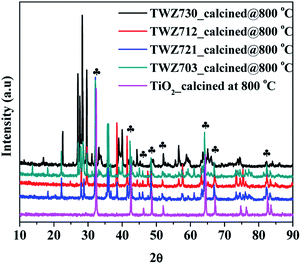
In order to investigate this hypothesis, PXRD analyses were performed on the QMMOs consisting of 70% TiO2 that were calcined at 800 °C to induce phase transformation of the TiO2-anatase phase to the rutile phase (Fig. 5). The PXRD patterns of the calcined QMMOs were different from those of the un-calcined materials. Furthermore, when compared to that of TiO2 calcined at 800 °C, their patterns consisted of matching rutile peaks but also consisting of several other peaks which were those of W, Zn oxides and probably other alloys, further demonstrating the QMMOs were formed and that the more thermodynamically stable rutile phase of TiO2 cannot accommodate high levels of W6+ and Zn2+ dopants.
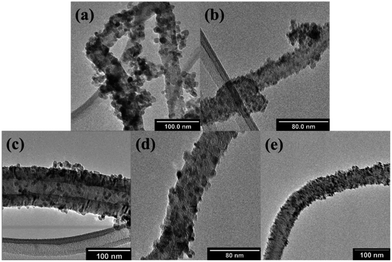 | ||
| Fig. 7 TEM images of (a) TiO2/10% NCNTs, (b) TWZ730/10% NCNTs, (c) TWZ721/10% NCNTs, (d) TWZ712/10% NCNTs and (e) TWZ703/10% NCNTs. | ||
PXRD analyses were performed on these composites to ensure that the process of compositing TiO2 and the various QMMOs with NCNTs did not change the crystallographic structure of the nanoparticles (Section S7, Fig. S9a and b†). Here, it was observed and confirmed that TiO2 and the QMMOs loaded onto had the crystal structure of TiO2-anatase.
The composites were studied by TGA in order to ascertain if indeed the composites consisted of both inorganic metal oxides and carbonaceous materials. Here, it was observed that ca. 10% of the various materials were combusted in air at temperatures below 700 °C. This showed that the materials contained approximately 10% NCNTs (Section S8 and Fig. S10†) and 90% metal oxide.
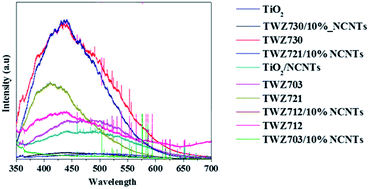
Having established that TiO2 and QMMOs were successfully loaded onto NCNTs, photoluminescence analyses were conducted in order to ascertain if they had any effect on the recombination of the photo-induced charge carriers. The photoluminescence emission peaks of TiO2, QMMOs, and composites were compared against each other (Fig. 8). The emission peaks were observed upon exciting the materials with radiation with a wavelength of 290 nm. The emission intensity of TiO2 was the highest observed indicating the lifetime of its electrons and holes was short. The intensities of the QMMOs were lower than that of TiO2 indicating that the incorporation of W6+ and Zn2+ decreased the recombination rate of the photoinduced charge carriers.
Furthermore, it was observed that the emission intensity of QMMOs decreased with the decreasing amount of W6+ (decreasing the amount of Zn2+) such that the emission intensity of the QMMO without W6+ TWZ703 was significantly lower than that of the QMMO with 30% W6+ TWZ730. This indicated that the incorporation of Zn2+ was more effective at reducing the charge carriers' recombination rate. The materials composited with 10% NCNTs had significantly lower than those of QMMOs and TiO2. This was attributed to the NCNTs which are able to quench photoinduced electrons thus reducing the possibility of these electron recombining with holes.15,48–50
Photocatalytic testing
Prior to all photodegradation experiments, two control experiments were conducted: (i) BPA (80 ppm, 50 ml) was stirred in the presence of the various photocatalysts in the dark for 6 h. Here, it was observed that the adsorption equilibrium of BPA onto the various photocatalysts was 2 h and very low amounts of BPA were adsorbed by the various photocatalysts (maximum 1.5%). (ii) The second control experiment was conducted in order to investigate the photolysis of BPA, i.e. the photodegradation of BPA in the absence of a catalyst. Here, BPA was irradiated with visible light from a solar simulator for 2 hours and it was found that there was essentially no reduction in BPA concentration (less than 0.5% reduction).In the case of photocatalytic degradation studies, adsorption equilibrium of the test sample (80 ppm, 50 ml BPA) onto the various materials was first established in 2 h (Table 2) before irradiating. The photocatalytic activity (after radiating) of neat TiO2 was found to be the lowest when compared to those of the QMMOs and the carbon-based composites (Table 2, Section S9 and Fig. S11†). The low photoactivity was attributed to the fact that unmodified TiO2 does not absorb visible light.
| Photocatalyst | % removal (2 h adsorption equilibrium) | % removal (after 60 min photocatalysis) |
|---|---|---|
| TiO2 | 0.9 | 26.51 |
| TWZ730 | 0.7 | 32.535 |
| TWZ721 | 0.8 | 37.535 |
| TWZ712 | 0.8 | 39.535 |
| TWZ703 | 0.9 | 42.535 |
| TiO2/10% NCNTs | 1.4 | 29.51 |
| TWZ730/10% NCNTs | 1.5 | 88.558 |
| TWZ721/10% NCNTs | 1.4 | 89.998 |
| TWZ712/10% NCNTs | 1.4 | 90.92 |
| TWZ703/10% NCNTs | 1.5 | 90.42 |
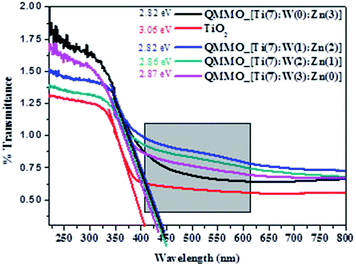
In the case of QMMOs, it was observed that their photocatalytic activities (ranged between 32 and 46%) were higher than that of TiO2. The increased photocatalytic activities were attributed to that the QMMOs absorbed visible light (Fig. 6) and they had somewhat lower photoluminescence emission peaks (Fig. 8). Furthermore, it was observed that the photocatalytic activities of the QMMOs increased with increasing amounts of Zn2+ incorporated (decreasing amount of W6+ incorporated).
Regarding the NCNTs-based composites, it was observed that supporting TiO2 onto NCNTs did not increase photocatalytic degradation in a significant way, only by 6% (X60 min = 30%). This is because loading TiO2 onto NCNTs did not affect the bandgap of TiO2 in any substantial way, as we had previously reported.19 Nevertheless, compositing TiO2 with NCNTs increased the lifetime of the few active charge carriers that were created, evidence being that the photoluminescence emission peak of TiO2/10% NCNTs was lower than that of TiO2 (Fig. 8). On the other hand, the QMMOs supported onto NCNTs had the highest photocatalytic activities ranging between 89–91%. This is as a result of the combined effect of that incorporating Zn2+ and W6+ introduced mid-band gap energies thus making it possible for the materials to absorb visible light and the increased lifetime of the active charge carriers (Fig. 6).
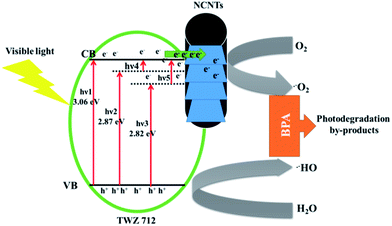
The reported method of synthesis has not been used to incorporate large amounts of dopants into TiO2-anatase and supporting the nanoparticles onto NCNTs. Nevertheless, there are several other reports that are beneficial for putting this current work into context, particularly for drawing up a mechanism. First, in the case of incorporating W6+ and Zn2+ into TiO2-anatase or similar work, García et al. reported the incorporation of up to 3% W6+ (and Mo6+) using the evaporation induced self assembly method.51 They showed by PXRD that the (101) TiO2-anatase had shifted and that the crystal lattice of TiO2-anatase had been distorted, proving the incorporation of these metal ions as it is shown in this work. Perhaps, more importantly, they reported that incorporating W6+ did not significantly narrow the absorption edge of TiO2-anatase. This is similar to what is observed in this work that the band gaps of QMMOs with higher amounts of W6+ were closer to that of pure TiO2-anatase (Fig. 6). They attributed this to that the 5d levels of tungsten ions were probably inside (or just below) the conduction band of Ti 3d conduction band.51,52 Nevertheless, there was an observable reduction in bandgap (TiO2 3.06 and TWZ 2.87 eV, Fig. 6) and this is attributable to new states created just below the conduction band of TiO2 (Fig. 9). This transition is labeled hν2 in Fig. 9.
In the case of doping Zn2+ into TiO2-anatase, Benjwal et al. used the sol–gel method to dope up to 2% Zn2+ into TiO2-anatase and proved it by XRD, XPS, and TEM.53 They observed that this exercise yielded materials with a bandgap narrower than that of pure TiO2 just as it was observed in this work (Fig. 6). In this case, also, the reduction in band gap was attributed to the creation of new states below the conduction band of TiO2 and probably slightly below the position of the 5d level of tungsten (labeled as hν3 on Fig. 9) as the bandgap was visibly narrower for QMMOs that contained more zinc than tungsten ions (Fig. 6).
In addition to the slight shifts in the bandgap of the QMMOs relative to pure TiO2, there are obvious broad peaks on between 400 and 600 nm on the spectra of the QMMOs that are not present on the TiO2 spectrum (Fig. 6). These were attributed to the possible transitions between the conduction band of TiO2 and the various states below it. The transitions are labeled as hν4 and hν5 on Fig. 9.
Nitrogen-doped carbon nanotubes play a well-documented role in the BPA degradation process. It serves as a sink for electron to aid the separation of charge carrier thus improving the photocatalytic efficiency (Fig. 9), of the material, one of many useful functions of nanocarbon materials.19,47,54,55 The evidence for this was observed from photoluminescence studies where it was observed that the electron/hole recombination rate was significantly shortened by compositing the QMMOs/TiO2 with NCNTs (Fig. 8).
Conclusion
W6+ and Zn2+ ions were successfully incorporated into the crystal lattice of TiO2 (anatase phase) using the resin gel technique to form QMMOs. This was confirmed using various characterization techniques, including PXRD, EDX, TEM, and laser Raman spectroscopy. The calcination of the QMMOs at 800 °C in air resulted in the material decomposing into tungsten trioxide, zinc oxide and the rutile phase of TiO2, further confirming that mixed metal oxides were formed. The incorporation of these metal ions into the lattice of TiO2 did not alter the band edge of TiO2 as was shown by UV-DRS but a wide absorption band was observed in the case of the QMMOs which wasn't there for TiO2. Composites consisting of QMMOs/TiO2 and NCNTs (10% loading) were successfully synthesized by modified resin gel synthesis. It was observed that the NCNTs were completely and homogeneously coated with QMMOs/TiO2 nanoparticles. The photoluminescence emission peaks of NCNTs containing NCNTs were lower than that of the QMMOs and TiO2, indicating retardation of the recombination of the electrons and holes. The photocatalytic efficiencies of the materials were tested by monitoring the efficiency at which they photodegraded BPA under visible-light irradiation (λ > 400 nm). The QMMOs had higher photocatalytic efficiency relative to that of TiO2. The photocatalytic efficiency of QMMOs increased with decreasing amounts of W6+ incorporated into TiO2. The photocatalytic efficiency of TiO2 was not improved by much when was loaded onto NCNTs (TiO2/10% NCNTs) but that of the QMMOs loaded on NCNTs was significantly increased. These remarks ratify that incorporation of W6+ and Zn2+ and compositing the materials with TiO2 resulted in unique materials with the potential of being viable photocatalysis.Conflicts of interest
There are no conflicts of interest to declare.Acknowledgements
This work is built on the research funded in part by the National Research Foundation (NRF) of South Africa (Grant number 88076), ESCOM's Tertiary Education Support Programme (TESP) and the DST-NRF Centre of Excellence in Strong Materials (CoE-SM) at the University of the Witwatersrand. The authors would also like to thank our colleagues who were somewhat involved in this work, including Mr Tiisetso Moimane, Miss Gugulethu Nkala and Miss Phuledi Mphago.References
- A. Fujishima and K. Honda, Nature, 1972, 238, 37–38 CrossRef CAS PubMed.
- Z. Huang, Q. Sun, K. Lv, Z. Zhang, M. Li and B. Li, Appl. Catal., B, 2015, 164, 420–427 CrossRef CAS.
- F. Dziike, P. J. Franklyn, S. H. Durbach, M. Maubane and L. Hlekelele, Mater. Res. Bull., 2018, 104, 220–226 CrossRef CAS.
- Z. Zheng, B. Huang, J. Lu, Z. Wang, X. Qin, X. Zhang, Y. Dai and M.-H. Whangbo, Chem. Commun., 2012, 48, 5733–5735 RSC.
- Z. Zheng, B. Huang, J. Lu, X. Qin, X. Zhang and Y. Dai, Chem.–Eur. J., 2011, 17, 15032–15038 CrossRef CAS PubMed.
- A. Naldoni, M. Allieta, S. Santangelo, M. Marelli, F. Fabbri, S. Cappelli, C. L. Bianchi, R. Psaro and V. Dal Santo, J. Am. Chem. Soc., 2012, 18, 7600–7603 CrossRef PubMed.
- M. K. Nowotny, L. R. Sheppard, T. Bak and J. Nowotny, J. Phys. Chem. C, 2008, 14, 5275–5300 CrossRef.
- T. D. Nguyen-Phan and E. W. Shin, J. Ind. Eng. Chem., 2011, 17, 397–400 CrossRef CAS.
- F. He, J. Li, T. Li and G. Li, Chem. Eng. J., 2014, 237, 312–321 CrossRef CAS.
- A. Fernández, G. Lassaletta, V. M. Jiménez, A. Justo, A. R. González-Elipe, J. M. Herrmann, H. Tahiri and Y. Ait-Ichou, Appl. Catal., B, 1995, 1–2, 49–63 CrossRef.
- P. Huo, Y. Yan, S. Li, H. Li and W. Huang, Desalination, 2010, 256, 196–200 CrossRef CAS.
- R. J. Tayade, R. G. Kulkarni and R. V. Jasra, Ind. Eng. Chem. Res., 2007, 46, 369–376 CrossRef CAS.
- D. Hazarika and N. Karak, Appl. Surf. Sci., 2016, 376, 276–285 CrossRef CAS.
- R. Leary and A. Westwood, Carbon, 2011, 49, 741–772 CrossRef CAS.
- B. Gao, G. Z. Chen and G. Li Puma, Appl. Catal., B, 2009, 89, 503–509 CrossRef CAS.
- L. Hlekelele, P. J. Franklyn, F. Dziike and S. H. Durbach, New J. Chem., 2018, 42, 1902–1912 RSC.
- V. Vaiano, O. Sacco, D. Sannino and P. Ciambelli, Appl. Catal., B, 2015, 170–171, 153–161 CrossRef CAS.
- C. Shen, K. Pang, L. Du and G. Luo, Particuology, 2017, 34, 103–109 CrossRef CAS.
- L. Hlekelele, P. J. Franklyn, F. Dziike and S. H. Durbach, New J. Chem., 2018, 42, 4531–4542 RSC.
- B. Wang, Q. Li, W. Wang, Y. Li and J. Zhai, Appl. Surf. Sci., 2011, 257, 3473–3479 CrossRef CAS.
- A. Di Paola, G. Marcì, L. Palmisano, M. Schiavello, K. Uosaki, S. Ikeda and B. Ohtani, J. Phys. Chem. B, 2002, 3, 637–645 CrossRef.
- M. A. Rauf, M. A. Meetani and S. Hisaindee, Desalination, 2011,(1–3), 13–27 CrossRef CAS.
- C. He, Y. Yu, X. Hu and A. Larbot, Appl. Surf. Sci., 2002,(1–4), 239–247 CrossRef CAS.
- X. Fu, J. Long, X. Wang, D. Leung, Z. Ding, L. Wu, Z. Zhang, Z. Li and X. Fu, Int. J. Hydrogen Energy, 2008, 33, 6484–6491 CrossRef CAS.
- V. Iliev, D. Tomova, S. Rakovsky, A. Eliyas and G. L. Puma, J. Mol. Catal. A: Chem., 2010, 327, 51–57 CrossRef CAS.
- M. Ni, M. K. H. Leung, D. Y. C. Leung and K. Sumathy, Renewable Sustainable Energy Rev., 2007, 11, 401–425 CrossRef CAS.
- H. Tada, T. Kiyonaga and S. I. Naya, Chem. Soc. Rev., 2009, 7, 1849–1858 RSC.
- Q. Zhang, W. Li, C. Moran, J. Zeng, J. Chen, L. P. Wen and Y. Xia, J. Am. Chem. Soc., 2010, 132, 11372–11378 CrossRef CAS PubMed.
- T. Hirakawa, J. Am. Chem. Soc., 2005, 127, 3928–3934 CrossRef CAS PubMed.
- F. Wu, X. Hu, J. Fan, E. Liu, T. Sun, L. Kang, W. Hou, C. Zhu and H. Liu, Plasmonics, 2013, 8, 501–508 CrossRef CAS.
- M. Dahl, Y. Liu and Y. Yin, Chem. Rev., 2014, 114, 9853–9889 CrossRef CAS PubMed.
- Z. Zhang, W. Wang, L. Wang and S. Sun, ACS Appl. Mater. Interfaces, 2012, 4, 593–597 CrossRef CAS.
- G. G. Ying, R. S. Kookana and P. Dillon, Water Res., 2003, 37, 3785–3791 CrossRef CAS PubMed.
- Y. R. Do, W. Lee, K. Dwight and A. Wold, J. Solid State Chem., 1994, 108, 198–201 CrossRef CAS.
- S. Y. Chai, Y. J. Kim and W. I. Lee, J. Electroceram., 2006, 2–4, 909–912 CrossRef.
- H. Fu, T. Xu, S. Zhu and Y. Zhu, Environ. Sci. Technol., 2008, 42, 8064–8069 CrossRef CAS PubMed.
- T. T. Vu, L. del Río, T. Valdés-Solís and G. Marbán, Appl. Catal., B, 2013, 140–141, 189–198 CrossRef CAS.
- F. X. Xiao, ACS Appl. Mater. Interfaces, 2012, 4, 7055–7063 CrossRef CAS PubMed.
- B. M. Rajbongshi, S. K. Samdarshi and B. Boro, J. Mater. Sci.: Mater. Electron., 2015, 26, 377–384 CrossRef CAS.
- P. Franklyn, Hydrothermal synthesis and characterisation of titania nanoparticles, University of the Witwatersrand, 2004 Search PubMed.
- R. Asahi, Y. Taga, W. Mannstadt and A. Freeman, Phys. Rev. B: Condens. Matter Mater. Phys., 2000, 61, 7459–7465 CrossRef CAS.
- D. O. Scanlon, C. W. Dunnill, J. Buckeridge, S. A. Shevlin, A. J. Logsdail, S. M. Woodley, C. R. A. Catlow, M. J. Powell, R. G. Palgrave, I. P. Parkin, G. W. Watson, T. W. Keal, P. Sherwood, A. Walsh and A. A. Sokol, Nat. Mater., 2013, 12, 798–801 CrossRef CAS PubMed.
- R. Sanjinés, H. Tang, H. Berger, F. Gozzo, G. Margaritondo and F. Lévy, J. Appl. Phys., 1994, 75, 2945 CrossRef.
- P. J. Franklyn and A. Narrandes, Proceedings of the International Conference Nanomaterials: Applications and Properties, 2012, 1, 1–17 Search PubMed.
- L. Hlekelele, P. Tripathi, P. J. Franklyn and S. H. Durbach, RSC Adv., 2016, 6, 76773–76779 RSC.
- P. J. Franklyn, Synthesis, characterisation and structural investigations of nanoparticulate forms of selected (W, Ti, Al, Ba) mixed metal oxides, Univ. Cambridge, 2011 Search PubMed.
- S. D. Perera, R. G. Mariano, K. Vu, N. Nour, O. Seitz, Y. Chabal and K. J. Balkus, ACS Catal., 2012, 2, 949–956 CrossRef CAS.
- L. Wang, L. Shen, Y. Li, L. Zhu, J. Shen and L. Wang, Int. J. Photoenergy, 2013, 2013, 1–7 Search PubMed.
- N. Hintsho, L. Petrik, A. Nechaev, S. Titinchi and P. Ndungu, Appl. Catal., B, 2014, 156–157, 273–283 CrossRef CAS.
- K. Woan, G. Pyrgiotakis and W. Sigmund, Adv. Mater., 2009, 21, 2233–2239 CrossRef CAS.
- O. Avilés-García, J. Espino-Valencia, R. Romero, J. L. Rico-Cerda, M. Arroyo-Albiter and R. Natividad, Fuel, 2017, 198, 31–41 CrossRef.
- A. Gutiérrez-Alejandre, J. Ramírez and G. Busca, Catal. Lett., 1998, 56, 29–33 CrossRef.
- P. Benjwal and K. K. Kar, RSC Adv., 2015, 5, 98166–98176 RSC.
- F. Dziike, P. J. Franklyn, L. Hlekelele and S. H. Durbach, Diamond Relat. Mater., 2019, 99, 107519 CrossRef CAS.
- A. Bianco Prevot, M. Vincenti, A. Bianciotto and E. Pramauro, Appl. Catal., B, 1999, 22, 149–158 CrossRef.
Footnote |
| † Electronic supplementary information (ESI) available. See DOI: 10.1039/c9ra07355h |
| This journal is © The Royal Society of Chemistry 2019 |

