 Open Access Article
Creative Commons Attribution 3.0 Unported Licence
The investigation of structural and vibrational properties and optical behavior of Ti-doped La0.67Ba0.25Ca0.08Mn(1−x)TixO3 (x = 0.00, 0.05 and 0.10) manganites
Marwa Bourguibaab,
Zeineb Raddaouic,
Moez Chafraa and
Jemai Dhahri *c
*c
aLaboratoire de Recherche en Mécanique Appliquée et Systèmes, Ecole Polytechnique de Tunisie, Université de Carthage, La Marsa, Tunisia
bFaculté des Sciences de Tunis, Université de Tunis El Manar, Tunis 2092, Tunisia
cLaboratoire de La Matière Condensée et des Nanosciences, Département de Physique, Faculté des Sciences de Monastir, Université de Monastir, 5019, Tunisia. E-mail: j.dhahri3000@gmail.com
First published on 19th December 2019
Abstract
The influence of Ti4+ ions incorporated into the B site on the structural, vibrational and optical properties of La0.67Ba0.25Ca0.08Mn(1−x)TixO3 (LBCM(1−x)Tx), a polycrystalline compound prepared by a molten salt method, was discussed. The X-ray diffraction (XRD) studies confirmed that at room temperature these compounds crystallize in the rhombohedral phases of R![[3 with combining macron]](https://www.rsc.org/images/entities/char_0033_0304.gif) c. Rietveld refinement indicated that the octahedron (Mn/Ti)O6 underwent a slight deformation and the θ(Mn/Ti)–O–(Mn/Ti) bond angles decreased with the increase in the Ti content. Furthermore, Raman spectra were recorded at room temperature for the LBCM(1−x)Tx ceramics to investigate the influence of incorporated Ti4+ ions in LBCM(1−x)Tx. Moreover, we controlled the frequency and damping of the optic modes based on Ti incorporation. The infrared (IR) absorption spectrum (FTIR) analysis in the span of 420–750 cm−1 supports the XRD results. The diffuse reflectance data at room temperature verified that both transition levels (5Eg → 5T5g) and (4A2g → 4T2g) correspond to the Mn3+ and Mn4+ ions. The optical band gap (Eg) values decreased from 2.90 eV to 2.70 eV with the increase in the Ti4+ content, implying that our samples could be good candidates for some applications in luminescent devices, such as ultrafast optoelectronic devices. Moreover, the photoluminescence spectra (PL) features at room temperature decreased for all samples. CIE were estimated for all the concentrations of Ti4+ ions. The results indicated that are a shifts in the CIE values of the compounds.
c. Rietveld refinement indicated that the octahedron (Mn/Ti)O6 underwent a slight deformation and the θ(Mn/Ti)–O–(Mn/Ti) bond angles decreased with the increase in the Ti content. Furthermore, Raman spectra were recorded at room temperature for the LBCM(1−x)Tx ceramics to investigate the influence of incorporated Ti4+ ions in LBCM(1−x)Tx. Moreover, we controlled the frequency and damping of the optic modes based on Ti incorporation. The infrared (IR) absorption spectrum (FTIR) analysis in the span of 420–750 cm−1 supports the XRD results. The diffuse reflectance data at room temperature verified that both transition levels (5Eg → 5T5g) and (4A2g → 4T2g) correspond to the Mn3+ and Mn4+ ions. The optical band gap (Eg) values decreased from 2.90 eV to 2.70 eV with the increase in the Ti4+ content, implying that our samples could be good candidates for some applications in luminescent devices, such as ultrafast optoelectronic devices. Moreover, the photoluminescence spectra (PL) features at room temperature decreased for all samples. CIE were estimated for all the concentrations of Ti4+ ions. The results indicated that are a shifts in the CIE values of the compounds.
1. Introduction
Perovskite manganese oxides of Ln1−xAxMnO3 (A = Ca, Sr, and Ba) have been an important topic in scientific studies and potential technological applications due to their interesting physical properties, resulting from the orbital degree of freedom, lattice charge and spin coupling.1,2 These properties can be manipulated due to the flexibility of the lattice deformation,3,4 the filling of the one-electron level, the internal strain and its width. In fact, manganites, owing to their physical and chemical properties, have attracted much interest because of their novel magnetic, electronic and optical properties. Colossal magneto-resistance (CMR) has recently been a source of great interest for these manganites for their potential applications in magnetic storage systems, magnetic field sensors and spintronics.5–10 Recently, the exceptional properties of barium-doped lanthanum manganites (La1−xBaxMnO3, LBM) have secured a prominent position in many industrial technologies, such as magnetic sensors.11–14 These manganites demonstrate a transition from metal behavior to insulator behavior, followed by a ferro–paramagnetic transition, i.e., the Curie temperature (TC), which is characterized by high magnetic entropy.15,16 The substitution of bivalent cations for the rare-earth cations in manganites leads to converting twice as many Mn3+ into Mn4+ ions to donate information to the double exchange interactions, which are the origin of the ferromagnetic behavior.17,18Moreover, the replacement of manganese by titanium ions has been the subject of diverse studies examining the magnetic, magneto-caloric and electrical behaviors of La0.7Sr0.25Na0.05Mn(1−x)TixO3,19 La0.85Ba0.15Mn(1−x)TixO3 (ref. 20) and La0.57Nd0.1Pb0.33Mn1−xTixO3.21 Kossi et al.22 investigated the impact of the incorporation of Ti4+ ions on the morphological and various electrical properties of a La0.7Sr0.25Na0.05Mn0.9Ti0.1O3 manganese perovskite. They confirmed that the lattice effects on the physical properties can be ignored since Mn4+ ions are replaced directly with Ti4+ ions. However, new insight into the physical properties with respect to the optical properties has not been established in manganites that either show insulator behavior (large band gap; typically, >4 eV) or metallic behavior (no band gap), which makes them less important for optical studies. Kumar et al.23 confirmed that the (La0.6Pr0.4)0.65Ca0.35MnO3 ceramic is a potential candidate for optical applications.
A detailed literature survey shows that not much work has been done on the vibrational and optical properties in the simultaneous substitution of Ba2+/Ca2+ ions and transition metal Ti4+ ions in manganese perovskites. For this reason, we report the effect of Ti4+ ions incorporated in the Mn sites on the structural, vibrational and optical properties of the polycrystalline LBCM(1−x)Tx. This polycrystalline material is synthesized by the molten salt method.
2. Experimental details
2.1. Synthesis of La0.67Ba0.25Ca0.08Mn(1−x)TixO3 ceramics
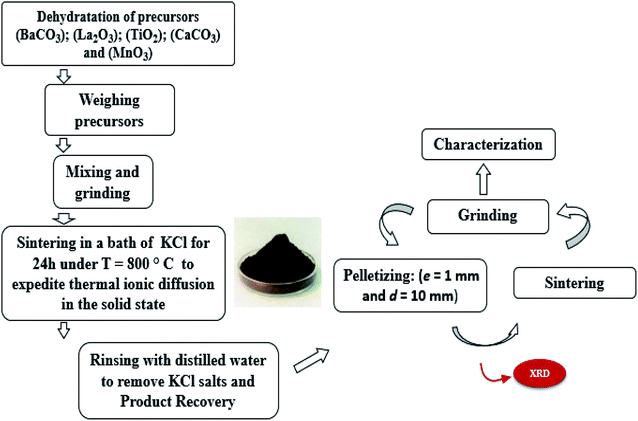
The LBCM(1−x)Tx compounds were synthesized via a flux method. The metal precursors with high purity were La2O3, BaCO3, CaCO3 MnO2 and TiO2. Then, these precursors were mixed well for 2 h in an agate mortar and 2 h in alcohol. The resultant blends were heated at 800 °C for 24 h in an alumina melting-pot, and then cooled at room temperature. After the completion of the reaction, the rest were crushed and washed repeatedly with distilled water to remove the salts. After slowly drying at 100 °C in air, it was pressed into pellets (e = 1 mm and d = 10 mm) and sintered at 1000 °C for 24 h. For clarity, Fig. 1 shows the steps of the synthesis process.2.2. Characterization
The crystalline phases of LBCM(1−x)Tx were checked by XRD using the “PANalytical X'Pert Pro” diffractometer (λCu-Kα = 1.5406 Å). The spectra were noted in the 2θ region of 10°–60° with a pitch of 0.02°. The structural analysis was carried out using the FullProf program.24,25The infrared spectra were measured by transmittance mode in the range 450 to 4000 cm−1 at room temperature on a PerkinElmer spectrum 100 spectrophotometer.
The Raman measurements were registered in the frequency region from 50 to 1000 cm−1 utilizing a LabRAM HR800. The compounds were excited using a 488 nm laser.
The UV-visible reflectance spectra were measured on a Shimadzu UV-3101PC spectrophotometer.
The photoluminescence (PL) spectra were collected at 300 K employing a iHR320 monochromator. The LBCM(1−x)Tx were excited using a 300 nm source.
3. Results and discussion
3.1. X-ray diffraction
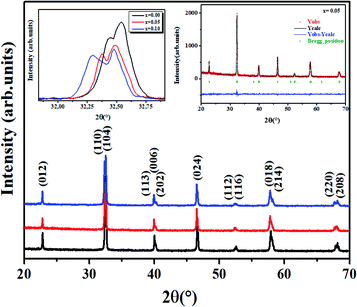
Fig. 2 shows the XRD data of all the LBCM(1−x)Tx samples at room temperature. These curves affirm the one phase nature of our compounds. A zoom-in of the most intense peak displays a shift to lower 2θ values (inset of Fig. 2), indicating that the unit cell volume rises with the increase in the Ti content. This increase affirmed the incorporation of Ti (rTi4+ = 0.605 Å) at the Mn site and the ratio can explain the anisotropic contractions.26,27The results of the structural refinement confirmed the rhombohedral phase R![[3 with combining macron]](https://www.rsc.org/images/entities/char_0033_0304.gif) c (no. 167), where (La/Ba/Ca) are at the 6a (0, 0, 1/4) position, (Mn/Ti) at 6b (0, 0, 0) and O at 18e (x, 0, 1/4).
c (no. 167), where (La/Ba/Ca) are at the 6a (0, 0, 1/4) position, (Mn/Ti) at 6b (0, 0, 0) and O at 18e (x, 0, 1/4).
The Rietveld refinement is depicted in the inset of Fig. 2 for x = 0.05 as an example. The performance of XRD data refinement is evaluated by the adjustment sign, such as the weighted pattern Rwp, pattern Rp, and the goodness of fit χ2. Good agreement was observed between the calculated and experimental XRD patterns. The results after fitting are illustrated in Table 1. In our case, it is worth remarking that the Ti4+ ionic radius (rTi4+ = 0.605 A) is larger than that of Mn4+ (rMn4+ = 0.53 A).
| La0.67Ba0.25Ca0.08Mn(1−x)TixO3 | x = 0.00 | x = 0.05 | x = 0.10 |
|---|---|---|---|
| Cell parameters | |||
| a (Å) | 5.530(7) | 5.523(1) | 5.515(2) |
| c (Å) | 13.453(8) | 13.550(3) | 13.557(1) |
| v (Å3) | 355.47(1) | 357.648(2) | 359.08(3) |
| c/a | 2.435(8) | 2.461(4) | 2.450(2) |
![[thin space (1/6-em)]](https://www.rsc.org/images/entities/char_2009.gif) |
|||
| Agreement factors | |||
| RP (%) | 9.54 | 10.7 | 6.56 |
| RWP (%) | 12.2 | 13.6 | 8.55 |
| χ2 | 2.22 | 2.84 | 1.33 |
![[thin space (1/6-em)]](https://www.rsc.org/images/entities/char_2009.gif) |
|||
| Bond lengths and bond angles | |||
| dMn–O–Mn (Å) | 1.957 | 1.970 | 1.970 |
| θMn−O (°) | 169.64 | 165.20 | 163.93 |
| W (u.a) × (10−2) | 9.49 | 9.24 | 9.21 |
Therefore, the incorporation of Ti4+ into the Mn4+ site induces a deformation of the hexagonal phase by an elongation along both the a and c axes and, consequently, an increase of the cell volume.
The increase of the cell parameters is caused by the increase of the Mn–O bond length (〈dMn/Ti–O–Mn〉).
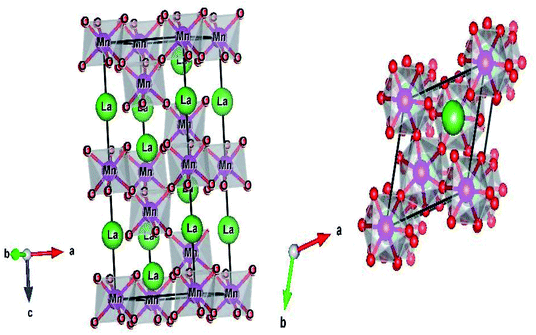
The structure and the (Mn/Ti)O6 octahedron for the LBCM0.95T0.05 sample (as an example) were plotted by the “Diamond” program, which, based on the refined atomic positions, is depicted graphically in Fig. 3. From this figure, the lattice deformation can be seen. Therefore, lattice effects may impact the vibrational properties and optical behaviors in these compounds.
To better understand the influence of cation incorporation, Raman and infrared spectroscopy are useful techniques for examining the structure and identifying the functional groups in these compounds.
3.2 Raman spectroscopy investigation
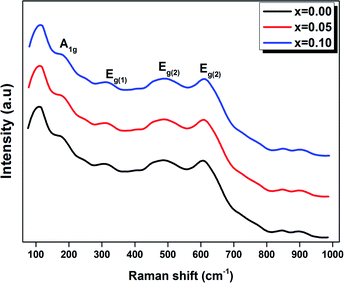
Raman spectroscopy was carried out for all the samples in order to better understand the modification changes in the structure. In addition, the observed Raman spectra allow us to study the influence of the deformation introduced by the incorporation of Ti4+ ions at the B site and correlate between the structural details.Fig. 4 shows the Raman spectra in the range of 80–1000 cm−1 for the LBCM(1−x)Tx (x = 0.00, 0.05 and 0.10) manganite at room temperature.
We notice that the LBCM(1−x)Tx ceramics Raman spectra are very similar in position and profile to the data of the pure LBCM ceramic, which is characterized by the rhombohedral phase (D3d). These results are similar to other literature reports.28–31
In addition, we noticed the peak positions are shifted to higher frequencies and the intensity increases as the rate of Ti increases in our compounds. This behavior may be due to disorder in our compounds, which is followed by the Ti4+ substitution at the B site for the LBCM(1−x)Tx ceramic. Meanwhile, an important modification of the local vibrational dynamics generated by the structural distortion and slight modification in the local symmetry of the LBCM manganite (for x = 0.00) can be observed.
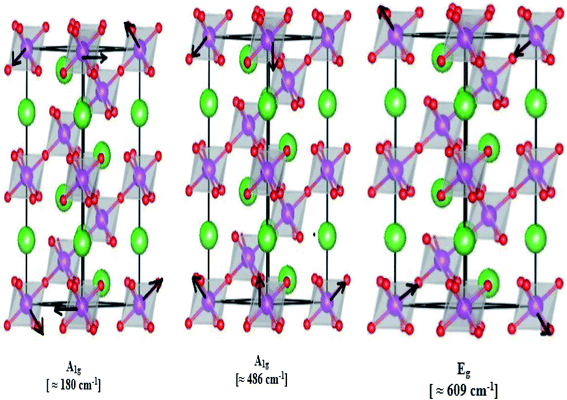
In our case, for the compound LBCM (x = 0.00), we observed five Raman modes at 110, 180, 309, 486 and 609 cm−1. This is in agreement with that reported for La0.65Eu0.05Sr0.3−xMnO3 by Bellouz et al.32 The band at low frequency occurring around 111 cm−1 is dominant since it corresponds to the distortions in the A-site cations (La/Ba/Ca). The peak at 180 cm−1 is assigned as A1g. The mode near 300–400 cm−1 corresponds to the Eg(1) mode, which are the bending, rotational and stretching vibrations of the MnO6 octahedra.33–35 We ascribe the Eg(2) mode (at 609 and 486 cm−1) to the Mn–O and O–Mn–O vibrations, respectively.
Fig. 5 illustrates the ionic pattern associated with the A and E vibration in a rhombohedral of LBCM0.95T0.05, as an example.
For LBCM(1−x)Tx (x = 0.05 and 0.10) compounds, they are similar to the compound where x = 0.00, i.e. there are no new peaks during incorporation. The Ti ions do not substitute exactly for Mn ions, and a displacement of the smaller Ti with respect to the Mn site is responsible for a modified local symmetry, which can result in the activation of phonons out of the Brillouin zone center.
In addition, the frequency and damping of the three modes 110, 490 and 605 cm−1 for the LBCM(1−x)Tx samples is listed in Table 2. We confirm that the band wavenumber shifts slightly to a higher value. This shift, due to the incorporation of partial Ti ions, leads to the deformation of the octahedral (MnO6) of our perovskite, and so allows for a modification in the Mn–O–Mn bond angle. These vibration modes in manganites arise from the Jahn–Teller (J–T) distortions. Furthermore, we underscore that the (Eg) mode (≈609 cm−1) originates from the symmetric stretching vibration of oxygen in MnO6 octahedra.
| Compounds | La0.76Ba0.25Ca0.08Mn(1−x)TixO3 | |||||
|---|---|---|---|---|---|---|
| 0.00 | 0.05 | 0.10 | ||||
| Phonon | Frequency (cm−1) | Damping (cm−1) | Frequency (cm−1) | Damping (cm−1) | Frequency (cm−1) | Damping (cm−1) |
| Vibration of A site | 110.8 | 5.19 | 115 | 4.815 | 115 | 5.528 |
| Eg(1) | 490 | 3.7 | 493 | 3.8 | 500 | 4.19 |
| Eg(2) | 605 | 8.9 | 606 | 9.02 | 607 | 9.05 |
So, the damping of the phonons is also much more important in the LBCM0.9T0.10 sample than in pure LBCM and the LBCM0.95T0.05 sample. The contrast is most obvious with the highest frequency mode Eg(2), whose damping and frequency are unaffected.
This can be related to the fact that as the (Ca, Ba) ion radius is notably smaller than that of the substituted La ion, it can participate easily in A-site and A1g motions. On the contrary, the Eg(2) mode is controlled by the introduction of Ti ions into the B site of LaMnO3 ceramics.
Fig. 6 shows the Raman response that has been rectified by the population factor n(ω) = (eℏω/kT − 1)−1. It allows us to eliminate supplementary bands as artifacts within the fitting process. We remark that the factor n(ω) + 1 is related to first-order Stokes scattering.
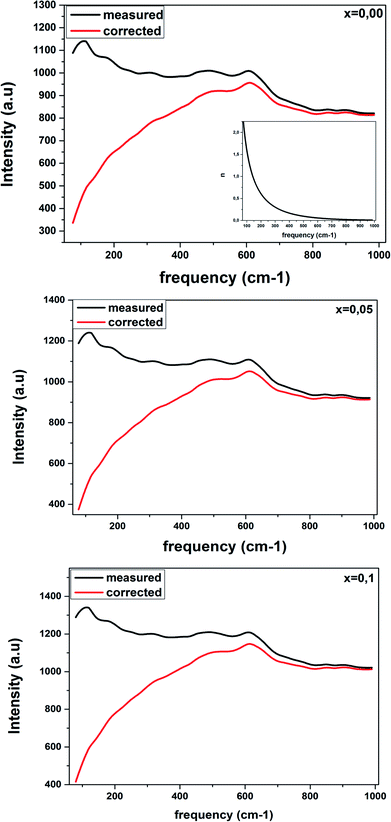 | ||
| Fig. 6 Corrected Raman spectra of LBCM(1−x)Tx ceramics are obtained after dividing the measured data by the Bose–Einstein population factor (reported in the inset). | ||
At low frequencies, we notice a disappearance in the modes when comparing between the original spectra and after dividing the Raman response by the factor n(ω) + 1. This results have influenced on the optical response at room temperature.
3.3. Fourier transform infrared spectroscopy
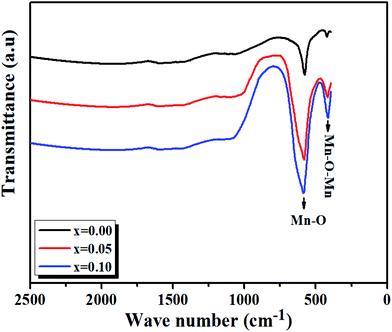
At room temperature, the Fourier transform infrared absorption spectra (FTIR) are illustrated in Fig. 7. We notice our samples exhibit mainly two transmission bands in the range of 420–750 cm−1. The first band is probably due to the folding mode, νb, at about 420 cm−1, which is susceptible to the bonding angle Mn/Ti–O–Mn/Ti (〈θMn/Ti–O–Mn/Ti〉).The second band is due to the stretching mode, νS, at about 600 cm−1, implying that the internal movement of the Mn4+ ion is opposed to the (Mn/Ti)O6 octahedron resulting from the Jahn–Teller (J–T) effect.30,31
The transmission wave number (ν) of the Mn/Ti–O bond vibration is given by Hooke's relation:
 | (1) |
 | (2) |
| MB = (1 − x)MMn + xMTi | (3) |
The force constant can be connected to the average Mn/Ti–O bond length (r) by the following expression:
 | (4) |
Based on eqn (1)–(4), the effective mass value, Mn/Ti–O bond lengths and the force constant for all compounds were determined from the FTIR spectra and are summarized in Table 3. We can remark that the calculated Mn/Ti–O bond lengths from the FTIR spectra are very close to the results obtained from the Rietveld refinement.36–38
| Compositions | Wavenumber (cm−1) | Effective mass (10−26 kg) | Force constant (N cm−1) | Bond length (B–O) (from FTIR) (Å) | Bond length (B–O) (from Rietveld) (Å) |
|---|---|---|---|---|---|
| x = 0.0 | 578.59 | 2.0576 | 2.4474 | 1.900 | 1.957 |
| x = 0.05 | 579 | 2.0546 | 2.44729 | 1.9080 | 1.970 |
| x = 0.10 | 582 | 2.0516 | 2.469 | 1.9094 | 1.9703 |
From Fig. 7, it is observed that a remarkable change in the FTIR occurs, in which the transmission bands associated with the Mn/Ti–O stretching vibration shift from 577.57 cm−1 to 585.49 cm−1 with the increasing value of x and increase in Mn/Ti–O bond lengths (i.e., decrease in force constant (k)).
So, the results establish by FTIR, whither the frequency shift is expected by the deformation structure (see Fig. 4), a more disordered structure will created by a shift of the Eg mode in Raman spectra too.
3.4 Optical properties
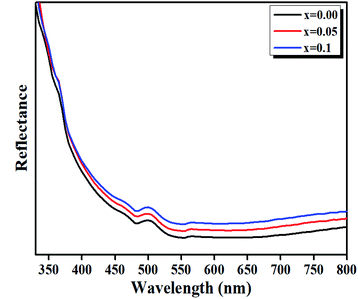 | ||
| Fig. 8 Diffuse reflectance spectra of LBCM(1−x)Tx (x = 0.00, x = 0.05 and x = 0.10) ceramics in the IR-vis region at room temperature. | ||
The bands at 500 nm for these compounds are ascribed to d–d transitions of (5Eg → 5T5g) and (4A2g → 4T2g) for the Mn3+ and Mn4+ ions, respectively.39
From the UV-visible reflectance data, the optical band gap energy (Eg) was determined by the Kubelka and Munk method.40 This method is usually employed to study the diffuse reflectance measurement acquired from faintly absorbing compounds. In our case, the Kubelka–Munk equation for any wavelength is described by:
 | (5) |
The absorption coefficient (α) can be given by the values of F(R):41,42
 | (6) |
The optical band gap (Eg) values of our ceramics were then calculated by the following equation:43
| αhν = A(hν − Eg)n | (7) |
| F(R)hν = A(hν − Eg)n | (8) |
However, it is likely that only direct transitions will occur in the perovskite.
Consequently, eqn (8) becomes:
| [F(R)hν]1/2 = A(hν − Eg) | (9) |
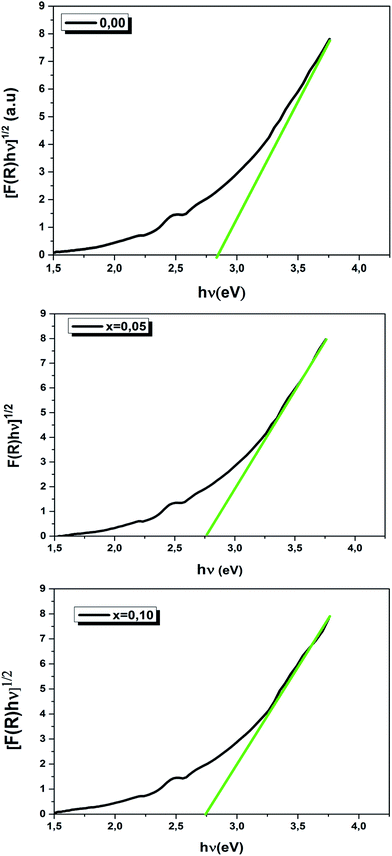
We have plotted the variation of [F(R)hν]1/2 versus (hν) for our compounds. The values of the indirect optical band gap (Eg) for the LBCM(1−x)Tx (x = 0.00, 0.05 and 0.10) were obtained, as represented in Fig. 8, by adjustment of the linear part of these plots at [F(R)hν]1/2 = 0. The Eg values are presented in Table 4.
| La0.76Ba0.25Ca0.08 Mn(1−x)TixO3 | Eg (eV) | Eu (eV) |
|---|---|---|
| x = 0.00 | 2.90 | 1.25 |
| x = 0.05 | 2.80 | 1.3 |
| x = 0.10 | 2.70 | 1.35 |
The values of the optical band gap are 2.90, 2.80 and 2.70 eV for x = 0.00, 0.05 and 0.10 respectively.
We notice that the Eg values decreased with the increase of Ti4+ rate in the LBCM(1−x)TxO3 ceramic. This shift of the Eg in the samples may be attributed to the modification in the Mn/Ti–O bond length and Mn/Ti–O–Mn/Ti bond angle, since cation incorporation plays a critical role in changing the one-electron bandwidth (W) and the optical band gap of the LBCM(1−x)TxO3 manganite ceramic, which is consistent with our XRD results.
The one electron bandwidth (W) relies on both the bond angle and bond length, as shown in this formula, W∞cos![[thin space (1/6-em)]](https://www.rsc.org/images/entities/char_2009.gif) ω/dMn/Ti–O3.5, where ω is 1/2[π − (Mn/Ti–O–Mn/Ti)] and d(Mn/Ti–O) is the Mn/Ti–O bond length44 (see in Table 1).
ω/dMn/Ti–O3.5, where ω is 1/2[π − (Mn/Ti–O–Mn/Ti)] and d(Mn/Ti–O) is the Mn/Ti–O bond length44 (see in Table 1).
Further, Eg is connected with W as follows: Eg = Δ − W, where Δ is the charge-transfer energy.45
In our case, all these structural changes are explained in a clean decrease of the one electron bandwidth (W). So, the substitution of Ti into Mn in the A site results in a decrease in the optical band gap.
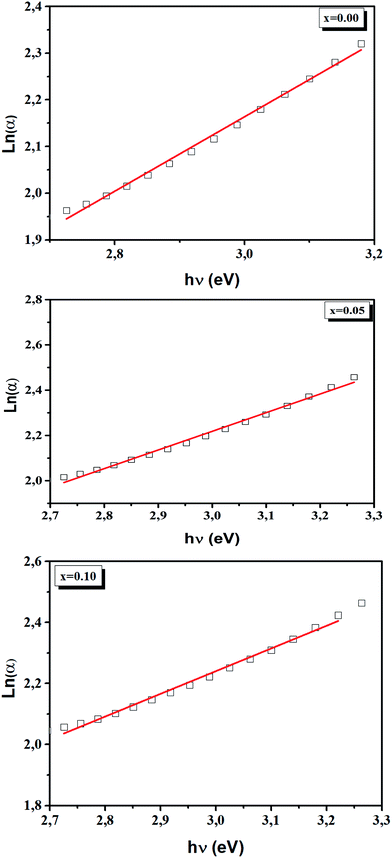
In addition, the width of the defect bands existing in the optical band gap correspond to the Urbach energy, Eu.46 It can be described by the equation:
 | (10) |
The Urbach energy, Eu, was determined by plotting ln![[thin space (1/6-em)]](https://www.rsc.org/images/entities/char_2009.gif) (α) vs. hv (Fig. 9).
(α) vs. hv (Fig. 9).
The Eu values are also regrouped in Table 4. A slight increase in the Urbach energy values is observed with the addition of Ti4+ ions.
For our sample, the LBCM(1−x)Tx ceramics, the optical band gaps span over 2.72–2.89 eV in the UV range, allowing for carrier excitation with femtosecond laser pulses, which makes these ceramics viable for applications in ultrafast optoelectronic devices (Fig. 10).47
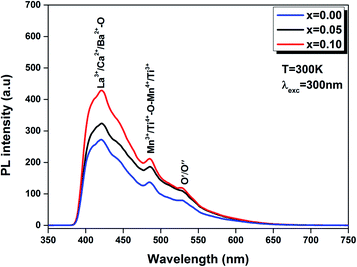 | ||
| Fig. 11 PL spectra of the LBCM(1−x)Tx (x = 0.00, x = 0.05 and x = 0.10) ceramics excited at 300 nm at room temperature. | ||
Furthermore, we note that when titanium is introduced in the LBCM(1−x)Tx ceramic, the PL response intensity increases. This is demonstrated by the increase of defects in our compound.
The existence of (Ca2+, Ba2+) for La3+ in the A site and Ti4+ for Mn3+ in the B site of the LaMnO3 lattice results in a distortion of the lattice. In our case, the Ti4+ ions approach each other, which reinforces their interactions and results in quenched emission by non-radiative pathways (i.e. lattice vibrations). The experimental results show that photoluminescence is connected to the structural disorder and deformation.
The same result was reported by Zhu et al.48 for La0.67Ca0.33MnO3 compounds and Chen et al.49 for La0.825Sr0.175MnO3 compounds.
In addition, this comportment can be produced by oxygen vacancies for random common “perovskites” and/or disorder coupled to the “tilt” of a [Mn/TiO6]–[Mn/TiO6] complex cluster.
The CIE chromaticity of LBCM(1−x)Tx (x = 0.00, 0.05 and 0.10) is illustrated in Fig. 12. The CIE diagram shows that the estimated coordinates are associated in the blue region and tuned towards the pure blue region. The calculated values of the CIE coordinates of the LBCM(1−x)Tx ceramic are tabulated in Table 5. The CIE coordinates vary from (0.1752, 0.1626) to (0.1773, 0.1688) upon the incorporation of Ti ions in the LBCM(1−x)Tx ceramic.
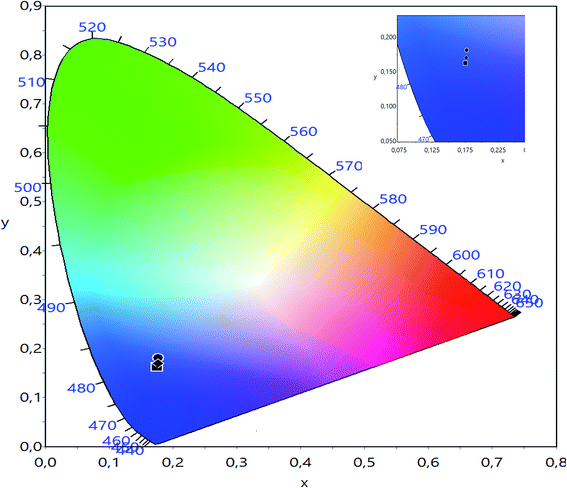 | ||
| Fig. 12 CIE chromatic diagram showing the influence of thermal treatment on the chromatic coordinates of LBCM(1−x)Tx (x = 0.00, x = 0.05 and x = 0.10). | ||
| Composition | CIE | |
|---|---|---|
| x | y | |
| x = 0.00 | 0.1752 | 0.1626 |
| x = 0.05 | 0.1772 | 0.1812 |
| x = 0.10 | 0.1773 | 0.1688 |
Increasing the Ti4+ ion rate in the host lattice led to significant modifications of the optical behavior, which can be attributed to the structural deformation. However, our investigation of the structural, vibrational and optical properties of the polycrystalline LBCM(1−x)Tx demonstrate that their optical sensitivity places them as good candidates for many practical applications in luminescent devices.
4. Conclusion
Polycrystalline LBCM(1−x)Tx (x = 0.00, 0.05 and 0.10) ceramics were synthesized by the molten salt process. The XRD analysis indicated that the ceramic possesses a rhombohedral phase structure R![[3 with combining macron]](https://www.rsc.org/images/entities/char_0033_0304.gif) c. The XRD analysis, along with the Raman and FTIR measurements, verify the incorporation of Ti into the Mn-site and the ensuing chemical disorder in these compounds. The optical band gap (Eg) of our samples, as measured by UV-visible reflectance, decreases from 2.90 eV to 2.70 eV with the increase in the Ti content. The photoluminescence spectra (PL) features at room temperature are smaller for all samples. This behavior is explained by oxygen vacancies. The CIE coordinate varies from (0.1752, 0.1626) to (0.1773, 0.1688) upon the incorporation of Ti ions at Mn ion sites in the LBCM(1−x)Tx ceramic.
c. The XRD analysis, along with the Raman and FTIR measurements, verify the incorporation of Ti into the Mn-site and the ensuing chemical disorder in these compounds. The optical band gap (Eg) of our samples, as measured by UV-visible reflectance, decreases from 2.90 eV to 2.70 eV with the increase in the Ti content. The photoluminescence spectra (PL) features at room temperature are smaller for all samples. This behavior is explained by oxygen vacancies. The CIE coordinate varies from (0.1752, 0.1626) to (0.1773, 0.1688) upon the incorporation of Ti ions at Mn ion sites in the LBCM(1−x)Tx ceramic.
The investigation of the structural, vibrational and optical properties for the LBCM(1−x)Tx manganites shows that our compounds can be a good candidate for applications in luminescent devices, such as ultrafast optoelectronics.
Conflicts of interest
There are no conflicts to declare.References
- E. Dagotto, T. Hotta and A. Moreo, Phys. Rep., 2001, 344, 1–153 CrossRef CAS.
- L. P. Gorkov and V. Z. Kresin, Phys. Rep., 2004, 400, 149–208 CrossRef CAS.
- A. J. Millis, P. B. Littlewood and B. I. Shraiman, Phys. Rev., 1995, 74, 5144 CAS.
- A. J. Millis, B. I. Shraiman and R. Mueller, Phys. Rev. Lett., 1996, 77, 175 CrossRef CAS.
- F. Bridges, C. H. Booth, G. H. Kwei, J. J. Neumeir and G. A. Swatzky, Phys. Rev. B, 2000, 61, 9237–9240 CrossRef.
- V. P. S. Awana, R. Tripathi, N. Kumar, H. Kishan, G. L. Bhalla, R. Zeng, L. S. S. Chandra, V. Ganesan and H. U. Habermeier, J. Appl. Phys., 2010, 107, 09D723 CrossRef.
- A. M. Haghiri-Gosnet and J. P. Renard, J. Phys. D: Appl. Phys., 2003, 36, R127–R150 CrossRef CAS.
- T. Samanta, I. Das and S. Banerjee, Appl. Phys. Lett., 2007, 91, 082511 CrossRef.
- A. Moreo, S. Yunoki and E. Dagotto, Science, 1999, 283, 2034–2040 CrossRef CAS PubMed.
- R. N. Mahato, K. Sethupathi and V. Sankaranarayanan, J. Appl. Phys., 2010, 107, 09D714 CrossRef.
- I. Zeydi, A. Zaidi, J. Dhahri and E. K. Hlil, J. Magn. Magn. Mater., 2018, 471, 529 CrossRef.
- M. Kar and S. Ravi, Pramana, 2002, 58, 1009–1012 CrossRef CAS.
- S. K. Srivastava, M. Kar and S. Ravi, Mater. Sci. Eng., B, 2008, 147, 84–89 CrossRef CAS.
- S. K. Srivastava and S. Ravi, J. Magn. Magn. Mater., 2009, 321, 4072–4080 CrossRef CAS.
- Ah. Dhahri, E. Dhahri and E. K. Hlil, RSC Adv., 2019, 9, 5530–5539 RSC.
- M. R. Laouyenne, M. Baazaoui, Kh. Farah, E. K. Hlil and M. Oumezzine, J. Magn. Magn. Mater., 2018, 474, 393–399 CrossRef.
- C. Zner, Phys. Rev., 1951, 82, 403 CrossRef.
- M. Kar and S. Ravi, Mater. Sci. Eng., B, 2004, 107, 332–336 CrossRef.
- S. E. L. Kossi, S. Ghodhbane, S. Mnefgui, J. Dhahri and E. K. Hlil, J. Magn. Magn. Mater., 2015, 395, 134–142 CrossRef CAS.
- H. Nadhira, B. Kurniawan, H. Arifni and S. Ahmiatri, Conference Proceedings, 2013, 1554, 62 CAS.
- A. Dhahri, J. Dhahri, E. K. Hlil and E. Dhahri, J. Supercond. Novel Magn., 2012, 25, 1475–1484 CrossRef CAS.
- S. E. L. Kossi, F. I. H. Rhouma, J. Dhahri and K. Khirouni, Phys. B, 2014, 440, 118–123 CrossRef.
- S. Kumar, G. D. Dwivedi, S. Kumar, R. B. Mathur, U. Saxena, A. K. Ghosh, A. G. Joshi, H. D. Yang and S. Chatterjee, Dalton Trans., 2015, 44, 3109–3117 RSC.
- H. M. Rietveld, J. Appl. Crystallogr., 1969, 2, 65–71 CrossRef CAS.
- T. Roisnel and J. Rodriguez-Carvajal, Computer Program FULLPROF, LLB-LCSIM, May, 2003 Search PubMed.
- S.-y. Zhang, P. Zhao, Z.-h. Cheng, R.-w. Li, J.-r. Sun, H.-w. Zhang and B.-g. Shen, Phys. Rev. B, 2001, 64, 212404 CrossRef.
- B. Vertruyen, S. Hébert, A. Maignan, C. Martin, M. Hervieu and B. Raveau, J. Magn. Magn. Mater., 2004, 280, 75–83 CrossRef CAS.
- I. Fedorov, J. Lorenzana, P. Dore, G. De Marzi, P. Maselli and P. Calvani, Phys. Rev. B, 1999, 60, 11875 CrossRef CAS.
- M. Yahia and H. Batis, J. Inorg. Chem., 2003, 13, 2486–2494 Search PubMed.
- S. Keshri (Shaw, L. Joshi and S. K. Rout, J. Alloys Compd., 2009, 485, 501–506 CrossRef.
- V. S. Kolat, H. Gencer, M. Gunes and S. Atalay, Mat. science. engineering, B, 2007, 140, 212–217 CrossRef CAS.
- R. Bellouz, M. Oumezzine, A. Dinia, G. Schmerber, El-K. Hlil and M. Oumezzine, RSC Adv., 2015, 5, 64557–64565 RSC.
- L. Martín-Carrón, A. de Andrés, M. J. Martínez-Lope, M. T. Casais and J. A. Alonso, Phys. Rev. B, 2002, 66, 174303 CrossRef.
- V. B. Podobedov, D. B. Romero, A. Weber, J. P. Rice, R. Schreekala, M. Rajeswari, R. Ramesh, T. Venkatesan and H. D. Drew, Appl. Phys. Lett., 1998, 73, 3217 CrossRef CAS.
- M. Oumezzine, O. Hassayoun, R. Bellouz, H. Bezerra Sales and E. K. Hlil, J. Alloys Compd., 2017, 729, 156–161 CrossRef CAS.
- R. Bellouz, Ma. Oumezzine, E. Hlil and M. Oumezzine, Mater. Res. Bull., 2016, 74, 452–458 CrossRef CAS.
- D. Varshney and M. W. Shaikh, J. Alloys Compd., 2014, 589, 558–567 CrossRef CAS.
- N. Dodiya and D. Varshney, J. Mol. Struct., 2013, 103, 104–109 CrossRef.
- Y. Jin, Y. Hu, H. Wu, H. Duan, L. Chen, Y. Fu, G. Ju, Z. Mu and M. He, Chem. Eng. J., 2016, 288, 596–607 CrossRef CAS.
- P. Kubelka and F. Z. Munk, Tech. Phys., 1931, 12, 593–601 Search PubMed.
- F. Yakuphanoglu, R. Mehrotra, A. Gupta and M. Muñoz, J. Appl. Polym. Sci., 2009, 114, 794–799 CrossRef CAS.
- E. Yassitepe, Z. Khalifa, G. H. Jaffari, C.-S. Chou, S. Zulfiqar and M. I. Sarwar, et al., Powder Technol., 2010, 201, 27–31 CrossRef CAS.
- T. L. Le, S. Guillemet-Fritsch, P. Dufour and C. Tenailleau, Thin Solid Films, 2016, 612, 14–21 CrossRef CAS.
- P. G. Radaelli, G. Iannone, M. Marezio, H. Y. Hwang, S. W. Cheong, J. D. Jorgensen and D. N. Argyriou, Phys. Rev. B, 1997, 56, 8265 CrossRef CAS.
- M. Medarde, J. Mesot, P. Lacorre, S. Rosenkranz, P. Fischer and K. Gobrecht, Phys. Rev. B, 1995, 52, 9248 CrossRef CAS PubMed.
- F. Urbach, Phys. Rev., 1953, 92, 1324 CrossRef CAS.
- P. Kumar and M. Kar, J. Alloys Compd., 2014, 584, 566–572 CrossRef CAS.
- W. L. Zhu, Y. Q. Ma, M. Z. Wu, H. Li, S. Cao, W. J. Yin, K. Yang, G. H. Zheng and Z. Q. Sun, Mater. Res. Bull., 2009, 44, 1867–1870 CrossRef CAS.
- F. Chen, H. W. Liu, K. F. Wang, H. Yu, S. Dong, X. Y. Chen, X. P. Jiang, Z. F. Ren and J.-M. Liu, J. Phys.: Condens. Matter, 2005, 17, 467–475 CrossRef.
| This journal is © The Royal Society of Chemistry 2019 |

