 Open Access Article
Sophorolipid exhibits antifungal activity by ROS mediated endoplasmic reticulum stress and mitochondrial dysfunction pathways in Candida albicans†
Farazul Haque‡§
a,
Nitish Kumar Verma‡a,
Mohammad Alfatah¶
b,
Swati Bijlani||
b and
Mani Shankar Bhattacharyya‡ *a
*a
aBiochemical Engineering Research & Process Development Centre (BERPDC), CSIR-Institute of Microbial Technology (IMTECH), Sector-39A, Chandigarh 160036, India. E-mail: manisb@imtech.res.in; Fax: +91-172-2695215; Tel: +91-172-6665313
bYeast Molecular Biology Laboratory, CSIR-Institute of Microbial Technology (IMTECH), Sector-39A, Chandigarh 160036, India
First published on 16th December 2019
Abstract
In the present study, we investigated the mechanism of cell death in C. albicans due to treatment with sophorolipid (SL). SL is an extracellular glycolipid biosurfactant produced by various species of non-pathogenic yeasts and is known to inhibit the growth and biofilm formation of C. albicans. This study revealed that treatment of C. albicans cells with SL increases the ROS production and expression of oxidative stress-related genes significantly (SOD1, CAT1). Increased ROS level within the cells causes ER stress and release of Ca2+ in the cytoplasm and alteration of the mitochondrial membrane potential (MMP). Quantitative real time-polymerase chain reaction (qRT-PCR) data showed that SL also upregulates the Endoplasmic Reticulum (ER) stress marker HAC1. Flow cytometric analysis (AnnexinV/PI) indicated that the cell death may have occurred due to necrosis which was further confirmed by LDH release assay and transmission electron microscopy (TEM). Further experiments with the null mutant Δ hog1 strain of C. albicans SC5314 indicated the activation of the osmotic stress response pathway (HOG-MAPK) and SAP9. This study gave an insight into the mechanism of cell death initiation by glycolipids and indicated that further modification of these molecules can lead to the development of new therapeutic agent against C. albicans.
Introduction
Members of the genus Candida are known to be some of the most common opportunistic human pathogens which cause infection to the superficial mucosa and are major causative agents for life threatening systemic and blood level infections.1,2 Candida albicans (C. albicans) is the fourth most common causative agent of candidiasis and is associated with very high mortality rates (about 50%).3,4 Depending on the environmental conditions C. albicans can grow either as unicellular budding yeast or in the form of filamentous pseudohypha and hypha.5,6 Both yeast and hyphal forms of pathogen invade the bloodstream and cause invasive candidiasis.7 Currently, three classes of antifungal drugs (azoles, echinocandins, and polyenes) are being used for the treatment of candidiasis.3 However, severe toxicity, adverse side effects, high cost and development of drug resistance have emerged to be the pitfalls of these therapies.3 Thus, there is an urgent need to develop new antifungal agents for effective therapy of candidiasis. Research is in progress to synthesize effective antifungal agents by derivatizing and improving the properties of existing antifungal drugs, by screening of novel compounds or by developing new chemical entities against potential fungal targets.8–10 Presently, several new molecules are in the various stages of their development as potential antifungal drug candidate.11Sophorolipid (SL), a glycolipid biosurfactant (Bs) is produced extracellularly by several non-pathogenic yeasts.12,13 It is one of the most promising and attractive Bs found in nature and has been reported to have antimicrobial,14 antiviral, anti-spermicidal,15 anticancer16,17 and immunomodulatory activities.18 In a previous study, we have demonstrated the inhibitory effect of SL against biofilm formation of C. albicans by downregulating the hyphae associated genes.19 SL interacts synergistically with antifungal drugs (amphotericin B and fluconazole) to kills planktonic cells, inhibit biofilm formation and eradicate already formed biofilm.19 However, the mechanism of cell death remained unexplored. Existing literature reports suggest that SL mediates bacterial cell death by damaging/impairing the plasma membrane leading to pore formation and causing cell lysis.20,21 SL also induces apoptosis in H7402 human liver cancer cells by blocking the cell cycle at G1 phase, activating caspase-3, and increasing Ca2+ level in the cytoplasm.22 Since SL induces different cascades of cellular activities leading to cell death, here; we have investigated the mechanism of action of the molecule causing cell death in C. albicans. Our investigations suggest that treatment of C. albicans with SL enhances ROS production, upregulates ROS specific gens (CAT1, SOD1) and activates pathways leading to oxidative stress. Moreover, as evidenced by the higher transcript level of HAC1 (a marker of ER stress) SL causes ER stress triggering efflux of Ca2+ from ER into cytoplasm and the activation of high osmolarity glycerol (HOG) mitogen-activated protein kinase (MAPK) pathway which is known to be involved in the cell's responses to oxidative23 and osmotic stresses.24 All these stress conditions finally lead to necrosis and cell death.
Material and methods
Strain, media and growth condition
The wild type strain of C. albicans SC5314![[thin space (1/6-em)]](https://www.rsc.org/images/entities/char_2009.gif) 25 and null Δ hog1 mutant was used in this study. Strains were preserved in glycerol (as frozen stocks) at −80 °C and revived on YPD agar medium (1% Bacto yeast extract, 2% Bacto peptone, 2% glucose and 2% Bacto agar). Culture was grown in YPD broth at 30 °C with shaking (200 rpm). Production and extraction of SL were carried out as reported earlier (production, isolation, purification and characterization has been briefly described in ESI).†19,26 The stock solution of SL was prepared in dimethyl sulfoxide (DMSO, Sigma), and stored at −20 °C until use. In each assay, SL was dissolved in DMSO in such that the concentration of DMSO does not exceed to 5%.
25 and null Δ hog1 mutant was used in this study. Strains were preserved in glycerol (as frozen stocks) at −80 °C and revived on YPD agar medium (1% Bacto yeast extract, 2% Bacto peptone, 2% glucose and 2% Bacto agar). Culture was grown in YPD broth at 30 °C with shaking (200 rpm). Production and extraction of SL were carried out as reported earlier (production, isolation, purification and characterization has been briefly described in ESI).†19,26 The stock solution of SL was prepared in dimethyl sulfoxide (DMSO, Sigma), and stored at −20 °C until use. In each assay, SL was dissolved in DMSO in such that the concentration of DMSO does not exceed to 5%.
Quantification of reactive oxygen species (ROS), mitochondrial membrane potential (MMP) and intracellular calcium ion (Ca2+) level
Cells from primary overnight culture were harvested, washed and inoculated in 2 mL fresh YPD medium with an OD600 of 0.5. Different concentrations of SL (100 and 200 μg mL−1) along with control that contains carrier (DMSO) were added to the cells and incubated for 5 h at 30 °C with shaking condition (200 rpm). After incubation, cells were centrifuged and pellet was washed twice with 1× phosphate buffer saline (PBS, pH 7.4) and resuspended in 1× PBS, pH 7.4. ROS-specific dye H2-DCFDA (Molecular probe) was added to the cells at a final concentration of 2 μM and further incubated for 30 min at 30 °C. Cells were then washed twice with PBS and analysed by BD Accuri™ C6 flow cytometer. MMP was determined using mitochondria-specific voltage-dependent dye (DiOC6) (Molecular probe). Cells were stained with 5 mM DiOC6 for 30 min at 30 °C, washed twice with PBS and analysed by flow cytometer. The Ca2+ level was determined using Fluo-3-acetoxymethyl ester (Fluo-3-AM) dye (Molecular probe). BAPTA which is an intracellular Ca2+chelator was added to the cells at a final concentration of 10 mM, 1 h prior to SL treatment. Cells were incubated with Fluo-3-AM (5 mM) for 15 min at 30 °C, washed twice with PBS and analysed by flow cytometer. In all the above flow cytometric assays, fluorescence was measured in FL1 channel and for each sample, 104 cells were analysed. Three independent experiments were performed with two replicates each time.qRT-PCR analysis
Effect of SL on the expression of CAT1, SOD1, HOG1, HAC1 and SAP9 was evaluated by two-step quantitative real time polymerase chain reaction (qRT-PCR). Total RNA of the cells was extracted from SL treated (100 μg mL−1 and 200 μg mL−1) and untreated samples in RPMI-1640 medium using hot phenol/chloroform extraction method.27 cDNA was synthesized from DNase I treated total RNA using iScript™ cDNA Synthesis Kit (BIO-RAD) as per manufacturer's instructions. Primers for target genes (CAT1, SOD1, HOG1, HAC1 and SAP9) and housekeeping internal control gene (ACT1) were designed using Gene Runner software (Table 1) and synthesized from Sigma. cDNA template (100 ng), gene specific primers (200 nM) and iQ™ SYBR® Green Supermix (BIO-RAD) were added to the reaction mixture in accordance with the manufacturer's instructions. qRT-PCR was performed in Mastercycler® eprealplex Real-time PCR system. The following parameters were used for qRT-PCR: an initial denaturation at 95 °C (3 min), followed by 40 cycles of denaturation (95 °C/1 min), annealing (58 °C/30 s), and extension (72 °C/20 s), and melting-curve analysis starting from initial temperature 50 °C to 95 °C, with gradual increase in 0.5 °C/15 second. The specificity of the primers was confirmed by melting curve analysis. The generated CT values of target genes were normalized to the CT value of housekeeping ACT1 gene. Relative expression fold changes were evaluated by ΔΔCT method using 2−ΔΔCT formula.28| Primer | Sequence (5′–3′) | Tm (°C) | Amplified product size (bp) |
|---|---|---|---|
| CaHOG1-R | GGTCAGAAAAGGTTTCATGAC | 53.0 | 90 |
| CaHOG1-F | ATGGGAGCATTTGGTTTG | 55.0 | |
| CaSOD1-R | AATATGGAAACCTCTCAAGGC | 51.0 | 140 |
| CaSOD1-F | TTAAAGCTGTCGCTGTTGTC | 54.0 | |
| CaSAP9-R | AGTTCCATGACCGAAAGATC | 54.0 | 252 |
| CaSAP9-F | GAGTCCAAAGATGATTTATCCC | 52.0 | |
| CaCAT1-R | AAAAACACCATAAGCACCG | 54.0 | 156 |
| CaCAT1-F | CCAATTCCAGAACCATTTG | 51.0 | |
| CaHAC1-R | ATTAGTTGGACCGGAAGATG | 55.0 | 203 |
| CaHAC1-F | TACAACCAACACATCAACCAG | 54.0 | |
| CaACT1-R | GGTTTGGAAGCTGCTGGTATTGACC | 60.8 | 135 |
| CaACT1-F | ACGTTCAGCAATACCTGGGAACATG | 60.0 |
Annexin V and propidium iodide (PI) staining
Annexin V-FITC 488 and PI staining was performed according to assay kit protocol (Life Technology, India). Briefly, cells were treated with different concentrations of SL as mentioned above. Cells were washed with cold PBS and resuspended in 500 μL annexin binding buffer together with 5 μL each of Annexin V and PI (10 mg mL−1). The cells were incubated for 30 min at room temperature. Stained cells were directly acquired and analysed by flow cytometry. Three independent experiments were done with two replicates each time.Lactate dehydrogenase release assay
The reduction of NAD+ to NADH in the cell medium was determined by lactate dehydrogenase (LDH) activity kit (Pierce, Thermo fisher scientific). Briefly, ∼2 × 10⁶ cells in 100 μL of YPD medium were dispensed in 96 well plate. Different concentrations of SL were added to each well and incubated the plate for 0, 12 and 24 h at 30 °C and further processed as described by manufacturer protocol. Followed by incubation for defined time-points, absorbance was measured using spectrophotometer (Bioteck) at 490 nm. Three independent experiments were performed with three triplicates. Values were expressed as mean with their corresponding standard deviations (SD) and statistical significance was analyzed by Student's t-test (two-tailed, unequal variance). A p-value of <0.05 was considered statistically significant.PI-staining and permeabilization assay
The Propidium Iodide (PI) staining assay was carried out as described by Alfatah et al.29 with slight modification. Briefly, C. albicans SC5314 cells of 0.5 OD were treated with different concentration of SL along with DMSO as vehicle control in 2 mL of YPD medium at 30 °C and 200 rpm for 5 h. Further, the treated cells were washed twice and resuspended in 1× PBS. Furthermore, in the dark condition, cells were incubated in PI stain (5 μg mL−1) at 30 °C for 30 min with shaking. The uptake of PI stain in the cells was visualized by Confocal Laser Scanning Microscopy (CLSM) at 60× magnification.Transmission electron microscopy (TEM)
The integrity of the cell's plasma membrane was visualised by TEM study. Briefly, cells were treated with SL as mentioned above. Samples were prepared as described by Sangetha et al., with slight modifications.30,31 After incubation with SL, cells were centrifuged and fixed with 2% glutaraldehyde at room temperature. After fixation, cells were washed with sodium phosphate buffer and post fixed with 1% OsO4 for 2 h at 4 °C. The cells were then dehydrated in series of ethanol concentrations. Negative staining was performed to visualise the lipid membrane.Time-kill curve assay
For time kill curve essay, C. albicans SC5314 and Δ hog1 mutant cells were inoculated in YPD medium at starting OD600 of 0.3 (about 6 × 10⁵ cells per mL) and allowed to grow overnight. SL alone (200 μg mL−1) and/or in combination with different concentrations of sorbitol (0.25 M and 0.5 M) (Sigma Aldrich) were added to cell suspension. Dimethyl sulfoxide (DMSO) (Sigma Aldrich) was used as vehicle control and the cell suspension was cultured at 30 °C, 200 rpm. Cells without SL were used as a negative control. Starting from 0 h time-point, OD of cell suspension was measured every 2 h intervals, using spectrophotometer (Hitachi, U2900). Six independent experiments were performed and plot using graphpad prism software.Statistical significance
Statistical significance between treated and control groups was analyzed by Student's t-test (two-tailed, unequal variance). A p-value of <0.05 was considered statistically significant.Results
Measurement of ROS production and overexpression of SOD1 and CAT1 in C. albicans treated with SL
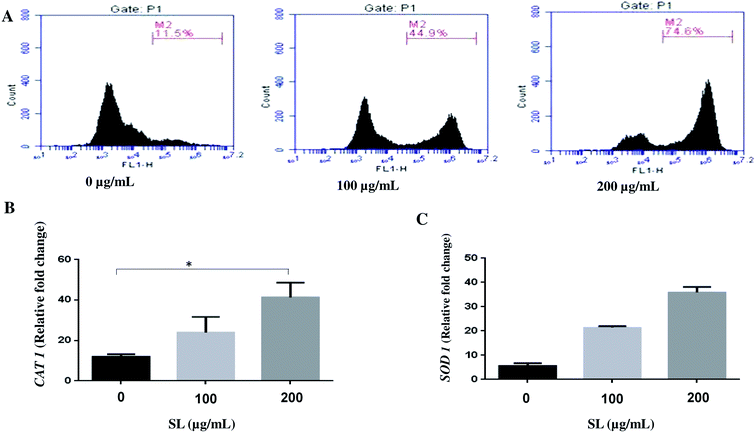
Literature reports suggest that SL induces cell death by activating various stress response pathway and ultimately by cell lysis.20–22 Therefore, we hypothesized that SL mediated cell death of Candida albicans occurs due to the activation of multiple stress response pathways. Cellular stress due to external stimuli is manifested by ROS production within the cell. Therefore, we determined the ROS production in C. albicans treated with SL, by measuring the fluorescence of ROS-specific dye H2-DCFDA. SL treatment enhanced the ROS generation in a concentration-dependent manner (Fig. 1A). In the presence of 100 μg mL−1 SL and 200 μg mL−1 SL, ROS generation was increased by 3.9-fold (45% of total cell population) and 6.5-fold (74% of cell population), respectively, as compared to control (11.5% of cell population) (Fig. 1A). Furthermore, higher level of superoxide dismutase (SOD) and catalase (CAT) production is known to be the general cellular response to mitigate the effect of high level of cellular ROS. Therefore, we studied the cellular expression level of CAT1 and SOD1 by quantitative RT-PCR. Treatment of SL was found to increase the CAT1 expression by 2 fold and 3 fold (Fig. 1B) and SOD1 transcript levels by 4 fold and 6 fold (Fig. 1C). (when treated with 100 and 200 μg mL−1 of SL separately, in each case).Alteration of mitochondrial membrane potential (MMP) in the presence of SL
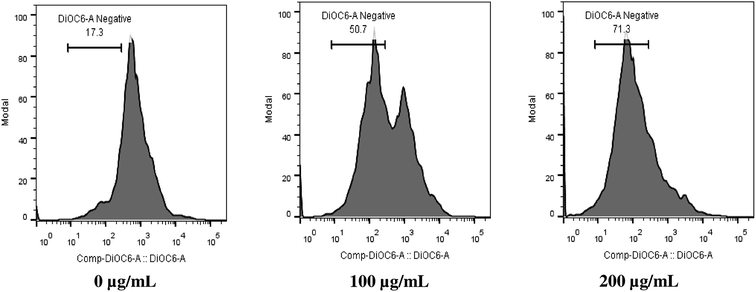
Mitochondria play pivotal role in cellular homeostasis, energy metabolism, ATP synthesis and protein synthesis and import. Maintenance of MMP is essential for normal cellular function.32–34 Here, we studied the effect of SL on alteration of MMP of C. albicans by measuring the fluorescence of a voltage-dependent dye DiOC6, using flow cytometry. It was found that 50% and 71% of cell population exhibited mitochondrial membrane depolarization at 100 μg mL−1 SL and 200 μg mL−1 SL concentration, respectively, thereby, indicating a dose-dependent effect (Fig. 2). These results suggest that SL affect the mitochondrial physiological integrity leading to the loss of its membrane potential which could be the reason of enhanced ROS production.SL causes endoplasmic reticulum (ER) stress and elevates intracellular Ca2+ level in C. albicans
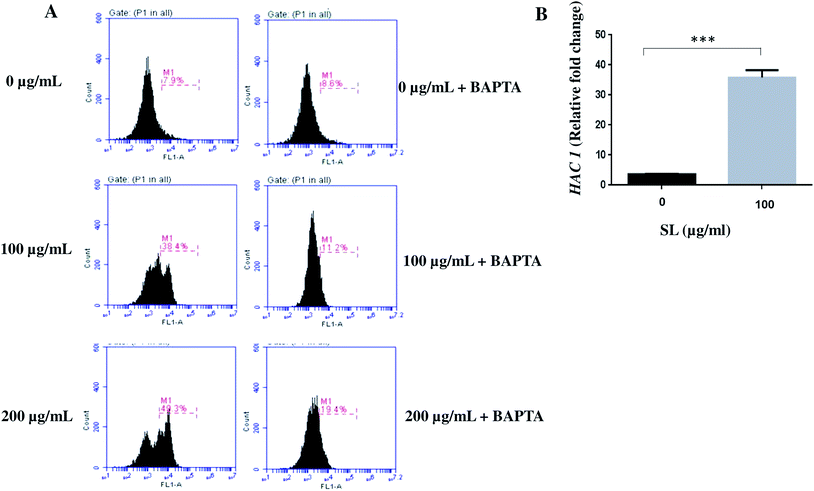
Endoplasmic reticulum (ER) works as the Ca2+ store home within the cellular environment. Upon ER stress, Ca2+ is released to the cytoplasm and subsequently enters to the mitochondria.34,35 Although Ca2+ mediated signalling helps the cells to cope up with the ER stress, it impairs the mitochondrial function leading to elevated ROS production.35,36 Since ER and mitochondria interplay through Ca2+ signalling during stress condition,34–36 we tested the effect of SL on intracellular Ca2+ level. The intracellular level of Ca2+ was measured by Fluo-3-AM. The labelled calcium indicator Fluo-3-AM exhibits an increase in fluorescence upon binding to Ca2+. We found that cells treated with 100 μg mL−1 SL and 200 μg mL−1 SL showed increased Ca2+ level by 4.9-fold (38.4% of cell population) and 6.2-fold (49.3% of cell population), respectively, as compared to control (7.9% of cell population) (Fig. 3, panel A). However, Fluo-3-AM fluoresces was quenched when the cells were treated with BAPTA (Ca2+ chelator; Fig. 3A). These results strongly suggested that SL causes ER stress which commits the release of stored Ca2+ into the cytosol.ROS disturbs protein folding and induces endoplasmic reticulum (ER) stress activating unfolded protein response (UPR) pathway. UPR elements are related to various ER-resident molecular chaperones and protein folding catalyst genes, classically known as Ire1-HAC1 signalling elements. Thus, the bZIP transcription factor HAC1 may be considered as a marker of ER stress. Here, we checked the expression of HAC1 in SL treated C. albicans cells by q-RT-PCR. The expression of HAC1 was found to be up-regulated by 5 fold and 7.6 fold when treated with 100 and 200 μg mL−1 of SL (Fig. 3B). Activation of HAC1 also signals the activation of many other downstream processes including Ca2+ leakage from the ER lumen.
SL mediates cell death through necrosis in C. albicans
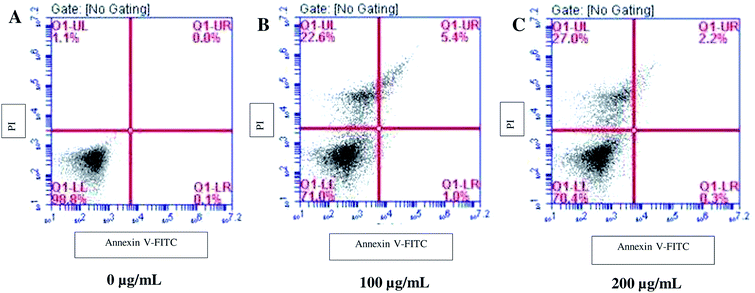
Since SL enhanced the ROS production; we examined the downstream effectors of ROS for apoptosis and necrosis by Annexin/PI assay. Annexin binds the surface exposed phosphatidylserine (an apoptosis marker) and gives positive signals, whereas, PI only enters dead or damaged cells (necrosed) and is excluded by the viable cells. When cells were treated with 100 μg mL−1 SL, ∼22% of cell population was PI-positive (upper left column, Fig. 4B), however, only a small number of cells were found to be annexin positive (upper right column, Fig. 4B) against the control (Fig. 4A). The PI-positive cell population was further increased to 27% when cells were treated with 200 μg mL−1 SL, whereas, almost negligible number of annexin positive cells were observed at this concentration (Fig. 4C). These results suggest that SL causes necrosis in C. albicans which attributes to cells death.SL causes membrane permeabilization in C. albicans
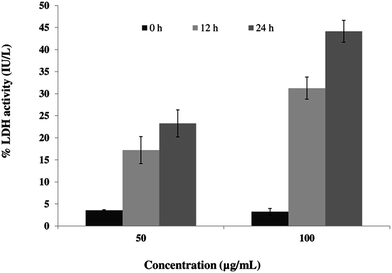
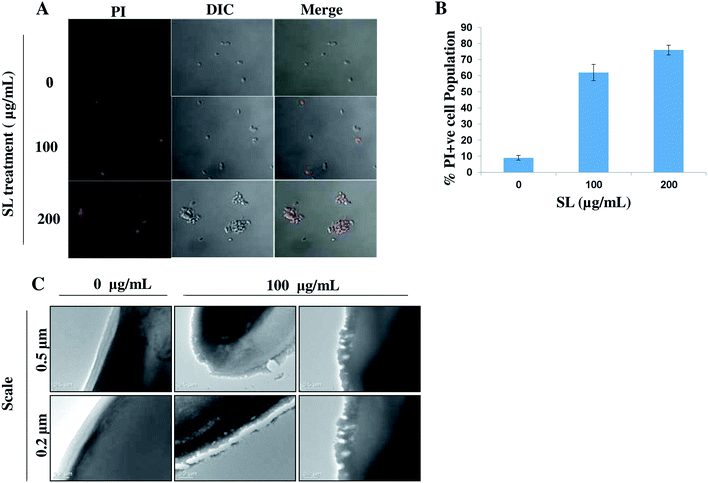
Permeabilization of the plasma membrane is a key signature of cell necrosis. This event can be quantified by measuring the release of intracellular enzyme lactate dehydrogenase (LDH) into the extracellular milieu. To further ensure the role of SL in necrosis, we performed LDH release assay. The released LDH can be quantified by a coupled enzymatic reaction. First, LDH catalyzes the conversion of lactate to pyruvate by reduction of NAD+ to NADH. Second, diaphorase uses NADH to reduce a tetrazolium salt (INT) into red formazan product. Therefore, the level of formazan formation is directly proportional to the amount of released LDH into the medium. When cells were incubated with 50 μg mL−1 SL for 12 and 24 h, the percentage LDH activity was increased by 4.8-fold and 6.5-fold, respectively (Fig. 5), as compared to control. The percentage LDH activity was further increased by 9.7-fold and 13.7-fold as compared to control when cells were incubated with 100 μg mL−1 SL for 12 and 24 h.Permeabilization of the cell membrane due to SL treatment can be observed by staining the treated cells with PI followed by visualization under CLSM (Fig. 6A). Due to SL treatment cell membrane integrity is lost and PI enters into the cells through the permeabilized cell membrane. The results showed that cells treated 100 μg mL−1 and 200 μg mL−1 of SL had 62% and 72% permeabilized cell respectively, compared to the 9% PI positive cells in untreated (control) condition (Fig. 6B).
We also carried out TEM analysis to visualize the effect of SL on C. albicans plasma membrane. We found that SL disturbed the integrity of the plasma membrane (Fig. 6C) causing pore formation confirming its role in necrosis.
Activation of HOG1 mitogen-activated protein kinase (MAPK) pathway in response to SL in C. albicans
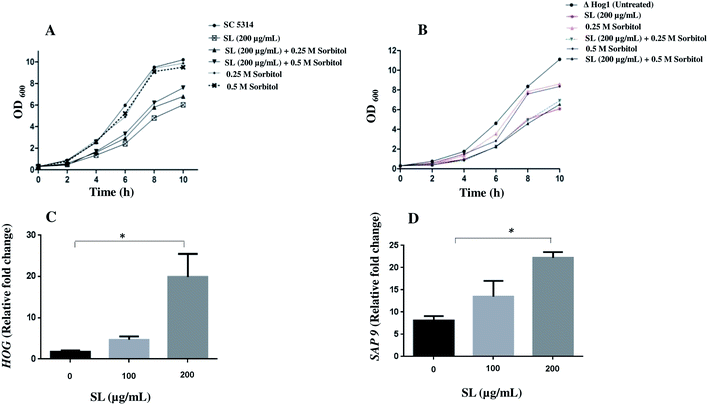
The high glycerol osmolarity (HOG; a branch of Mitogen Activated Protein Kinase) pathway plays a key role in the adaptation to high osmolarity condition. HOG pathway is also known to play an important role in other stress pathways including oxidative stress.37–39 Therefore, we checked the effect of SL on osmotic stress and the related HOG1 pathway in C. albicans and null Δ hog1 mutant cells. We found that in the presence of SL (200 μg mL−1), the growth of C. albicans SC5314 was retarded compared to untreated cells (Fig. 7A). Moreover, the growth was rescued when the cells were complemented with 0.25 M and 0.5 M sorbitol in addition to SL. In addition, null Δ hog1 mutant of C. albicans was unable to rescue the growth in presence of both molar concentration of sorbitol suggesting the role of HOG1 in SL mediated killing pathway (Fig. 7B). When the higher concentration of SL (500 μg mL−1) was used along with 0.5 M sorbitol on C. albicans cells and spotted on YPD plates, it showed increased sensitivity compared to SL (500 μg mL−1) and sorbitol (0.5 M) alone (data not shown).Thereafter, we were curious to know the effect of SL on the expression of HOG1 gene in C. albicans and estimated HOG1 expression by qRT-PCR. A significant increase of HOG1 expression indicated the involvement of HOG1 gene to mitigate the SL mediated stress response (Fig. 7C). Furthermore, we also checked the expression level of SAP9. Sap9 is a member of Sap family proteases and bound to the fungal cell surface by a glycosylphosphatidylinositol (GPI) anchor motif and is required for cell wall integrity.40 Impairment of SAP9 gene alters the adhesion properties and is considered important for C. albicans virulence. Therefore, we proceeded to check the effect of SL on SAP9 expression. Interestingly, we found that SAP9 expression was increased 1.8 and 3.1 fold after exposure to SL with 100 μg mL−1 and 200 μg mL−1 respectively (Fig. 7D).
Discussion
The inhibitory effect of SL on growth, biofilm formation and biofilm eradication of C. albicans has been reported in a previous study.19 In the present study, we have shown that the treatment of C. albicans cells with SL increases the ROS production and up-regulates the expression of SOD1 and CAT1, indicating higher level of oxidative stress and activation of stress responsive machineries. Generally, ROS is produced during normal physiological condition and is involved in various biological processes including regulation of proliferation, activation of gene expression and other cellular responses.41–43 However, extensive studies suggest that many external stimuli enhance ROS generation within the cell and excessive ROS level can induce cell death by necrosis or apoptosis.44–46 Since mitochondria are considered as a major site of ROS generation, excess ROS causes damage to the mitochondrial components perturbing with its membrane integrity. In order to elucidate the change in the mitochondrial membrane, we checked the mitochondrial membrane potential (MMP) by using flow cytometry. Our result indicates that ROS generation after SL treatment is associated with mitochondrial dysfunction. To counteract with excessive ROS production, cells possess various ROS defence systems which include redox buffers and specific antioxidant enzymes such as glutathione peroxidase, superoxide dismutase and catalase. Overexpression of these enzymes is a common mechanism to mitigate oxidative stress. In the present case, overexpression of SOD1 and CAT1 indicated higher level of oxidative stress and activation of stress responsive pathways. In that juncture, it has to be mentioned that SOD1 and CAT1 mRNA has longer half-life and generally the overexpression of these genes corresponds with the cellular protein level.47 However in the present study cellular protein level of CAT1 and SOD1 was not measured.The integrity and function of ER are crucial for the production of membrane-bound and secreted proteins and thus, its function is under tight control. Alteration in redox-homeostatic conditions lead to the failure of this control mechanism and the cell undergoes ER stress. Since ER stress is well characterized by overexpression of HAC1, a transcription factor involved in unfolded protein response (UPR) and is considered as a marker for ER stress.48 In our study, we have demonstrated that HAC1 expression is increased in SL treated cells. Carvacrol, an antifungal compound is known to exert its antifungal activity by disrupting calcium homeostasis and increasing HAC1 expression.49 The results of this study strongly support our findings. ER stress affects Ca2+ homeostasis by triggering the efflux of Ca2+ from the ER lumen to the cytoplasm. As a consequence of that, enhance cytosolic Ca2+ further magnifies ROS generation by entering into the mitochondria. In our study, we also observed a surge in Ca2+ level in the cytoplasm after the treatment with SL. Furthermore, the elevated intracellular ROS induces oxidative damage to DNA, proteins, lipids and other cellular components such as plasma membrane. Induction of these processes is associated with cellular death either by apoptosis or necrosis. Apoptosis is a well-accepted subroutine of programmed cell death (PCD), whereas, earlier reports described necrosis is as an ‘accidental’ form of cell death based on its presumed unregulated nature.33,35,50 However, over the past decade extensive evidences have emerged suggesting the role of specific genes in controlling the onset and progression of necrosis.33,50,51 As demonstrated earlier, an increased level of ROS within the cellular environment leads to lethal consequences such as oxidative stress, apoptosis and necrosis.32,52,53 In our study, Annexin/PI dependent flow cytometry analysis demonstrates that SL effectively induces necrosis in C. albicans. Moreover, one of the hallmarks of necrosis is loss of cellular membrane integrity and leaching out the intracellular enzymes including LDH. Since the leakage of LDH is considered to be an indicator of necrosis, we performed LDH assay in time and concentration dependent manner of SL; as a consequence, a significant increase in LDH release indicated the damage in cellular membrane integrity confirming the role of SL in necrosis. A similar result was observed by Basak et al., by the action of acidic diacetate SL on the Candida albicans and Salmonella enterica.54 In order to further confirm loss of the membrane integrity, Propidium Iodide (PI) staining assay was carried out by treating the cells with different concentrations of SL and then staining them with PI. The PI enters the cell only when it loses its membrane integrity. From the Fig. 6A it is evident that PI was taken up by 62% and 76% of SL (100 and 200 μg mL−1, respectively) treated cells indicating high-level membrane permeabilization and loss of membrane integrity. Furthermore, loss of membrane integrity was clearly visualised by TEM study.
To survive, C. albicans like other fungi are able to respond to changes in extracellular osmolarity and adjust their intracellular conditions to prevent itself from osmotic stress.55 Such adaptation to high osmolarity involves activation of the HOG pathway which is a branch of MAPK (Mitogen Activated Protein Kinase) signal transduction system.56 The basic physiological role of the HOG pathway is to orchestrate the adaptation of yeast cells against the surrounding medium.57 In our study, we observed over-expression of HOG1 in response to SL treatment indicating activation of HOG pathway. Moreover, we checked the effect of SL on osmotic stress and the related HOG1 pathway in C. albicans and null Δ hog1 mutant cells. This study clearly suggests involvement of HOG1 pathway in response to SL mediated stress. As we observed high sensitivity in null Δ hog1 mutant cells as compared to C. albicans SC5314 cells. This sensitivity was restored after addition of sorbitol in null Δ hog1 mutant cells. The reason for rescue of growth by sorbitol could be due to the production of glycerol because sorbitol is used as a precursor molecule in the glycerol synthesis leading to cell survival under osmotic stress conditions.58 Vylkova et al., reported similar results against histanin 5 which shows increased sensitivity to 1 M sorbitol when grown under osmotic-stress conditions.59 Furthermore, Sap9 is a cell-surface associated protease which helps in maintaining cell wall integrity in C. albicans. We hypothesised that Sap9 secretion may represent a defence mechanism of the cell in response to exposure to SL. Similarly, Copping et al., found increased expression of Sap9 in C. albicans after fluconazole treatment. Moreover their group established that several antifungal agents can influence the expression of at least one C. albicans virulence factor in vitro.60
Conclusion
In the present study, we have demonstrated that SL induces ROS formation in C. albicans and influence a cascade of stress response related activities in the cell. This process ultimately leads to the killing of the cells by membrane perforation and necrosis. Increased level of ROS formation, induction of ER stress and killing of C. albicans cells by necrosis or apoptosis is a common phenomenon that has been found to be activated due to the influence of many drugs.33 However, the present study for the first time demonstrated the mechanism of cell death due to the treatment of glycolipid. Modification of these molecules can lead to the development of new therapies against fungal infection.Abbreviations
| ROS | Reactive oxygen species |
| MMP | Mitochondrial membrane potential |
| HOG | High osmolarity glycerol |
| MAPK | Mitogen activated protein kinase |
Author contributions
F. H., M. A., S. B. and N. V. planned, executed the experiments and analysed the data. F. H. and N. V. M. S. B. discussed the data and co-wrote the manuscript.Funding
Funds for this project were obtained from CSIR project “OLP0082”. F. H. would like to thanks DST-INSPIRE, M. A., S. B. and N. V. would like to thank CSIR, India and DBT, India for their fellowship.Conflicts of interest
Authors do not have any competing interest.Acknowledgements
Authors are thankful to DST and CSIR for funding and CSIR-IMTECH for providing technical facilities. Authors are extremely thankful to Dr Sneh Lata, JNU, New Delhi and Dr Jesus Pla, Madrid, Spain for providing the mutant strain. Authors are also thankful to Mr Randeep for TEM studies and Mrs Anjali and Mr Ella Bhagyaraj for FACS experiments. We are also thankful to Dr K. Ganesan for allowing us to carry out initial experiments in his lab and also for providing experimental support.References
- M. A. Pfaller and D. J. Diekema, Clin. Microbiol. Rev., 2007, 20, 133–163 CrossRef CAS PubMed
.
- J. C. O. Sardi, L. Scorzoni, T. Bernardi, A. M. Fusco-Almeida and M. J. S. Mendes Giannini, J. Med. Microbiol., 2013, 62, 10–24 CrossRef CAS PubMed
.
- G. D. Brown, D. W. Denning, N. A. R. Gow, S. M. Levitz, M. G. Netea and T. C. White, Sci. Transl. Med., 2012, 4, 165rv13 Search PubMed
.
- D. R. Andes, N. Safdar, J. W. Baddley, G. Playford, A. C. Reboli, J. H. Rex, J. D. Sobel, P. G. Pappas and B. J. Kullberg, Clin. Infect. Dis., 2012, 54, 1110–1122 CrossRef CAS PubMed
.
- S. Biswas, P. Van Dijck and A. Datta, Microbiol. Mol. Biol. Rev., 2007, 71, 348–376 CrossRef CAS PubMed
.
- P. E. Sudbery, Nat. Rev. Microbiol., 2011, 9, 737–748 CrossRef CAS PubMed
.
- Z. A. Kanafani and J. R. Perfect, Clin. Infect. Dis., 2008, 46, 120–128 CrossRef PubMed
.
- T. Shekhar-Guturja, G. M. K. B. Gunaherath, E. M. K. Wijeratne, J. P. Lambert, A. F. Averette, S. C. Lee, T. Kim, Y. S. Bahn, F. Tripodi, R. Ammar, K. Döhl, K. Niewola-Staszkowska, L. Schmitt, R. J. Loewith, F. PRoth, D. Sanglard, D. Andes, C. Nislow, P. Coccetti, A. C. Gingras, J. Heitman, A. Gunatilaka and L. ECowen, Nat. Chem. Biol., 2016, 12, 867–875 CrossRef CAS PubMed
.
- S. A. Davis, B. M. Vincent, M. M. Endo, L. Whitesell, K. Marchillo, D. R. Andes, S. Lindquist and M. D. Burke, Nat. Chem. Biol., 2015, 11, 481–487 CrossRef CAS PubMed
.
- K. C. Gray, D. S. Palacios, I. Dailey, M. M. Endo, B. E. Uno, B. C. Wilcock and M. D. Burke, Proc. Natl. Acad. Sci., 2012, 109, 2234–2239 CrossRef CAS PubMed
.
- M. D. Johnson, C. Macdougall, L. Ostrosky-zeichner, J. R. Perfect and J. H. Rex, Antimicrob. Agents Chemother., 2004, 48, 693–715 CrossRef CAS PubMed
.
- A. P. Tulloch, J. F. T. Spencer and M. H. Deinema, Can. J. Chem., 1968, 46, 345–348 CrossRef CAS
.
- C. P. Kurtzman, N. P. J. Price, K. J. Ray and T. M. Kuo, FEMS Microbiol. Lett., 2010, 311, 140–146 CrossRef CAS PubMed
.
- M. A. Díaz De Rienzo, I. M. Banat, B. Dolman, J. Winterburn and P. J. Martin, New Biotechnol., 2015, 32, 720–726 CrossRef PubMed
.
- V. Shah, G. F. Doncel, T. Seyoum, K. M. Eaton, I. Zalenskaya, R. Hagver, A. Azim and R. Gross, Antimicrob. Agents Chemother., 2005, 49, 4093–4100 CrossRef CAS PubMed
.
- S. L. Fu, S. R. Wallner, W. B. Bowne, M. D. Hagler, M. E. Zenilman, R. Gross and M. H. Bluth, J. Surg. Res., 2008, 148, 77–82 CrossRef CAS PubMed
.
- L. Shao, X. Song, X. Ma, H. Li and Y. Qu, J. Surg. Res., 2012, 173, 286–291 CrossRef CAS PubMed
.
- M. H. Bluth, E. Kandil, C. M. Mueller, V. Shah, Y. Y. Lin, H. Zhang, L. Dresner, L. Lempert, M. Nowakowski, R. Gross, R. Schulze and M. E. Zenilman, Crit. Care Med., 2006, 34, E188 CrossRef PubMed
.
- F. Haque, M. Alfatah, K. Ganesan and M. S. Bhattacharyya, Sci. Rep., 2016, 6, 23575 CrossRef CAS PubMed
.
- K. Kim, D. Yoo, Y. Kim, B. Lee, D. Shin and E. K. Kim, J. Microbiol. Biotechnol., 2002, 12, 235–241 CAS
.
- K. Joshi-Navare and A. Prabhune, BioMed Res. Int., 2013, 512495 Search PubMed
.
- J. Chen, X. Song, H. Zhang, Y. B. Qu and J. Y. Miao, Appl. Microbiol. Biotechnol., 2006, 72, 52–59 CrossRef CAS PubMed
.
- R. Alonso-Monge, F. Navarro-Garcia, E. Roman, A. I. Negredo, B. Eisman, C. Nombela and J. Pla, Eukaryotic Cell, 2003, 2, 351–361 CrossRef CAS PubMed
.
- J. L. Brewster, T. de Valoir, N. D. Dwyer, E. Winter and M. C. Gustin, Science, 1993, 259, 1760–1763 CrossRef CAS PubMed
.
- S. Sharma, M. Alfatah, V. K. Bari, Y. Rawal, S. Paul and K. Ganesan, Antimicrob. Agents Chemother., 2014, 58, 2409–2414 CrossRef PubMed
.
- F. Haque, M. Sajid, S. S. Cameotra and M. S. Battacharyya, Biofouling, 2017, 33, 768–779 CrossRef CAS PubMed
.
- M. Amin-ul Mannan, S. Sharma and K. Ganesan, Anal. Biochem., 2009, 389, 77–79 CrossRef CAS PubMed
.
- K. J. Livak and T. D. Schmittgen, Methods, 2001, 25, 402–408 CrossRef CAS PubMed
.
- M. Alfatah, J. H. Wong, C. E. Nge, K. W. Kong, K. N. Low, C. Y. Leong, S. Crasta, M. Munusamy, A. M. L. Chang, S. Hoon, S. B. Ng, Y. Kanagasundaram and P. Arumugam, Sci. Rep., 2019, 9, 710 CrossRef PubMed
.
- S. Sangetha, Z. Zuraini, S. Suryani and S. Sasidharan, Micron, 2009, 40, 439–443 CrossRef CAS PubMed
.
- H. H. Lara, D. G. Romero-Urbina, C. Pierce, J. L. Lopez-Ribot, M. J. Arellano-Jiménez and M. Jose-Yacaman, J. Nanobiotechnol., 2015, 13, 91 CrossRef PubMed
.
- G. G. Perrone, S. X. Tan and I. W. Dawes, Biochim. Biophys. Acta, Mol. Cell Res., 2008, 1783, 1354–1368 CrossRef CAS PubMed
.
- T. Eisenberg, D. Carmona-Gutierrez, S. Büttner, N. Tavernarakis and F. Madeo, Apoptosis, 2010, 15, 257–268 CrossRef PubMed
.
- B. Hao, S. Cheng, C. J. Clancy and M. H. Nguyen, Antimicrob. Agents Chemother., 2013, 57, 326–332 CrossRef CAS PubMed
.
- D. Carmona-Gutierrez, T. Eisenberg, S. Büttner, C. Meisinger, G. Kroemer and F. Madeo, Cell Death Differ., 2010, 17, 763–773 CrossRef CAS PubMed
.
- J. D. Malhotra and R. J. Kaufman, Cold Spring Harbor Perspect. Biol., 2011, 3, a004424 Search PubMed
.
- M. Hayashi and T. Maeda, J. Biochem., 2006, 139, 797–803 CrossRef CAS PubMed
.
- M. Thorsen, Y. Di, C. Tängemo, M. Morillas, D. Ahmadpour, C. Van Der Does, A. Wagner, E. Johansson, J. Boman, F. Posas, R. Wysocki and M. J. Tamás, Mol. Biol. Cell, 2006, 17, 4400–4410 CrossRef CAS PubMed
.
- E. Bilsland, C. Molin, S. Swaminathan, A. Ramne and P. Sunnerhagen, Mol. Microbiol., 2004, 53, 1743–1756 CrossRef CAS PubMed
.
- D. J. Krysan, E. L. Ting, C. Abeijon, L. Kroos and R. S. Fuller, Eukaryotic Cell, 2005, 4, 1364–1374 CrossRef CAS PubMed
.
- Y. Morel and R. Barouki, Biochem. J., 1999, 342(Pt 3), 481–496 CrossRef CAS PubMed
.
- W. Dröge, Physiol. Rev., 2002, 82, 47–95 CrossRef PubMed
.
- H. Sauer, M. Wartenberg and J. Hescheler, Cell. Physiol. Biochem., 2001, 11, 173–186 CrossRef CAS PubMed
.
- W. Lee and D. G. Lee, Free Radical Res., 2018, 52, 39–50 CrossRef CAS PubMed
.
- M. Zhang, W. Chang, H. Shi, Y. Li, S. Zheng, W. Li and H. Lou, FEMS Yeast Res., 2018, 1–10 Search PubMed
.
- H. Choi and D. G. Lee, Biochimie, 2015, 115, 108–115 CrossRef CAS PubMed
.
- L. Sun, K. Liao, C. Hang and D. Wang, PLoS One, 2017, 12(2), e0172228 CrossRef PubMed
.
- T. H. Lee, Y. H. Bae, M. D. Kim and J. H. Seo, Process Biochem., 2012, 47, 2300–2305 CrossRef CAS
.
- J. Chaillot, F. Tebbji, A. Remmal, C. Boone, G. W. Brown, M. Bellaoui and A. Sellam, Antimicrob. Agents Chemother., 2015, 59, 4584–4592 CrossRef CAS PubMed
.
- D. E. Christofferson and J. Yuan, Curr. Opin. Cell Biol., 2010, 22, 263–268 CrossRef CAS PubMed
.
- N. Vanlangenakker, T. Vanden Berghe, D. V Krysko, N. Festjens and P. Vandenabeele, Curr. Mol. Med., 2008, 8, 207–220 CrossRef CAS PubMed
.
- A. J. Phillips, I. Sudbery and M. Ramsdale, Proc. Natl. Acad. Sci. U. S. A., 2003, 100, 14327–14332 CrossRef CAS PubMed
.
- D. J. Jamieson, Yeast, 1998, 14, 1511–1527 CrossRef CAS PubMed
.
- G. Basak, D. Das and N. Das, J. Microbiol. Biotechnol., 2014, 24, 87–96 CrossRef CAS PubMed
.
- A. Blomberg and L. Adler, Adv. Microb. Physiol., 1992, 33, 145–212 CrossRef CAS PubMed
.
- S. Hohmann, FEBS Lett., 2009, 583, 4025–4029 CrossRef CAS PubMed
.
- S. Hohmann, Microbiol. Mol. Biol. Rev., 2002, 66, 300–372 CrossRef CAS PubMed
.
- B. Shen, S. Hohmann, R. G. Jensen and a H. Bohnert, Plant Physiol., 1999, 121, 45–52 CrossRef CAS PubMed
.
- S. Vylkova, W. S. Jang, W. Li, N. Nayyar and M. Edgerton, Eukaryotic Cell, 2007, 6, 1876–1888 CrossRef CAS PubMed
.
- V. M. S. Copping, C. J. Barelle, B. Hube, N. A. R. Gow, A. J. P. Brown and F. C. Odds, J. Antimicrob. Chemother., 2005, 55, 645–654 CrossRef CAS PubMed
.
Footnotes |
| † Electronic supplementary information (ESI) available. See DOI: 10.1039/c9ra07599b |
| ‡ Contributed equally to this work. |
| § Current address: Department of Immunology and Genomic Medicine, Graduate School of Medicine, Kyoto University, Japan. |
| ¶ Current address: Chemical Genomics Lab, Bioinformatics Institute, Agency for Science, Technology and Research (A*STAR), Singapore 138673. |
| || Current address: School of Molecular Cell Biology and Biotechnology, Tel Aviv University, Ramat Aviv, Israel. |
| This journal is © The Royal Society of Chemistry 2019 |

