 Open Access Article
Vertically aligned Pt/TiO2 nanobelt films on Ti sheets for efficient degradation of a refractory ethyl thionocarbamate collector†
Pingfeng Fu *ab,
Yanhong Maa,
Gen Lia and
Xiaofeng Lina
aSchool of Civil and Resources Engineering, University of Science and Technology Beijing, Beijing 100083, China. E-mail: pffu@ces.ustb.edu.cn; Fax: +86 10 82385795; Tel: +86 13520202167
bKey Laboratory of High-efficient Mining and Safety of Metal Mines, Ministry of Education, Beijing 100083, China
First published on 25th November 2019
Abstract
Noble metal modified TiO2 nanostructures on a substrate featuring a two-dimensional (2D) morphology are of great interest in wastewater remediation due to high photocatalytic activity and avoidance of separating powder catalysts from water. In this work, vertically aligned Pt/TiO2 nanobelt films (Pt/TNFs) on Ti sheets were fabricated via a synthesis strategy including an alkaline hydrothermal treatment and electrostatic self-assembly. The Pt/TNFs had a BET specific surface area of 93.35 m2 g−1, showing high adsorption capacity in removing an ethyl thionocarbamate (ETC) flotation collector. After the deposition with Pt nanoparticles, the photocatalytic activity of the TNFs increased by 94.98% with the enhanced mineralization of the ETC collector. Moreover, the Pt/TNFs on Ti sheets exhibited strong substrate adhesion enabling superior photocatalytic stability in the cyclic degradation of ETC. The solid phase extraction and gas chromatography-mass spectrometry (SPE/GC-MS) analysis revealed that seven byproducts still remained even when 100% of ETC was degraded, showing the difficulty in the complete mineralization of the ETC collector. The Pt/TNF can serve as a promising photocatalyst to treat mineral flotation wastewaters containing organic reagents.
1. Introduction
The treatment and recycling of wastewater discharged from various industrial processes have become an important problem of great concern. With the rapid development of the global mining industry, a variety of synthetic organic collectors are used in the flotation of target minerals from ores.1,2 The industrial mineral flotation processes discharge a large volume of effluents containing residual collectors and their byproducts.3,4 Due to the escaped emissions of flotation reagents from tailing dams, the pollution of agricultural soils and water bodies has become a serious global environmental problem because of the high toxicity and low biodegradability of synthetic reagents.4–6The removal of refractory collectors from flotation wastewaters has attracted great attention. However, it is difficult to effectively treat flotation wastewaters by traditional methods such as adsorption,7 anaerobic biodegradation,6 dissolved air flotation,8 ozone/vacuum-UV9 and coagulation-flocculation.10 Most of these techniques just change the forms of the contamination. Among advanced oxidation processes to remediate flotation wastewaters, the photocatalysis has been considered as a promising method not only to remove refractory collectors, but also to mineralize their byproducts.11–13 TiO2-based catalysts have been widely used in photocatalytic degradation of contaminants with numerous benefits such as cost-effectiveness, chemical stability and nontoxicity.14–16 In particular, one-dimensional (1D) TiO2 nanostructures such as nanotubes, nanowires and nanosheets have received great attention due to larger surface area, enhanced light absorption and long-distance electron transport capacity in comparison to TiO2 nanoparticles (NPs).17,18
The efficiency of photocatalytic water purification using TiO2 is limited owing to short lifetime of photoexcited carriers.14,19 The modification of TiO2 nanostructures with noble metals exhibits improved photocatalytic activity over blank TiO2 due to the Schottky-barrier formation.20–22 Noble metal acts as an electron trap to minimize the electron–hole recombination with the longer lifetime of photoexcited carriers.23 However, most of noble metal modified 1D TiO2 nanostructures are still in form of powder catalyst.20,21,24,25 In practical applications, to avoid the secondary pollution and the loss of catalyst mass, TiO2 powders are generally required to be loaded on a substrate or pressed into porous ceramics.26 Therefore, it is necessary to fix noble metal modified TiO2 nanostructures on a substrate to achieve superior substrate adherence for stable and long-term photocatalytic performance.
Nevertheless, the fabrication of noble metal modified two-dimensional (2D) TiO2 nanostructures on a substrate generally involves complex procedures. Zhang et al.26 reported that Pt/TiO2 nanosheets on Ti mesh could be prepared via hybrid plasma electrolytic oxidation and hydrothermal method followed by the photodeposition of Pt nanoparticles (NPs). Au/Pt alloy particles decorated TiO2 nanotube arrays on Ti alloys was fabricated via the anodization of Au/Pt containing Ti alloys followed by the DC magnetron sputtering of Au/Pt alloys.27 In our previous work, ultrafine Au NPs were uniformly dispersed on porous TiO2 films via a simple electrostatic self-assembly method.28,29 In this work, vertically aligned TiO2 nanobelt films (TNFs) on Ti sheet are in situ synthesized through an alkaline hydrothermal method followed by a cation exchange and dehydration process.30,31 Owing to its large work function, high activity and enhanced UV absorption induced by localized surface plasmon response effect (LSPR),32 platinum (Pt) is chosen to modify TiO2 nanobelts via the electrostatic self-assembly to produce vertically aligned 2D Pt/TiO2 nanobelt films (Pt/TNFs) on Ti sheet. Ultrafine Pt NPs are uniformly dispersed both on the surface and within the interior framework of 2D TNFs without grafting of TiO2 with functional organics. The Pt/TNFs in this work have merits of all-in-one structure, high surface area, strong substrate adhesion and improved photocatalytic activity in removing organic pollutants.
The ethyl thionocarbamate (ETC) is a typical flotation collector widely used to separate sulfide minerals from ores.1,33,34 However, the ETC collector with initial concentration of 30 mg L−1 is difficult to be biodegraded with a primary biodegradation efficiency of only 37% in 8 days.5 Moreover, the ozonation of ETC is also low efficient with the rate constant of just 0.0194 min−1, much lower than that of other collectors such as ethyl xanthate (0.0579 min−1) and diethyl dithiocarbamate (0.0687 min−1).35 Therefore, the refractory ETC collector is chosen as target organic pollutant in flotation wastewaters. In this work, the removal efficiency, mineralization and cyclic degradation of ETC collector are evaluated by using the Pt/TNFs as the photocatalyst. The degradation byproducts are identified by the solid phase extraction and gas chromatography-mass spectrometry (SPE/GC-MS) analysis. The enhanced mechanisms of ETC degradation by Pt modification of TNFs are proposed.
2. Materials and methods
2.1 Materials and chemicals
The Ti sheet (purity of 99.5%) was purchased from Baoji Hongyuan Titanium Company, Shaanxi province, China. A 10 W low-pressure mercury lamp, with UV irradiation distribution seen in Fig. S1,† was purchased from Bright Star Light & Electricity Co., Ltd, Guangdong, China. All chemicals were used as received without further purification. Hydrogen hexachloroplatinate hexahydrate, (99.9%, H2PtCl6·6H2O), sodium borohydride (98.2%, NaBH4), polyvinyl alcohol (PVA, molecular weight of ca. 1750) were purchased from Sinopharm Chemical Reagent Co., Ltd, Beijing, China. The ethyl thionocarbamate ((CH3)2CHOCSNHC2H5) collector was received as industrial grade from Tieling Flotation Reagents Co. Ltd, China. The molecular structure of ETC was shown in Fig. S2 (see in ESI).† Deionized water was used in all experiments.2.2 Preparation of Pt/TiO2 nanobelt films on Ti sheet
The Ti sheet, with a size of 180 × 120 mm, was etched in 10 wt% boiling oxalic acid solution for 1 h, then rinsed with deionized water and dried in air. The pretreated Ti sheet with grey-white color was put into a Teflon-lined stainless steel autoclave, into which 8.0 mol L−1 NaOH aqueous solution was transferred. The autoclave was maintained at 160 °C for 36 h. After cooling down, the Ti sheet was rinsed with deionized water, then protonated in a 0.1 mol L−1 HCl solution for 24 h. Then, the protonated Ti sheet was annealed in air at 450 °C for 5 h to obtain vertically aligned TiO2 nanobelt films (TNFs) on Ti sheet.The modification of TNFs with Pt NPs using the electrostatic self-assembly had similar procedure given in our previous work.28 354 mg of PVA was dissolved into 0.3 mmol L−1 of H2PtCl6 solution (200 mL). By keeping the H2PtCl6 solution at 0 °C, 10 mL of fresh NaBH4 solution (0.07 mol L−1) was rapidly added to produce Pt colloids under hybrid sonication and vigorous stirring. Afterwards, the TNFs on Ti sheet were immersed into Pt colloidal solution to assemble prefabricated Pt NPs on TiO2 via the electrostatic self-assembly. The pH of Pt colloidal solution was controlled to be 2.0–12.0 to adjust the Pt loading on TiO2. After 90 min of self-assembly, the TNFs on Ti sheet were withdrawn, washed with boiling water to remove Cl− ions, and finally annealed in air at 300 °C for 1.5 h to remove the capped PVA. Thus, vertically aligned Pt/TiO2 nanobelt films (Pt/TNFs) on Ti sheet were fabricated.
2.3 Characterization
The morphologies of the samples were observed using an ultra high-resolution field-emission scanning electron microscope (FESEM, S-5500, Hitachi, second electron resolution: 0.4 nm/30 kV). The crystalline phases of all samples were analyzed by X-ray diffraction (XRD, Rigaku D/max-RB) with Cu Kα radiation (λ = 0.15418 nm) as the X-ray source. The in-depth analysis of Pt content within the framework of the Pt/TNFs was performed by Auger electron spectroscopy (AES, PHI 610/SAM). X-ray photoelectron spectroscopy (XPS) measurements were carried out using a PHI-5300 photoelectron spectrometer at 50 eV pass energy with Al Kα as an exciting X-ray source. Nitrogen adsorption and desorption isotherms of titanic acid, TNFs and Pt/TNFs scratched from Ti sheet were recorded at 77.3 K using a QuadraSorb NOVA4000 instrument. The titanic acid, TNFs and Pt/TNFs on Ti sheet were inserted into deionized water, respectively, and treated for 45 min under ultrasonic vibration (KQ-600ES ultrasonic cleaner, Kunshan Ultrasonic Instruments Co. Ltd., China). Then the powders were filtrated and dried at 100 °C for 1 h. The Pt loading was determined by using an inductively coupled plasma-atomic emission spectrometry (ICP-AES, IRIS Intrepid II XSP). The Pt/TNFs sample was immersed in aqua regia for 24 h to fully dissolve Pt NPs loaded on TiO2 nanobelts.2.4 Photocatalytic degradation of ETC collector
The photocatalytic degradation of ETC collector was performed in a 350 mL cylindrical pyrex reactor. The photocatalyst, Pt/TNFs on Ti sheet, was rolled up and inserted into the cylindrical reactor. The UV lamp was fixed at the center of reactor. The intensity of UV irradiation at 254 nm reached 8.52 mW cm−2 on the photocatalyst surface (ST-85 Illuminometer, Photoelectric Instrument Factory of Beijing Normal University, China). After 300 mL of ETC solution (100 mg L−1) was introduced into the reactor and bubbled with an air stream, the UV lamp was switched on to conduct the degradation of ETC collector. The aqueous samples were taken at designed intervals to determine the concentrations of ETC, TOC and SO42− ions. For the purpose of evaluating photocatalytic stability, the cyclic degradation of ETC was carried out. Before introducing fresh ETC solution into the reactor, the Pt/TNFs on Ti sheet in the reactor were washed with deionized water with the stirring of air stream to remove adsorbed organics. The adsorption of ETC collector by the Pt/TNFs was performed with the procedure similar to that of photocatalytic degradation except for switching off UV lamp.2.5 Determination of the concentrations of ETC, TOC, SO42− and identification of byproducts
The concentration of ETC collector was determined by a UV-vis spectroscopic method (UV-5500PC, Shanghai Metash Instruments Co. Ltd, China).35 The total organic carbon (TOC) of treated ETC solution was measured using a Shimadzu TOC-V organic carbon analyzer. The concentration of SO42− ions was analyzed by a barium chromate spectrophotometry method (HJ/T 342-2007). The degradation byproducts of ETC collector were identified by the SPE/GC-MS. The byproducts were extracted via the solid phase extraction (SPE) procedures. The SPE extracts were analyzed by the GC-MS (Shimadzu, GCMS-QP2010 SE, Japan), equipped with a capillary column (Zebron ZB-FFAP, 30 m × 0.32 mm × 0.25 μm, Phenomenex, U.S.).3. Results and discussion
3.1 Characterization of vertically aligned Pt/TiO2 nanobelt films
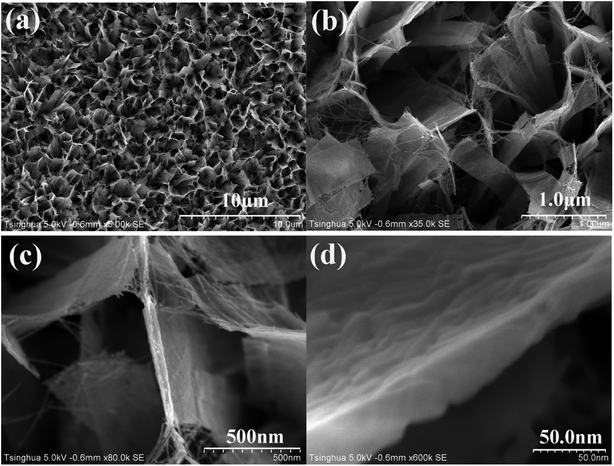 | ||
Fig. 1 Typical FESEM images of TiO2 nanobelt films on Ti sheet with various magnifications ((a) ×5000, (b) ×35![[thin space (1/6-em)]](https://www.rsc.org/images/entities/char_2009.gif) 000, (c) ×80 000, (c) ×80![[thin space (1/6-em)]](https://www.rsc.org/images/entities/char_2009.gif) 000, (d) ×600 000, (d) ×600![[thin space (1/6-em)]](https://www.rsc.org/images/entities/char_2009.gif) 000). 000). | ||
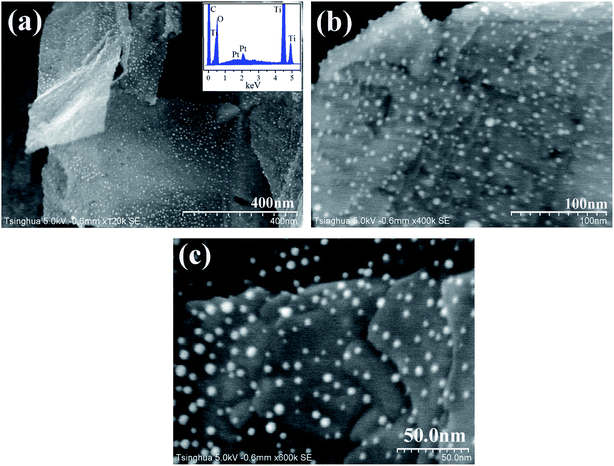
Pt NPs are deposited on the TNFs via the electrostatic self-assembly. As shown in Fig. 2, Pt NPs (white dots) are distributed uniformly on the surface of TiO2 nanobelts. The EDX spectrum demonstrates the presence of Pt on TiO2 surface. The average size of Pt NPs is ca. 5 nm, and Pt particles have an approximately spherical shape. As illustrated in Fig. 2, Pt NPs are well physically separated from each other, revealing that no agglomeration of Pt particles has occurred in the annealing treatment at 300 °C to remove capped PVA. It is well accepted that the contact area and boundary length of noble metal on TiO2 surface may become larger at certain metal loading if noble metal has smaller size and more uniform distribution. As revealed by Bowker et al.,37 the larger the metal-support boundary, the higher the reaction activity of photocatalysts. Thus, the features of Pt NPs, including ultrafine size, uniform dispersion and physical separation, can enhance the separation of photoexcited electron–hole pairs.
It is well known that sodium titanate has an excellent capacity of cation exchange due to its layered structure.38 After the alkaline hydrothermal treatment, sodium titanate grown on Ti sheet is protonated in a dilute HCl solution to replace sodium ions in the layered structure, converting into titanic acid. As shown in Fig. 3, titanic acid has typical diffraction peaks of 2θ at 9.43°, 25.24° and 48.69°, which can be assigned to crystalline planes of layered H2TinO2n+1·xH2O.39,40 After annealing at 450 °C for 5 h, titanic acid is transformed into TiO2 with 81.2% of anatase and 18.8% of rutile as illustrated in Fig. 3. The morphology of vertically aligned TiO2 nanobelts in Fig. 1 exhibits that no damage and collapse of the nanobelt framework should occur in the phase conversion from sodium titanate to TiO2. Although Pt NPs are definitely dispersed on TiO2 nanobelts as shown in Fig. 2, no diffraction peaks of Pt metal or oxides are observed in Fig. 3. It may be attributed to low Pt loading for XRD detection.
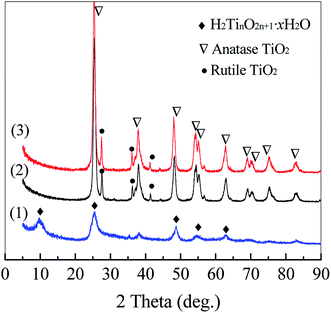 | ||
| Fig. 3 XRD patterns of titanic acid (1), TiO2 nanobelts (2) and Pt/TiO2 nanobelt films (3) exfoliated from Ti sheet. | ||
Table S1 (ESI)† summarizes the BET specific surface area (SBET) of titanic acid, TiO2 nanobelt and Pt/TiO2 nanobelt films exfoliated from Ti sheet. The conversation of titanic acid to TiO2 has reduced the SBET of nanobelt materials due to the dehydration and crystal-lattice rearrangement caused by the thermal treatment. However, the dispersion of Pt NPs has little impact on the SBET of TiO2 nanobelts. In this work, the Pt/TiO2 nanobelts have much larger surface area than standard Degussa P25 TiO2 (SBET ≈ 50 m2 g−1), which may be ascribed to rough surface and ultra-thin thickness of TiO2 nanobelts. For the fabricated Pt/TNFs, the high surface area and porous framework of TiO2 films are expected to enhance the adsorption of pollutants onto UV-illuminated TiO2 surface.
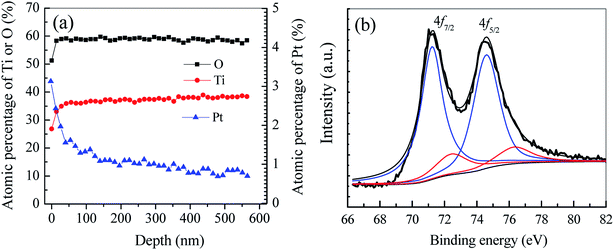 | ||
| Fig. 4 AES in-depth elemental analysis (a) and Pt 4f core level XPS spectrum (b) of Pt/TiO2 nanobelt films. | ||
To determine the chemical state of Pt in as-prepared Pt/TNFs, XPS analysis is conducted. As shown in Fig. 4b, the binding energy of Pt 4f can be divided into the sum of two pair doublets. The most intense doublet, located at the binding energy of 71.1 (Pt 4f7/2) and 74.4 eV (Pt 4f5/2), can be attributed to metallic Pt (Pt0) on the surface of TiO2 nanobelts.41,42 The week intense doublet located at 72.3 (Pt 4f7/2) and 76.6 eV (Pt 4f5/2) can be ascribed to +2 oxidation state of Pt (PtO).43,44 Based on the deconvoluted peak areas, the atomic fractions of Pt0 and PtO account for 82.3% and 17.7%, respectively. The results reveal that Pt NPs loaded on TiO2 nanobelts have been partially oxidized into higher oxidation states during the annealing treatment in air at 300 °C.
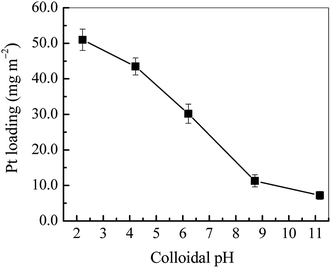
As displayed in Fig. S3,† the absolute ζ value of Pt colloids is very small at pH < 4.0, meaning that the electrostatic repulsion force among Pt NPs may be weak. Thus Pt NPs may agglomerate with each other to reduce the stability of Pt colloids. In this work, the capping of Pt NPs with PVA plays a significant role in preventing the agglomeration of ultra-fine Pt NPs through the steric hindrance effect as shown in Fig. S4.† In addition, the low temperature (0 °C) of Pt colloids is kept to depress the agglomeration and growth of colloidal Pt NPs. In our previous study, the low colloidal temperature was found to effectively keep Au colloids stable by suppressing the growth of Au NPs.28
3.2 Photocatalytic degradation of ETC collector
The photocatalytic activity of vertically aligned Pt/TiO2 nanobelt films (Pt/TNFs) on Ti sheet is evaluated by degrading aqueous ETC collector. The degradation performances are shown in Fig. 6 and Table S2 (ESI).† As shown in Fig. 6a, only 3.54% of ETC is removed by UV photolysis at 90 min, revealing that the degradation of ETC collector is very low efficient by absorbing UV254 nm irradiation. The adsorption removal of ETC by the Pt/TNFs is also presented in Fig. 6a. After 90 min, nearly 15% of ETC is removed by the adsorption of the Pt/TNFs. Although 15% of ETC removal is not high in this case, it must take into consideration that the Pt/TNFs on Ti sheet are static in aqueous ETC solution, remarkably reducing the diffusion rate of ETC molecules on TiO2 surface. In this work, the porous framework and large surface area of the Pt/TNFs can contribute to the enhanced adsorption of ETC onto catalyst surface.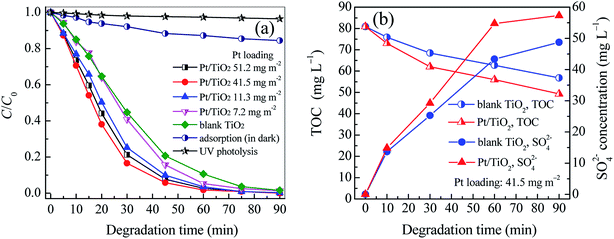 | ||
| Fig. 6 The changes of relative concentration of ETC (a) and of TOC and SO42− concentration (b) in the photocatalytic degradation of ETC collector by blank TiO2 and Pt/TiO2 nanobelt films. | ||
In this case, the degradation of ETC collector well follows the simplified Langmuir–Hinshelwood model, this is, ln(Ct/C0) = −kobst, where kobs (min−1) is the apparent first-order rate constant. All of correlation coefficients (R2) in Table S2 (ESI)† are above 0.985, revealing that the removal of ETC is mainly controlled by two factors of adsorption and degradation reactions. According to the fitting curves shown in Fig. S5,† it can be seen that the Pt/TNFs has higher photocatalytic activity in the ETC degradation than blank TNFs. At low Pt loadings, the kobs of Pt/TNFs increases with larger Pt loading. Especially, the kobs of the TNFs has increased by 94.98% at the Pt loading of 41.5 mg m−2. It clearly reveals that the Pt modification can remarkably improve the photocatalytic activity of TiO2 nanobelt films. The results in Table S2 (ESI)† also suggest that there is the optimum Pt loading (41.5 mg m−2) for the Pt/TNFs. As shown in Fig. S6,† the Pt/TNFs with PVA capping achieve higher kobs than that without PVA. It suggests that the PVA capping can inhibit the growth of Pt NPs on TiO2 surface in the electrostatic self-assembly, subsequently increasing the role of Pt NPs in reducing recombination rate of hole–electron pairs. In our previous study, the degradation rate constant of ETC by the ozonation was just 0.0194 min−1, much lower than that (0.0583 min−1) by the photocatalysis with the Pt/TNFs.35 As mentioned above, Chen et al.5 reported a primary biodegradation efficiency of 37% in 8 days for the ETC collector. However, the removal efficiency of 99.78% is achieved within 75 min by the photocatalysis given in Table S2 (ESI).† It can be seen that the photocatalysis using the Pt/TNFs can degrade refractory ETC collector effectively.
After the ETC collector is degraded, both the decrease of TOC and the increase of the SO42− concentration are achieved as shown in Fig. 6b. The results directly demonstrate that the ETC as well as its byproducts can be mineralized into H2O, CO2, SO42− and other inorganics. Compared to the TNFs, the Pt/TNFs achieve the lower TOC and higher concentration of SO42− ions, showing that the Pt modification of TNFs can also enhance the mineralization of ETC collector.
The photocatalytic stability of a catalyst is another key factor in the practical application. Fig. 7 shows the cycling stability of the Pt/TNFs toward ETC degradation. It can be seen that, over ten continuous cycles, the removal ratio of ETC is still above 95.83% at 90 min, revealing the little reduction of photocatalytic performance of the Pt/TNFs. In the cyclic experiments, no exfoliated TiO2 particles are observed in treated ETC solution after ten cycles' runs. It well demonstrates the excellent stability and sustainability of TiO2 nanobelts firmly grown on Ti sheet.
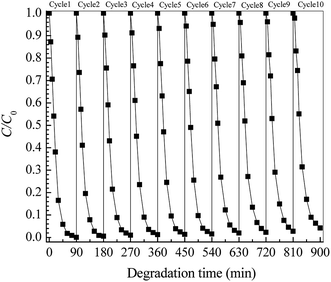 | ||
| Fig. 7 Cyclic degradation of ETC collector using Pt/TiO2 nanobelt films with Pt loading of 41.5 mg m−2. | ||
3.3 Byproduct identification by SPE/GC-MS
In this work, the SPE/GC-MS analysis is employed to identify organic byproducts generated in the ETC degradation. All the peaks with a response on mass spectrometry are marked in Fig. 8. Identified byproducts are summarized in Table 1. Moreover, the GC retention time and special characteristics of identified byproducts at 30 and 90 min are given in Tables S3 and S4 (ESI),† respectively. The mass spectrums of identified byproducts were shown in Fig. S7.†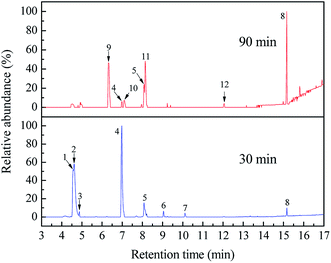 | ||
| Fig. 8 GC-MS total ion chromatograms of ETC collector degraded at 30 and 90 min by Pt/TiO2 nanobelt films. | ||
As shown in Fig. 8 and Table 1, eight byproducts, namely, 2,3-dihydroxy-2-methylpentanoic acid (peak 1), dimethylethoxyformamide (peak 2), L-valine methyl ester (peak 3), isopropyl carbamate (peak 4), acetamide (peak 5), 2,2′-dihydroxydipropyl ether (peak 6), succinimide (peak 7), diethyl phthalate (peak 8), are generated at 30 min in the photocatalytic degradation of ETC. According to the percentage of peak area summarized in Table S3 (ESI),† 2,3-dihydroxy-2-methylpentanoic acid, dimethylethoxyformamide and isopropyl carbamate are main byproducts at 30 min. When the degradation time is extended from 30 to 90 min, five peaks (peak 1, peak 2, peak 3, peak 6 and peak 7) disappear as shown in Fig. 8, revealing the complete degradation of these five byproducts. However, although 99.92% of ETC collector is degraded at 90 min, there are still seven byproducts detected by the SPE/GC-MS. It suggests that numerous byproducts will be remained in treated solution even 100% of ETC is degraded. The percentage of peak area of isopropyl carbamate reduces from 37.10% at 30 min to 1.92% at 90 min as given in Tables S3 and S4 (ESI).† It well demonstrates the further degradation of isopropyl carbamate. At 90 min, main byproducts become diethyl phthalate (peak 8), 2-isopropyl-5-methylcyclohexanol (peak 9) and 2-ethyl-6-methylpyridine (peak 11). As shown in Fig. 6b, the removal ratio of TOC is just 39.07% at 90 min in the degradation of ETC by the Pt/TNFs. The low TOC reduction is well consistent with the presence of remained byproducts after the ETC is completely degraded.
As seen in Table 1, eight byproducts with N atom are detected, but no byproduct with S atom appears. In addition, 57.32 mg L−1 of SO42− concentration in Fig. 6b reveals that 87.77% of S atom in ETC molecules is converted to SO42− ions at 90 min. As shown in Fig. S2,† the atomic ratio of S and N is 1![[thin space (1/6-em)]](https://www.rsc.org/images/entities/char_2009.gif) :
:![[thin space (1/6-em)]](https://www.rsc.org/images/entities/char_2009.gif) 1 for ETC molecule. Therefore, it can conclude that the S atom in the ETC can be more effectively oxidized than the N atom, resulting in the presence of some byproducts with N atom during the ETC degradation.
1 for ETC molecule. Therefore, it can conclude that the S atom in the ETC can be more effectively oxidized than the N atom, resulting in the presence of some byproducts with N atom during the ETC degradation.
3.4 Enhanced mechanism of ETC degradation by Pt modification
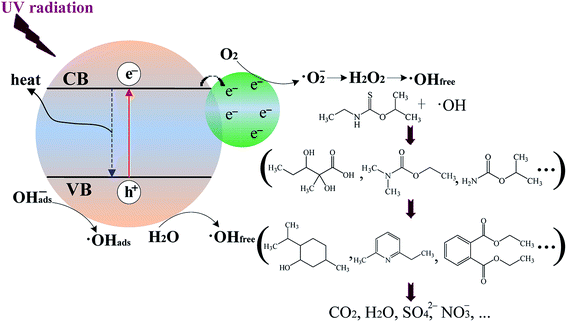
The excitation of TiO2 provokes the generation of an empty unfilled valence band (h+) and photoexcited electrons (e−) in the conduction band (eqn (1)). These charge carriers can react with surrounding oxygen-containing species, such as dissolved oxygen, adsorbed hydroxide ion (OHabs−) and H2O, to generate reactive oxygen species (ROS) (eqn (3)–(5)).45,46 Superoxide radicals (·O2−), hydroxyl radicals (·OHabs and ·OHfree) and valence band holes (h+) are the main reactive species involved in the photocatalytic reactions. Nevertheless, the rate of interfacial charge transfer to oxygen species is much lower than the rate of charge recombination of the catalyst (eqn (2)). Due to the formation of Schottky-barrier while TiO2 and metallic Pt are in contact, the electron–hole recombination rate can be remarkably reduced as metallic Pt can act as the electron trap.47–49 Moreover, the localized surface plasmon response effect associated with metallic Pt can increase the formation of electron–hole pairs in the TiO2.50,51 Thus, the deposition of metallic Pt on TiO2 can increase the photocatalytic activity.| Photoexcitation: TiO2 + hν → e− + h+ | (1) |
| Electron–hole recombination: e− + h+ → heat | (2) |
| Photoexcited e− scavenging: e− + O2 → ·O2− | (3) |
| Oxidation of hydroxyls: h+ + OHabs− → ·OHabs | (4) |
| Oxidation of H2O: h+ + H2O → ·OHfree | (5) |
Recently, Ribao et al.48 have found that the degradation of dichloroacetic acid (DCA) by blank TiO2 is achieved mainly via ·OH radicals generated with the positive holes (eqn (4) and (5)), while the degradation of DCA by Pt/TiO2 is mainly via ·OHfree radicals generated from the transformation of ·O2− radicals. Additionally, Pt/TiO2 can generate 60.6% more ·OH radicals than blank TiO2 because the former has a much larger amount of ·OHfree radicals converted from ·O2− radicals than the latter.48 As shown in Scheme 1, while metallic Pt is in contact with TiO2, photoexcited electrons (e−) can be readily trapped by metallic Pt with the generation of ·O2− radicals on Pt surface. Thus, Pt/TiO2 can produce a larger amount of ·O2− radicals than blank TiO2 since more photoexcited electrons is scavenged by oxygen. Previous studies have indicated that ·O2− radicals are critical in the formation of ·OHfree radicals through disproportionation to H2O2 (eqn (6)–(10)).52,53 Importantly, Hirakawa et al.52 has confirmed that the reaction of H2O2 with photoexcited electrons (eqn (9)) is the main contributor to the formation of ·OHfree radicals from H2O2. Therefore, it can reasonably infer that more ·O2− radicals can result in the generation of a larger amount of ·OHfree radicals. In this case, for the UV-illuminated Pt/TNFs, most of ·OH radicals may be generated from the transformation of ·O2− radicals which are produced by scavenging trapped electrons on metallic Pt with oxygen. Thus, for the UV-irradiated Pt/TNFs photocatalytic system, ·OH radicals generated from the transformation of ·O2− radicals (eqn (6)–(10)) as well as from the oxidation of OHabs− or H2O by positive holes (eqn (4) and (5)) are responsible for the degradation of ETC and its products. The Pt modification of TiO2 can offer another effective pathway to generate ·OH radicals in comparison to blank TiO2.
| ·O2− + H+ → ·HO2 | (6) |
| ·HO2 + ·HO2 → O2 + H2O2 | (7) |
| ·HO2 + H+ + e− → H2O2 | (8) |
| H2O2 + e− → ·OHfree + OH− | (9) |
| H2O2 + ·O2− → ·OHfree + OH− + O2 | (10) |
4. Conclusions
In this work, we have synthesized vertically aligned 2D TiO2 nanobelt films (TNFs) on Ti sheet via the alkaline hydrothermal method. Ultrafine Pt NPs are uniformly deposited on TiO2 nanobelts by the electrostatic self-assembly to produce Pt/TiO2 nanobelt films (Pt/TNFs). Pt NPs of ca. 5 nm are dispersed both on the surface and within the interior framework of the TNFs. Photocatalytic tests reveal that the Pt modification can remarkably increase the photocatalytic activity of the TNFs toward the ETC degradation, as well as achieve the enhanced mineralization of ETC. The deposition of Pt on TiO2 nanobelts can increase the separation and transfer efficiency of photoexcited carriers. Importantly, the superior mechanical adherence of Pt/TiO2 nanobelts on Ti sheet is well reserved for achieving excellent cyclic performance during the ETC degradation. The SPE/GC-MS analysis reveals that seven byproducts are still remained in treated ETC solution even 100% of ETC collector is degraded. Eight byproducts with N atom are detected while no byproduct with S atom appears, revealing that the mineralization of N atom in ETC collector is more difficult than S atom. The vertically aligned Pt/TiO2 nanobelt films on Ti sheet are qualified to serve as the promising and potential photocatalyst to remove refractory ETC collector from mineral flotation wastewaters.Conflicts of interest
There are no conflicts to declare.Acknowledgements
This work was financially supported by the National Natural Science Foundation of China (Grant No: 51674017). The authors would greatly appreciate the Experiment Center in School of Metallurgical and Ecological Engineering, University of Science and Technology Beijing for providing the SPE/GC-MS analysis.References
- S. M. Bulatovic, Handbook of Flotation Reagents: Chemistry, Theory and Practice: Flotation of Sulfide ores, Elsevier Science, 2007 Search PubMed.
- D. R. Nagaraj and R. S. Farinato, Miner. Eng., 2016, 96–97(SI), 2–14 CrossRef CAS.
- M. Kalin, Ecol. Eng., 2004, 22, 299–304 CrossRef.
- K. Singh, C. Oates, J. Plant and N. Voulvoulis, Environ. Int., 2014, 68, 1–15 CrossRef CAS PubMed.
- S. H. Chen, W. Q. Gong, G. J. Mei, Q. Zhou, C. P. Bai and N. Xu, Miner. Eng., 2011, 24, 953–955 CrossRef CAS.
- S. H. Chen, W. Q. Gong, G. J. Mei and W. Y. Han, Bioresour. Technol., 2011, 102, 10772–10775 CrossRef CAS PubMed.
- R. Rezaei, M. Massinaei and A. Z. Moghaddam, Miner. Eng., 2018, 119, 1–10 CrossRef CAS.
- S. Al-Thyabat and H. Al-Zoubi, Int. J. Miner. Process., 2012, 110, 18–24 CrossRef.
- P. F. Fu, Y. H. Ma, H. F. Yang, G. Li and X. F. Lin, RSC Adv., 2019, 9, 23579–23588 RSC.
- Y. Yang, Y. Li, Y. M. Zhang and D. W. Liang, Sep. Purif. Technol., 2010, 76, 72–78 CrossRef CAS.
- K. X. Cui, Y. H. He and S. M. Jin, Chemosphere, 2016, 149, 245–253 CrossRef CAS PubMed.
- Y. J. Guo, K. X. Cui, M. Y. Hu and S. M. Jin, Chemosphere, 2017, 181, 190–196 CrossRef CAS PubMed.
- X. P. Luo, S. P. Zhu, J. Y. Wang, C. Y. Wang and M. Wu, Int. J. Environ. Res. Public Health, 2017, 14(12), 1471 CrossRef PubMed.
- K. Nakata and A. Fujishima, J. Photochem. Photobiol., C, 2012, 13, 169–189 CrossRef CAS.
- M. T. Noman, M. A. Ashraf and A. Ali, Environ. Sci. Pollut. Res., 2019, 26, 3262–3291 CrossRef CAS PubMed.
- M. X. Wang, Q. Gao, H. Duan and M. Q. Ge, RSC Adv., 2019, 9, 23735–23743 RSC.
- J. R. Jennings, A. Ghicov, L. M. Peter, P. Schmuki and A. B. Walker, J. Am. Chem. Soc., 2008, 130, 13364–13372 CrossRef CAS PubMed.
- T. Tachikawa and T. Majima, J. Am. Chem. Soc., 2009, 131, 8485–8495 CrossRef CAS PubMed.
- O. Nasr, O. Mohamed, A. Al-Shirbini and A. M. Abdel-Wahab, J. Photochem. Photobiol., A, 2019, 374, 185–193 CrossRef CAS.
- T. M. David, P. Wilson, R. Mahesh, S. Dhanavel, S. Hussain, S. J. M. Boby, A. Stephen, C. Ramesh and P. Sagayaraj, Environ. Technol., 2018, 39, 2994–3005 CrossRef PubMed.
- N. Lakshmanareddy, V. N. Rao, K. K. Cheralathan, E. P. Subramaniam and M. V. Shankar, J. Colloid Interface Sci., 2019, 538, 83–98 CrossRef CAS PubMed.
- D. Zhang, B. H. Wang, J. Q. Wang, H. M. Wang, S. X. Zhang and D. Gu, RSC Adv., 2019, 9, 2784–2791 RSC.
- Z. L. Yang, J. Lu, W. C. Ye, C. S. Yu and Y. L. Chang, Appl. Surf. Sci., 2017, 392, 472–480 CrossRef CAS.
- C. H. Nguyen and R. S. Juang, J. Taiwan Inst. Chem. Eng., 2019, 99, 166–179 CrossRef CAS.
- F. Y. Ma, Z. Geng, X. Yang and J. Y. Leng, RSC Adv., 2015, 5, 46677–46685 RSC.
- Z. Zhang, X. L. Li, R. S. Zhang, Z. M. Zhang and J. L. Yu, Inorg. Chem., 2019, 58, 7303–7309 CrossRef CAS PubMed.
- B. E. Sanabria-Arenas, A. Mazare, J. Yoo, N. T. Nguyen, S. Hejazi, H. D. Bian, M. V. Diamanti, M. P. Pedeferri and P. Schmuki, Electrochim. Acta, 2018, 292, 865–870 CrossRef CAS.
- P. F. Fu and P. Y. Zhang, Appl. Catal., B, 2010, 96, 176–184 CrossRef CAS.
- P. F. Fu and P. Y. Zhang, Thin Solid Films, 2011, 519, 3480–3486 CrossRef CAS.
- C. L. Zhou, Y. F. Li, H. J. Li, X. J. Zeng, P. H. Pi, X. F. Wen, S. P. Xu and J. Cheng, Surf. Coat. Technol., 2017, 313, 55–62 CrossRef CAS.
- Y. Wang, Z. Li, Y. Cao, F. Li, W. Zhao, X. Q. Liu and J. B. Yang, J. Alloys Compd., 2016, 677, 294–301 CrossRef CAS.
- X. L. Zhang, Q. Y. Liu, B. D. Liu, W. J. Yang, J. Li, P. J. Niu and X. Jiang, J. Mater. Chem. C, 2017, 5, 4319–4326 RSC.
- Y. Jia, K. H. Huang, S. Wang, Z. F. Cao and H. Zhong, Miner. Eng., 2019, 137, 187–199 CrossRef CAS.
- Y. J. Bu, Y. H. Hu, W. Sun, Z. Y. Gao and R. Q. Liu, Minerals, 2018, 8, 115 CrossRef.
- P. F. Fu, X. F. Lin, G. Li, Z. H. Chen and H. Peng, Minerals, 2018, 8, 477 CrossRef CAS.
- Z. Wei, C. J. Hsu, H. Almakrami, G. Z. Lin, J. Hu, X. F. Jin, E. Agar and F. Q. Liu, Electrochim. Acta, 2019, 316, 173–180 CrossRef CAS.
- M. Bowker, D. James, P. Stone, R. Bennett, N. Perkins, L. Millard, J. Greaves and A. Dickinson, J. Catal., 2003, 217, 427–433 CrossRef CAS.
- D. Z. Lu, K. K. Kondamaredd, H. Q. Fan, B. Gao, J. Wang, J. Wang and H. J. Hao, Sep. Purif. Technol., 2019, 210, 775–785 CrossRef CAS.
- R. Yoshida, Y. Suzuki and S. Yoshikawa, J. Solid State Chem., 2005, 178, 2179–2185 CrossRef CAS.
- A. R. Armstrong, G. Armstrong, J. Canales and P. G. Bruce, Angew. Chem., Int. Ed., 2004, 43, 2286–2288 CrossRef CAS PubMed.
- K. R. Rasmi, S. C. Vanithakumari, R. P. George, C. Mallika and U. K. Mudali, RSC Adv., 2015, 5, 107192–108066 RSC.
- R. Feng, M. Li and J. Liu, Colloids Surf., A, 2012, 406, 6–12 CrossRef CAS.
- P. Bera, K. R. Priolkar, A. Gayen, P. R. Sarode, M. S. Hegde, S. Emura, R. Kumashiro, V. Jayaram and G. N. Subbanna, Chem. Mater., 2003, 15, 2049–2060 CrossRef CAS.
- J. B. Zhang, N. Su, X. L. Hu, F. Q. Zhu, Y. W. Yu and H. Yang, RSC Adv., 2017, 7, 56194–56203 RSC.
- M. N. Chong, B. Jin, C. W. K. Chow and C. Saint, Water Res., 2010, 44, 2997–3027 CrossRef CAS PubMed.
- J. Schneider, M. Matsuoka, M. Takeuchi, J. L. Zhang, Y. Horiuchi, M. Anpo and D. W. Bahnemann, Chem. Rev., 2014, 114, 9919–9986 CrossRef CAS PubMed.
- H. Q. Wang, Z. B. Wu, Y. Liu and Y. J. Wang, Chemosphere, 2008, 74, 773–778 CrossRef PubMed.
- P. Ribao, J. Corredor, M. J. Rivero and I. Ortiz, J. Hazard. Mater., 2018, 372, 45–51 CrossRef PubMed.
- J. J. Lin, T. Sun, M. B. Li, J. X. Yang, J. N. Shen, Z. Z. Zhang, Y. Wang, X. Y. Zhang and X. X. Wang, J. Catal., 2019, 372, 8–18 CrossRef CAS.
- A. Ziylan-Yavas, Y. Mizukoshi, Y. Maeda and N. H. Ince, Appl. Catal., B, 2015, 172–173, 7–17 CrossRef CAS.
- A. Ziylan-Yavas and N. H. Ince, Chemosphere, 2016, 162, 324–332 CrossRef CAS PubMed.
- T. Hirakawa, K. Yawata and Y. Nosaka, Appl. Catal., A, 2007, 325, 105–111 CrossRef CAS.
- K. Sahel, L. Elsellami, I. Mirali, F. Dappozze, M. Bouhent and C. Guillard, Appl. Catal., B, 2016, 188, 106–112 CrossRef CAS.
Footnote |
| † Electronic supplementary information (ESI) available. See DOI: 10.1039/c9ra07704a |
| This journal is © The Royal Society of Chemistry 2019 |

