 Open Access Article
A colorimetric nanoprobe based on enzyme-immobilized silver nanoparticles for the efficient detection of cholesterol
Lakshita Dewangana,
Jyoti Korrama,
Indrapal Karbhala,
Rekha Nagwanshib,
Vinod K. Jenac and
Manmohan L. Satnami *a
*a
aSchool of Studies in Chemistry, Pt. Ravishankar Shukla University, Raipur, C.G., India-492010. E-mail: manmohanchem@gmail.com
bDepartment of Chemistry, Govt. Madhav Science P. G. College, Ujjain, M.P., India-456010
cDepartment of Chemistry, Govt. Nagarjuna P. G. College of Science, Raipur, C.G., India-492010
First published on 18th December 2019
Abstract
A large number of cardiovascular diseases have recently become of serious concern throughout the world. Herein, we developed a colorimetric probe based on functionalized silver nanoparticles (AgNPs) for the efficient sensing of cholesterol, an important cardiovascular risk marker. A simple sodium borohydride reduction method was employed to synthesize the AgNPs. The cholesterol oxidase (ChOx)-immobilized AgNPs interact with free cholesterol to produce H2O2 in proportion to the concentration of cholesterol, resulting in decreased AgNP absorbance (turn-off) at 400 nm due to electron transfer between the AgNPs and H2O2. The response of the sensor can also be observed visually. The absorption intensity of the AgNPs is recovered (turn-on) upon the addition of sodium dodecyl sulfate due to the inhibition of ChOx. This on–off mechanism was effectively applied to detect cholesterol within the concentration range 10–250 nM with a low detection limit of approximately 0.014 nM. Moreover, the selectivity of the sensor toward cholesterol was analyzed in the presence of a range of interfering organic substances such as glucose, urea, and sucrose. Finally, the potential of the proposed sensor was evaluated using real samples.
1. Introduction
Cholesterol is an important component of cell membranes that is transported via blood plasma in mammals. Abnormal levels of cholesterol can lead to atherosclerosis, hypertension, stroke, and other issues. Furthermore, high levels of cholesterol in the blood and body tissues have perilous effects such as coronary heart and peripheral arterial diseases, diabetes, hypertension, cardiac arrest, and anemia.1–4 Therefore, in medical diagnostics and therapeutics, the accurate monitoring of cholesterol levels in blood plasma is important.1,5–7 Recently, hypercholesterolemia has been identified as the main reason for human death. Thus, controlling blood cholesterol level has become a global challenge. Most cholesterol biosensors involve the enzymatic oxidation of cholesterol by cholesterol oxidase (ChOx).1,5 Consequently, the production of hydrogen peroxide (H2O2) is quantified by various procedures.8–14 Low levels of cholesterol may be associated with medical conditions such as cancer, depression, anxiety, hopelessness, nervousness, confusion, agitation, and hypocholesterolemia. Total cholesterol levels below 160 mg dL−1 are classified as hypocholesterolemia. Therefore, it is essential to detect both high and low levels of cholesterol.15Various methods such as electrochemical sensing16–22 fluorometric analysis,23–25 chromatographic analysis,26–28 molecular imprinting,29 surface plasmon resonance,30 field-effect transistor sensors,31 chemiluminescence,32 and colorimetric methods33,34 have been reported to detect cholesterol and H2O2. Among these methods, colorimetric detection is of great interest due to its simplicity, low cost, high sensitivity, and good selectivity.14,35–38 H2O2 is generated during the catalytic oxidation of substrates by ChOx, glucose oxidase, and xanthine oxidase, among others. Therefore, the accurate determination of H2O2 is useful for indirectly measuring the levels of target molecules such as glucose, cholesterol, and xanthine. Recently, Zhang et al.39 reported a MXene-Ti3C2/CuS nanocomposite for the colorimetric determination of cholesterol with a linear range of 10–100 μM and a limit of detection (LOD) of 1.9 μM. Li et al.40 developed a Förster resonance energy transfer-based sensor for the determination of cholesterol. They obtained a linear range of 10–210 μM L−1 with a LOD of 343.48 nM L−1. Cholesterol was also detected using an electrochemical technique with a LOD of 0.03 μM and a linear range of 0.06–15 μM.41 The sensor developed in this study improves upon the above detection methods in terms of its cost-effectiveness, low limit of detection (∼0.014 nM), and linearity in the cholesterol concentration range of 10–250 nM.
In this study, a biosensing probe was developed for the determination of cholesterol based on the immobilization of ChOx on modified silver nanoparticles (AgNPs), which enhance the peroxidase-like catalytic activity. ChOx specifically catalyzes the oxidation of cholesterol to produce H2O2 in the presence of oxygen. Hence, the AgNPs (Ag0) are oxidized to Ag+ by H2O2. As a result, the absorbance of the AgNPs at 400 nm decreases, resulting in a distinct color change from yellow to colorless. In the presence of different concentrations of cholesterol, the etching of AgNPs by H2O2 and corresponding decrease in absorption intensity were exploited for the determination of cholesterol. The developed method has some advantages over existing methods because no additional chromogenic agent is necessary as a dye. The developed method also shows high sensitivity based on the high molar extinction coefficient of AgNPs, is easy to implement, allows rapid detection with the naked eye, and can be applied to complex samples. The amount of released Ag+ is low because the concentration of AgNPs used is low (0.2 nM). In the human body, Ag+ is commonly present in the bloodstream (<2.3 b. μg L−1) and key tissues such as the liver and kidney without any association with disease or disability. Therefore, the oxidative Ag+ concentration in the proposed method is negligible. For colorimetric sensors based on metallic nanoparticles, the optical properties are mainly determined by surface plasmon resonance. The optical responses of the nanoparticles depend on the nanoparticle size, shape, geometry, and environment.42 AgNPs show good optical performance, as expected given their extremely high dielectric constant or polarizability. AgNPs have high optical radiation efficiency. As the particle size increases, the re-radiation of energy from the AgNPs to the surrounding medium is expected to become dominant.43 The spherical AgNPs with diameters of approximately 13–15 nm showed maximum absorbance at 400 nm, indicating good agreement between the optical properties (surface plasmon resonance), AgNP geometry, and the polarization of incident light.44 We also studied the inhibition of ChOx using a logic gate, validating the developed method. The anionic surfactant sodium dodecyl sulfate (SDS) was used as an inhibitor with a maximum inhibition of approximately 90%. The developed method was successfully applied in the detection of free cholesterol in bovine serum albumin (BSA) and milk. Cholesterol could be efficiently detected by the naked eye without the need for any specialized instruments.
2. Experimental
2.1 Materials and reagents
Cholesterol, 1-ethyl-3-(3-dimethylaminopropyl)carbodiimide hydrochloride (EDC), N-hydroxysuccinimide (NHS), ChOx, silver nitrate (AgNO3), H2O2, trisodium citrate, sodium hydroxide, sodium borohydride (NaBH4), and sodium phosphate (dibasic) were purchased from Sigma-Aldrich (Bangalore, India). All experiments were performed using Milli-Q ultrapure water, and the reagents used were of analytical grade. All glassware was rinsed in aqua regia prior to use.2.2 Instrumental details
All optical experiments were performed using a Thermoscientific Evolution 300 spectrophotometer. The Fourier-transform infrared (FTIR) spectroscopy was conducted using a Nicolet iS10 FTIR spectrometer (Thermofisher) with KBr pellets to identify the functional groups of the AgNPs and ChOx-conjugated AgNPs. The AgNP morphology was investigated by transmission electron microscopy (TEM; JEOL, JEM-2100F) with an accelerating voltage of 200 kV.2.3 Preparation of cholesterol solution
The cholesterol catalytic reaction was carried out by adding different concentrations of cholesterol (10–250 nM) dissolved in 0.1 μL Triton X followed by mild heating to dissolve the cholesterol. After the complete dissolution of cholesterol, 0.1 mol L−1 phosphate buffer solution (pH 7.5) was added. The prepared cholesterol solutions were further used for enzymatic assay.2.4 Synthesis of AgNPs
AgNPs were synthesized by Martin's method.45 Briefly, trisodium citrate (0.25 mM) was added to 100 mL of an aqueous solution of AgNO3 (0.25 mM). After 3 min, different concentrations of NaBH4 were added; the NaBH4 concentration of 9.5 mM was determined to be optimal for AgNP formation. The colorless solution became yellow when the AgNPs were formed. Citrate was used as a stabilizing agent to prevent the aggregation of Ag atoms.2.5 Functionalization of AgNPs and colorimetric sensing of cholesterol
AgNPs were reacted with a mixture of freshly prepared sulfo-NHS (0.1 mM) and EDC solution (0.4 mM) for 30 min to induce the coupling reaction. Sulfo-NHS-terminated AgNPs were isolated by centrifugation and re-dispersed in phosphate-buffered saline (PBS; 0.1 M, pH 7.5). Subsequently, a working solution (1.67 μL EDC) and 6.67 μL sulfo-NHS were added into an aqueous solution of AgNPs (25 mL). The solution was kept at room temperature for 24 h. After synthesis, the AgNPs were first functionalized with EDC/NHS46 and then immobilized with ChOx. Upon the addition of cholesterol, cholestenone and H2O2 are produced, which react with the AgNPs, as shown schematically in Fig. 1. As a result, the color of the solution changes from yellow to colorless due to the oxidation of Ag0 in the AgNPs to Ag+ by accepting electrons from H2O2. The changes in absorbance at 400 nm were measured at 37 °C.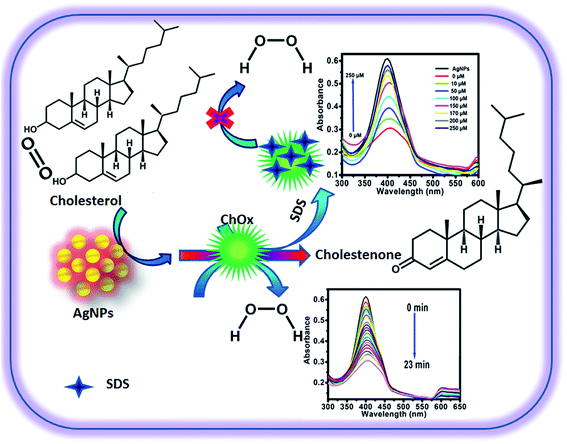 | ||
| Fig. 1 Mechanism of the production of H2O2 by AgNPs immobilized with ChOx in the presence of cholesterol and the optical response of the nanoprobe. | ||
2.6 Analysis of cholesterol in real samples
Milk and BSA were dissolved separately in 5 mL of KOH/ethanol solution and saponified in a water bath for 1 h. Next, 5 mL water and 10 mL n-hexane were added into the sample solution, and the mixture was centrifuged at 5000 rpm for 5 min. Finally, the n-hexane was separated, and the solvent was evaporated under a stream of nitrogen. The residue was re-dissolved with the previously mentioned mixture of isopropanol and Triton X-100. The diluted samples and ChOx (3.0 mU) in phosphate buffer were then incubated at 37 °C for 1.5 h. The mixture of AgNPs, cholesterol (250 nM), and phosphate buffer was then added to the above reaction solution, and the ultraviolet (UV)-visible spectra were recorded.2.7 Selectivity of the nanoprobe
The selectivity of the sensor toward cholesterol was investigated in the presence of interfering bioanalytes including ascorbic acid, urea, glucose, galactose, and L-cysteine. The UV-visible spectra of the AgNPs immobilized with ChOx (3.0 mU) were recorded in presence of these biomolecules under similar experimental conditions. The conditions and interfering analyte concentrations were the same as those of cholesterol (concentration = 250 nM). The solutions were incubated at 37 °C for 1 h. If an analyte possessed an interfering effect, it would enhance the absorption intensity. Thus, recording the absorption intensities of the probe in the presence of biomolecules and cholesterol reveals the selectivity of the sensing platform.3. Results and discussion
3.1 Structural and morphological analyses of functionalized AgNPs
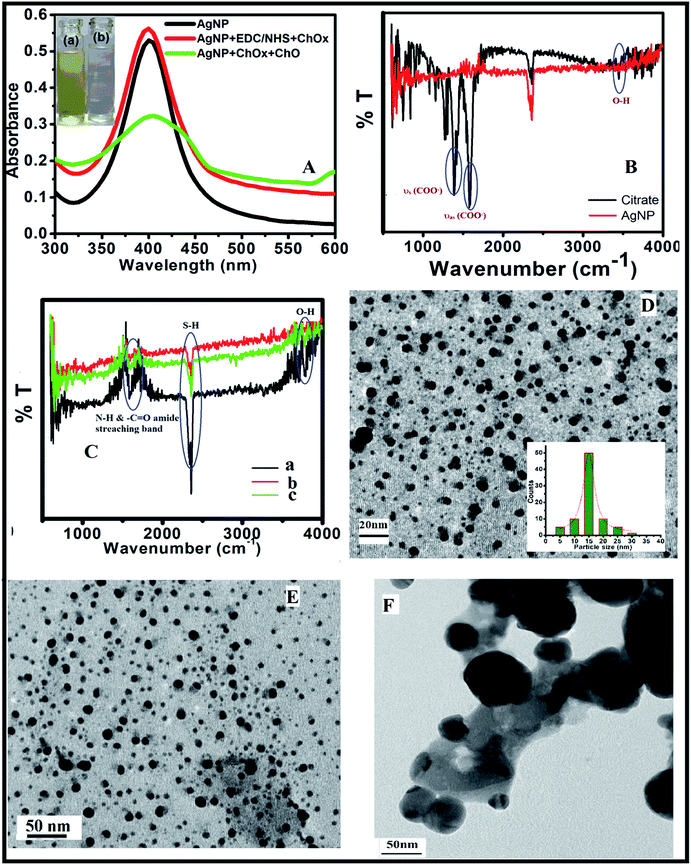
AgNPs were obtained via a simple reduction method and then characterized by the UV-visible spectrophotometry, TEM, and FTIR spectroscopy. Fig. 2A shows the UV-visible absorption spectra of AgNPs with surface modification. The maximum absorbance of the AgNPs occurred at 400 nm, and the density was 2.21 × 10⁻¹³ mol cm−3 (Fig. 2A). No major changes in absorbance were observed when EDC/NHS and ChOx were added to the AgNPs solution (Fig. 2A). After the addition of EDC/NHS, the stability or dispersion of the AgNPs was enhanced. In the presence of ChOx, the surface plasmon resonance absorbance at 400 nm decreased due to the formation of H2O2, which induced the oxidation of AgNPs from Ag0 to Ag+ (surface etching), and the color changed from yellow to colorless (Fig. 2A). The photographs of the corresponding solutions are shown in the inset of Fig. 2A.The FTIR spectra were measured to analyze the surface structure and surface modification of the AgNPs (Fig. 2B and C). The FTIR spectrum of trisodium citrate on AgNPs exhibited νas (COO−) and νs (COO−) stretching bands at 1585 and 1382 cm−1, respectively. The typical signals of EDC/NHS were also observed at around 3420 and 1560 cm−1; these peaks are assigned to –OH and –COOH, which are required for the immobilization of enzymes. The surface modification of AgNPs with ChOx was confirmed by the characteristic FTIR bands of –C![[double bond, length as m-dash]](https://www.rsc.org/images/entities/char_e001.gif) O (amide I) and –N–H (amide II) at 1650 and 1550 cm−1, respectively (Fig. 2C).
O (amide I) and –N–H (amide II) at 1650 and 1550 cm−1, respectively (Fig. 2C).
The size of the nanomaterial plays an important role in sensing. Spherically shaped AgNPs with sizes of 10–20 nm show higher sensitivity than the bulk material due to their large surface-to-volume ratios. In general, the sensing behavior of AgNPs changes with the particle size, and the surface plasmon resonance and scattering of light depend upon the nanoparticle size. Due to the size of the AgNPs being smaller than the wavelength of the incident light and because of their large surface area, electrons from the conduction band of the AgNPs are easily ejected to generate secondary electrons. The monodispersed and spherically shaped functionalized AgNPs with an average diameter of 13–15 nm were characterized by TEM (Fig. 2D). No obvious changes in AgNP size were observed after immobilization with ChOx (Fig. 2E). Fig. 2F shows a TEM image of agglomerated AgNPs with larger sizes of approximately 150 nm; this is attributed to the production of H2O2 by the catalytic reaction of cholesterol with immobilized enzyme on the AgNP surfaces.
The synthesized AgNPs were generally surrounded by negatively charged molecules. The –OH groups on the surfaces of the AgNPs can be covalently conjugated with any molecules containing –COOH groups via EDC/NHS coupling reaction.47 The EDC molecule activates the –COO− functional group to form ester linkages with –OH groups. EDC can also form amide couplings (CONH). Hence, EDC induces the binding of the enzyme (ChOx) on the surfaces of the modified AgNPs. The –COOH groups on the AgNPs are activated by EDC/NHS. This is a well-known technique to conjugate carboxyl groups with amine groups in enzymes. A possible mechanism for the conjugation of EDC/NHS and immobilization of ChOx is shown in Fig. 3.
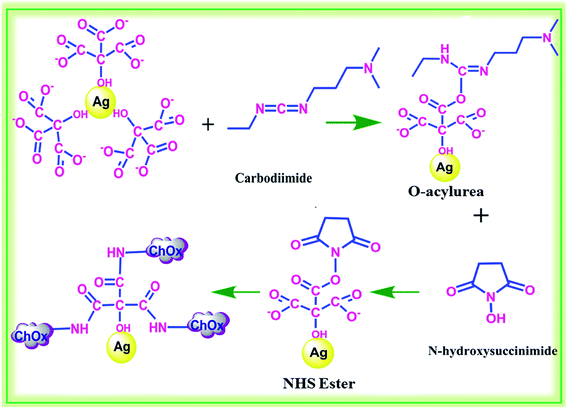 | ||
| Fig. 3 Activation of functional groups on the surfaces of AgNPs using EDC/NHS and conjugation with ChOx. | ||
3.2 Effect of H2O2 concentration
The dissolution of citrate-coated AgNPs by H2O2 appears to be efficient, even at low H2O2 concentrations. The general reaction between AgNPs with H2O2 is given as follows:| Ag0 + H2O2 → Ag+ + O2− + 2H2O | (1) |
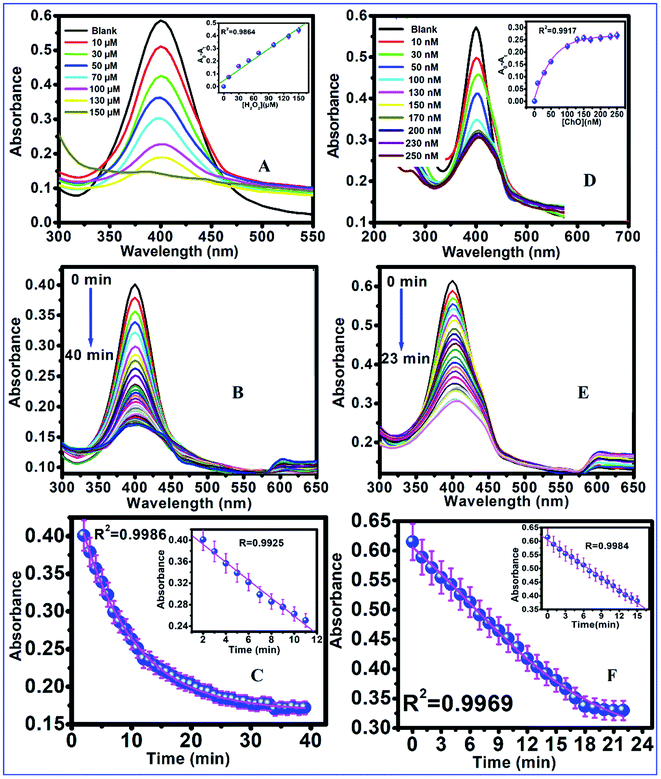
Ag0 is expected to be dissolved by H2O2 due to the catalytic reaction involving the production of radicals and oxygen, as oxygen was excluded under the experimental conditions. The intermediates may include hydroxyl radicals (OH−) with very short lifetimes. The decomposition of H2O2 upon contact with AgNPs was followed over time. The results showed that H2O2 in the concentration range of 10–150 μM was consumed within approximately 40 min in the presence of 0.02 nM AgNPs. The pH dependence of this reaction was observed by the rapid decomposition under alkaline pH and slower reaction rate under acidic pH. The produced superoxide anion O2 can further react with AgNPs and Ag+ to again form AgNPs or recombine to form H2O2. Therefore, after an increase in H2O2 concentration, the absorption intensity of the AgNPs decreased (Fig. 4A) with good linearity over the concentration range (inset of Fig. 4A). This can be attributed to the formation of dissolved Ag+ in proportion to the amount of added H2O2. Similarly, Fig. 4B depicts the decrease in the absorbance of AgNPs with reaction time in the presence of 150 μM H2O2. According to He et al.,48–50 AgNPs accept electrons from O2˙− to form highly reactive “charged” nanoparticles that induce the reduction of both oxygen and Ag+, resulting in the reformation of AgNPs. The in situ-formed AgNPs following the electron transfer from charged AgNPs to Ag+ may either result in the formation of larger particles or more particles (increased density). An increase in particle size would be expected to induce a redshift in the AgNP peak (Fig. 4), while an increase in particle number would be expected to result in an increase in absorbance.
3.3 Cholesterol sensing assay
The detection capability of the proposed sensor was evaluated for H2O2 and cholesterol under the optimum conditions (Fig. 4D). The absorbance of the AgNPs gradually decreased with increasing H2O2 concentration from 10 to 150 μM. The absorbance vs. the H2O2 concentration is plotted in the inset of Fig. 4A, showing a good linear relationship (R = 0.9867) in the concentration range of 10–150 μM. Similarly, as shown in Fig. 4B, absorbance decreased gradually with time when the H2O2 concentration was 150 μM. ChOx is commonly used in cholesterol detection. ChOx can catalyze the oxidation of cholesterol in the presence of oxygen to produce H2O2. The enzyme-catalyzed reaction is described by eqn (2):
 | (2) |
Subsequently, the produced H2O2 can act as a mediator to construct an oxidase-based sensor. As shown in Fig. 4D, the absorbance of the AgNPs decreased gradually with increasing cholesterol concentration. The detection limit for cholesterol was as low as 0.0149 nM. The absorption of the AgNPs gradually decreased with time from 0–23 min when the cholesterol concentration was 250 nM. The plot of absorbance vs. time showed a good linear correlation (R = 0.9925; insets of Fig. 4E and F). To better understand the performance of the proposed method, the developed cholesterol sensing system was compared with some previous methods (Table 1). The detection limit of our method was better than those of previously reported methods. Some studies found that the sensitivity could be increased by using smaller nanoparticles with maximum surface area. The AgNPs used in this study (sizes of 15–20 nm) showed good reactivity due to their large surface areas; however, the presence of cholesterol produced H2O2, and the AgNP particle size increased due to particle aggregation.
| S. No. | Method | Cholesterol sensor | Linear range | LOD | Reference |
|---|---|---|---|---|---|
| 1 | Colorimetric | MXene-Ti3C2/CuS nanocomposites | 10–100 μM | 1.9 μM | 40 |
| 2 | Colorimetric | ChOx-PB/MWCNT | 4–100 μM | 3.01 μM | 14 |
| 3 | Colorimetric | CuO graphene nanospheres | 0.1–0.8 mM | 78 μM | 52 |
| 4 | Fluorescence | Ag nanocluster-decorated MoS2 nanosheets | 0.06–15 μM | 0.03 μM | 41 |
| 5 | Fluorescence | Au@CQD | 1–6.25 mM | 2.5 μM | 9 |
| 6 | Electrochemical | CuO nanoparticles | 1–15 μM | 0.43 μM | 51 |
| 7 | Colorimetric | AgNPs | 1–6.5 nM | 0.0149 nM | Present method |
3.4 Inhibition of enzyme
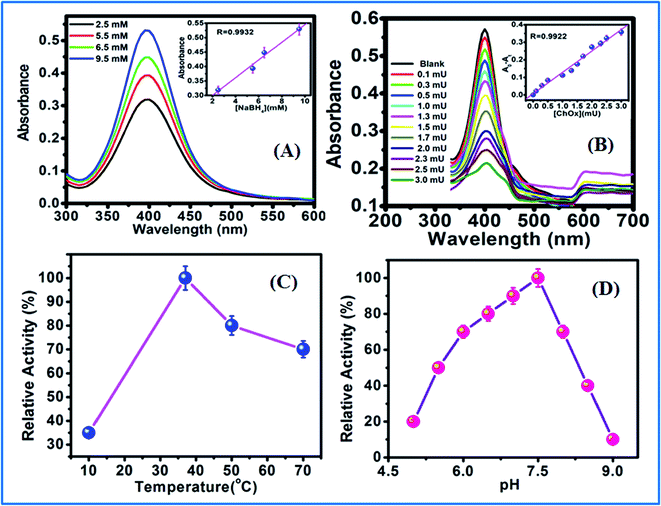
The activity of ChOx from Streptomyces was studied in the presence of SDS using AgNPs as an assay. The optical absorption spectra (Fig. 4 and 5) show the formation of AgNPs with a single narrow surface plasmon located at 400 nm, which is characteristics of spherically shaped nanoparticles with diameters of 15–20 nm. The addition of H2O2 reduced the peak intensity, which is attributed to the reduction in the free electron density of Ag due to the possible oxidation of AgNPs. The addition of SDS denatured the enzyme; hence, the production of H2O2 was arrested, and the oxidation of AgNPs to Ag+ was interrupted. The intensity of the absorption peak of the AgNPs increased with increasing SDS concentration.53The enzyme was fully inactivated in the presence of SDS. The effect of SDS was analyzed by incubating ChOx with various concentrations of SDS (10–250 μM) for 60 min at 37 °C. Functionalized AgNPs immobilized with inhibited ChOx (3.0 mU) were added into a cholesterol solution. H2O2 was not produced to cause the aggregation of AgNPs. Incubated enzyme solution was used to determine the residual enzyme activity in comparison to the enzyme activity without incubation with SDS. When the SDS concentration increased, the absorption intensity of the AgNPs also increased (Fig. 5A) with a good linear range (Fig. 5B). The enzyme activity was highest in Triton X-100 (>80%); however the presence of only 0.1% SDS fully inactivated the enzyme. SDS is used in cosmetics and toothpastes; therefore, there are many sources of SDS to enter the human body. SDS is an anionic detergent that denatures native proteins by disturbing the noncovalent forces. These forces include hydrogen bonding, hydrophobic interactions, and ionic interactions, which are responsible for the three-dimensional structures of the native proteins.
3.5 Implementation of a logic system
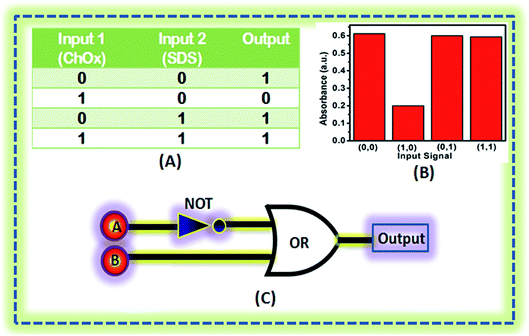
Aqueous solutions of ChOx immobilized on AgNPs in the presence of cholesterol and AgNPs immobilized with ChOx and cholesterol in presence of SDS can be used to construct an absorbance-based logic system. For logic gate implementation, the combination of AgNPs and cholesterol is considered as the system, while ChOx and SDS are the two inputs. The output ‘1’ is obtained for the AgNPs when the input is (0,0), corresponding to the absence of ChOx and SDS. The addition ChOx but not SDS is the input (1,0), which gives output ‘0’. When SDS is present but ChOx is absent, the input is (0,1), and the output ‘1’ is obtained. When both ChOx and SDS are present, the input is (1,1), and the output ‘1’ is obtained. Fig. 6A shows the truth table followed by the logic system. Fig. 6B depicts the absorbance intensity for different input signals, and the correspond logic symbol is shown in Fig. 6C.3.6 Kinetic properties of immobilized ChOx
The Michaelis–Menten and Lineweaver–Burk plots were constructed (Fig. 7) to study the kinetics of immobilized ChOx at pH 7.5, a temperature of 37 °C, and various substrate concentrations. Km is parametric statistic that describes the affinity between the enzyme and substrate in an enzymatic reaction. A lower Km value corresponds to a higher affinity between the enzyme with substrate, indicating biocompatibility and facilitating the enzymatic reaction. Vmax is the maximum rate of enzymatic reaction when the enzyme is saturated with substrate. The value of Km is calculated from the intercept and slope of the Lineweaver–Burk plot. The changes in absorbance with time were plotted as a function of cholesterol concentration. A decrease in Km indicates a faster reaction rate, whereas an increase in Km suggests that a larger substrate concentration is required to achieve the same reaction rate observed for the free enzyme. The Michaelis–Menten constant Km for cholesterol was determined to be 196.07 nM, indicating the intensive enzyme activity of ChOx-immobilized AgNPs. The catalytic efficiency (Vmax/Km) of the nanobioconjugate was higher than that of the free enzyme, largely due to the lower Km of the immobilized enzyme. Generally, the kinetic parameters (Km and Vmax) of an enzyme change after immobilization, indicating a change in affinity for the substrate.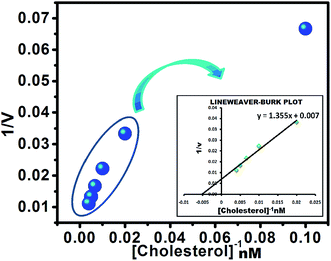 | ||
| Fig. 7 The Lineweaver–Burk plot for the determination of the enzymatic activity of functionalized AgNPs immobilized with ChOx. | ||
The rate of H2O2 production increased with increasing cholesterol concentration. Since H2O2 is the basic quenching unit in this assay, the extent of absorption quenching essentially represents the variation in the enzymatic activity of ChOx. The enzyme/substrate kinetics can be assessed by the Michaelis–Menten kinetic parameters Km and Vmax. The value of Km reflects the affinity of the enzyme for the substrate and does not depend on the enzyme concentration, whereas Vmax defines the maximum rate of the enzymatic reaction. The effect of the substrate concentration on the reaction rate catalyzed by immobilized ChOx was studied using different initial concentrations of cholesterol. The enzyme/substrate kinetic parameters were calculated from the Lineweaver–Burk plot as follows:
 | (3) |
3.7 Optimization
The experimental concentrations of NaBH4 and ChOx along with the pH and temperature prior to analysis were optimized. The reduction of Ag+ was evaluated using different concentrations of NaBH4 ranging from 2.5 to 9.5 mM (Fig. 8A). The maximum absorption of AgNPs was achieved using a NaBH4 concentration of 9.5 mM. The effect of pH on the enzymatic activity of ChOx was optimized in the pH range of 5–9 (PBS solution). The optimal reaction solution pH of 7.5 was adopted in further experiments (Fig. 8D). After adding different concentrations of ChOx (0.1–3.0 mU) to the reaction solution, the maximum activity was observed at 3.0 mU, resulting in the maximum production of H2O2 and etching of AgNPs (Fig. 8B). The effects of temperature were also investigated (Fig. 8C), and good response was obtained at 37 °C. Thus, the temperature for subsequent experiments was 37 °C.3.8 Analysis of real samples
To verify the reliability of the developed method for cholesterol determination in clinical diagnostics, the AgNP-based sensor was applied to determine cholesterol in BSA and milk. Known amounts of cholesterol (1, 5, and 10 mM) were added to real BSA and milk samples. The original and combined cholesterol concentrations in the real samples were determined from the absorption spectra of the AgNPs after treatment with the real samples. The results are listed in Table 2. The recovery ranged from 99.2% to 102.2% with good relative standard deviations (<2.60%). The results demonstrate that the developed sensor is applicable to the detection of cholesterol in real samples with good precision and accuracy.| Sample | Spiked (mM) | Measured cholesterol (mM) | Recovery (%) | RSD (%) (n = 5) |
|---|---|---|---|---|
| BSA | 1 | 1.352 | 100.8% | 0.89 |
| 5 | 5.890 | 99.2% | 0.98 | |
| 10 | 11.981 | 102.2% | 1.88 | |
| Milk | 1 | 2.510 | 101.6% | 0.45 |
| 5 | 6.121 | 96.2% | 2.59 | |
| 10 | 11.825 | 101.3% | 1.34 |
3.9 Interference effect
The selectivity of the developed probe (AgNPs/ChOx) for cholesterol detection was evaluated in the presence of potential interfering substances (ascorbic acid, urea, galactose, glucose, citric acid, oxalic acid, NaCl, KCl, glycine, sucrose, and cholesterol). As shown in Fig. 9, the absorbance intensity at 400 nm decreased dramatically in the presence of cholesterol. In the presence of these interferential species, no notable changes observed in the absorbance of the AgNPs. Thus, the developed assay exhibited high selectivity for the determination of cholesterol.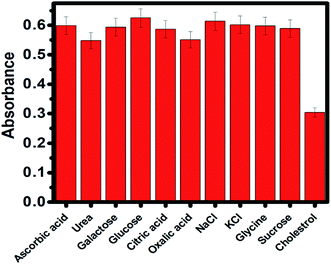 | ||
| Fig. 9 AgNP absorbance in the presence of various potentially interfering biomolecules during cholesterol sensing. | ||
4. Conclusions
We have demonstrated the practicability of a new colorimetric enzymatic assay based on AgNPs as a nanoprobe. H2O2 results in the aggregation and enlargement of AgNPs, affecting the UV-visible absorbance of the AgNPs. This response can be exploited to detect H2O2 and cholesterol sensitively. The probe showed good performance for cholesterol detection with high sensitivity, selectivity, and stability along with a relatively low LOD. The new method was successfully applied to the determination of cholesterol in milk and BSA samples. To the best of our knowledge, this is the first work reporting AgNPs as a colorimetric assay for the detection of cholesterol. The developed probe provides a cost-effective and time-saving strategy for colorimetric assays. Furthermore, the sensing platform can be utilized for various biological molecules with different H2O2-producing oxidases.54 The detection of glucose,55 oxalic acid, sucrose, and uric acid is possible using our approach.Conflicts of interest
There are no conflicts to declare.Acknowledgements
Lakshita Dewangan is thankful for a PhD scholarship from Pt. Ravishankar Shukla University, Raipur. All authors are thankful to the National Chemical Laboratory, Pune for TEM analysis and NCNR Pt. Ravishankar Shukla University, Raipur for FTIR analysis.References
- S. K. Arya, M. Datta and B. D. Malhotra, Biosens. Bioelectron., 2008, 23, 1083–1100 CrossRef CAS
.
- X. Cai, X. Gao, L. Wang, Q. Wu and X. Lin, Sens. Actuators, B, 2013, 181, 575–583 CrossRef CAS
.
- L. Hong, A. L. Liu, G. W. Li, W. Chen and X. H. Lin, Biosens. Bioelectron., 2013, 43, 1–5 CrossRef CAS PubMed
.
- Y. J. Lee and J. Y. Park, Biosens. Bioelectron., 2010, 26, 1353–1358 CrossRef CAS PubMed
.
- T. T. Bui and S. Y. Park, Green Chem., 2016, 18, 4245–4253 RSC
.
- C. J. Hsieh, Y. W. Chen and D. W. Hwang, Phys. Chem. Chem. Phys., 2013, 15, 16634–16640 RSC
.
- A. Hayat, W. Haider, Y. Raza and J. L. Marty, Talanta, 2015, 143, 157–161 CrossRef CAS PubMed
.
- Q. Sun, S. Fang, Y. Fang, Z. Qian and H. Feng, Talanta, 2017, 167, 513–519 CrossRef CAS
.
- E. Priyadarshini and K. Rawat, J. Mater. Chem. B, 2017, 5, 5425–5432 RSC
.
- S. Tang, Q. Zhao and Y. Tu, Sens. Actuators, B, 2016, 237, 416–422 CrossRef CAS
.
- T. Lin, L. Zhong, H. Chen, Z. Li, Z. Song, L. Guo and F. Fu, Microchim. Acta, 2017, 184, 1233–1237 CrossRef CAS
.
- Y. Zhang, Y. N. Wang, X. T. Sun, L. Chen and Z. R. Xu, Sens. Actuators, B, 2017, 246, 118–126 CrossRef CAS
.
- V. Sharma and S. M. Mobin, Sens. Actuators, B, 2017, 240, 338–348 CrossRef CAS
.
- Y. He, X. Niu, L. Shi, H. Zhao, X. Li, W. Zhang, J. Pan, X. Zhang, Y. Yan and M. Lan, Microchim. Acta, 2017, 184, 1–9 CrossRef
.
- M. H. Criqui, Circulation, 1994, 90, 2591 CrossRef CAS
.
- P. Gomathi, D. Ragupathy, J. H. Choi, J. H. Yeum, S. C. Lee, J. C. Kim, S. H. Lee and H. D. Ghim, Sens. Actuators, B, 2011, 153, 44–49 CrossRef CAS
.
- A. N. Sekretaryova, V. Beni, M. Eriksson, A. A. Karyakin, A. P. Turner and M. Y. Vagin, Anal. Chem., 2014, 86, 9540–9547 CrossRef CAS
.
- X. H. Liu, Z. H. Nan, Y. Qiu, L. C. Zheng and X. Q. Lu, Electrochim. Acta, 2013, 90, 203–209 CrossRef CAS
.
- M. M. Rahman, X. B. Li, J. Kim, B. O. Lim, A. J. S. Ahammad and J. J. Lee, Sens. Actuators, B, 2014, 202, 536–542 CrossRef CAS
.
- F. Xie, X. Cao, F. Qu, A. M. Asiri and X. Sun, Sens. Actuators, B, 2018, 255, 1254–1261 CrossRef CAS
.
- Z. Wang, F. Xie, Z. Liu, G. Du, A. M. Asiri and X. Sun, Chem.–Eur. J., 2017, 23, 16179–16183 CrossRef CAS PubMed
.
- X. Xiong, C. You, X. Cao, L. Pang, R. Kong and X. Sun, Electrochim. Acta, 2017, 253, 517–521 CrossRef CAS
.
- N. Zhang, Y. Liu, L. Tong, K. Xu, L. Zhuo and B. Tang, Analyst, 2008, 133, 1176–1181 RSC
.
- A. Mondal and N. R. Jana, Chem. Commun., 2012, 48, 7316–7318 RSC
.
- M. Duan, Y. L. Peng, L. L. Zhang, X. Y. Wang, J. Ge, J. H. Jiang and R. Q. Yu, Anal. Methods, 2013, 5, 2182–2187 RSC
.
- H. Farwanah, J. Wirtz, T. Kolter, K. Raith, R. H. Neubert and K. Sandhoff, J. Chromatogr. B: Anal. Technol. Biomed. Life Sci., 2009, 877, 2976–2982 CrossRef CAS PubMed
.
- K. Hojo, H. Hakamata, A. Ito, A. Kotani, C. Furukawa, Y. Y. Hosokawa and F. Kusu, J. Chromatogr. A, 2007, 1166, 135–141 CrossRef CAS PubMed
.
- K. Hojo, H. Hakamata and F. Kusu, J. Chromatogr. B: Anal. Technol. Biomed. Life Sci., 2011, 879, 751–755 CrossRef CAS PubMed
.
- S. Alexander, P. Barapeedharan, S. Balasubrahmanyan and S. Ramaprabhu, Eur. Polym. J., 2017, 86, 106–116 CrossRef CAS
.
- S. K. Arya, P. R. Solanki, S. P. Singh, K. Kaneto, M. K. Pandey, M. Datta and B. D. Malhotra, Biosens. Bioelectron., 2007, 22, 2516–2524 CrossRef CAS
.
- R. Ahmad, N. Tripathy and Y. B. Hahn, Biosens. Bioelectron., 2013, 45, 281–286 CrossRef CAS PubMed
.
- J. Hassanzadeh and A. Khataee, Talanta, 2018, 178, 992–1000 CrossRef CAS
.
- W. J. Shi, H. Fan, S. Y. Ai and L. S. Zhu, Sens. Actuators, B, 2015, 221, 1515–1522 CrossRef CAS
.
- Y. Zhang, Y. N. Wang, X. T. Sun, L. Chen and Z. R. Xu, Sens. Actuators, B, 2017, 246, 118–126 CrossRef CAS
.
- Y. Huang, L. Cui, Y. Xue, S. Zhang, N. Zhu, J. Liang and G. Li, Mater. Sci. Eng., C, 2017, 77, 1–8 CrossRef CAS PubMed
.
- X. Li, Z. Pu, H. Zhou, W. Zhang, X. Niu, Y. He, X. Xu, F. Qiu, J. Pan and L. Ni, J. Mater. Sci., 2018, 53, 13912–13923 CrossRef CAS
.
- F. Xie, X. Cao, F. Qu, A. M. Asiri and X. Sun, Sens. Actuators, B, 2018, 255, 1254–1261 CrossRef CAS
.
- J. Lv, C. Kong, K. Liu, L. Yin, B. Ma, X. Zhang, S. Yang and Z. Yang, Chem. Commun., 2018, 54, 8458–8461 RSC
.
- Y. Li, Z. Kang, L. Kong, H. Shi, Y. Zhang, M. Cui and D. P. Yang, Mater. Sci. Eng., C, 2019, 104, 110000 CrossRef CAS PubMed
.
- Y. Li, J. Cai, F. Liu, H. Yang, Y. Lin, S. Li, X. Huang and L. Lin, Talanta, 2019, 201, 82–89 CrossRef CAS PubMed
.
- J. Hassanzadeh, A. Khataee and H. Eskandari, Sens. Actuators, B, 2018, 259, 402–410 CrossRef CAS
.
- A. L. Gonzalez, C. Noguez, J. Beranek and A. S. Barnard, J. Phys. Chem. C, 2014, 118, 9128–9136 CrossRef CAS
.
- U. Guler and R. Turan, Opt. Express, 2010, 18, 17322 CrossRef CAS PubMed
.
- A. Polywka, C. Tuckmantel and P. Gorm, Sci. Rep., 2017, 7, 45144 CrossRef CAS PubMed
.
- M. C. Daniel and D. Astruc, Chem. Rev., 2004, 104, 293 CrossRef CAS PubMed
.
- K. Aslan and V. H. P. Luna, Langmuir, 2002, 16, 6059–6065 CrossRef
.
- F. Palazon, C. M. Benavides, D. Léonard, É. Souteyrand, Y. Chevolot and J. P. Cloarec, Langmuir, 2014, 30, 4545–4550 CrossRef CAS PubMed
.
- A. M. Jones, S. Garg, D. He, A. N. Pham and T. D. Waite, Environ. Sci. Technol., 2011, 45, 1248–1434 Search PubMed
.
- D. He, A. M. Jones, S. Garg, A. N. Pham and T. D. Waite, J. Phys. Chem. C, 2011, 115, 5461–5468 CrossRef CAS
.
- D. He, S. Garg and T. D. Waite, Langmuir, 2012, 28, 10266–10275 CrossRef CAS
.
- Q. Wu, L. He, Z. W. Jiang, Y. Li, Z. M. Cao, C. Z. Huang and Y. F. Li, Biosens. Bioelectron., 2019, 111704 CrossRef CAS PubMed
.
- V. Sharma and S. M. Mobin, Sens. Actuators, B, 2017, 240, 338–348 CrossRef CAS
.
- J. A. R. Esqueda, C. T. Torres, J. C. C. Wong, A. C. Sosa, L. R. Fernandez, C. Noguez and A. Oliver, Opt. Express, 2008, 16, 710 CrossRef PubMed
.
- H. C. Chang and J. A. Ho, Anal. Chem., 2015, 87, 10362–10367 CrossRef CAS PubMed
.
- C. Zong, B. Li, J. Wang, X. Liu, W. Zhao, Q. Zhang, X. Nie and Y. Yu, Microchim. Acta, 2018, 185, 199 CrossRef PubMed
.
| This journal is © The Royal Society of Chemistry 2019 |

