 Open Access Article
Three-dimensional reduced graphene oxide aerogel stabilizes molybdenum trioxide with enhanced photocatalytic activity for dye degradation†
Ting Wu‡
a,
Bo Zhang‡*b,
Zhimin Wu*c,
Jinglin Zhanga,
Huidi Liue,
Shaobin Yud,
Zhihao Huanga and
Xiang Cai *a
*a
aDepartment of Light Chemical Engineering, Guangdong Polytechnic, Foshan 528041, P. R. China. E-mail: cecaixiang@163.com
bSchool of Metallurgical and Material Engineering, Hunan University of Technology, Zhuzhou 412007, P. R. China. E-mail: 13747@hut.edu.cn
cHuman Resource Office, Guangdong Polytechnic, Foshan 528041, P. R. China. E-mail: carrybeyond@126.com
dThe No.1 Surgery Department of No.5 People's Hospital of Foshan, Foshan 528211, P. R.China
eScientific Research Office, Guangdong Polytechnic, Foshan 528041, P. R. China
First published on 19th November 2019
Abstract
By using three-dimensional reduced graphene oxide (rGO) aerogel as a carrier for molybdenum trioxide (MoO3), a series of rGO-MoO3 aerogels were synthesized by a self-assembly process. The results indicated that the as-prepared rGO-MoO3 aerogel had very low density and good mechanical properties, and would not deform under more than 1000 times its own pressure. The rGO-MoO3 aerogel showed more than 90% degradation efficiency for MB within 120 min. After six cycles of recycling, the degradation rate of MB only decreased by 1.6%. As supported by the electron paramagnetic resonance (EPR) measurements, the presence of the rGO aerogel enhanced electron conduction, prolonged carrier lifetime and inhibited electron and hole recombination, thus improving the photocatalytic efficiency of composite aerogel. Besides, the hydroxyl radical (OH˙) and radical anion (˙O2−) played an important role in the photodegradation of the dye. The outstanding adsorption and photocatalytic degradation performance of the rGO-MoO3 aerogel was attributed to its unique physical properties, such as high porosity, simple recycling process, high hydrophobicity, low density and excellent mechanical stability. The findings presented herein indicated that the rGO-MoO3 aerogel had good application potential, and could serve as a promising photocatalyst for the degradation of dyes in wastewater.
1. Introduction
In human manufacturing activities, water resources will inevitably be polluted by organic matter, inorganic matter and microorganisms,1,2 and the maintenance of clean water has become a serious global problem with the acceleration of industrialization, which is particularly prominent in developing countries.1,3The waste of organic dyes from various industries is the largest component of organic pollutants in water. Around 105 tons of various organic dyes are released into the environment every year.4 The dosage of dyes in China accounts for 40–45% of the world's total. Due to the huge consumption of dyes, the situation of dye pollution in China is particularly severe.5 Organic dyes are very stable and difficult to decompose in aqueous solutions. Organic dyes discharged into rivers and lakes will cause serious water pollution, which will pose a great threat to the survival of aquatic organisms and human health.6 Methylene blue (MB) and methyl orange (MO) are considered to be the most common toxic dyes, causing skin diseases, genetic mutations and cancer to humans, animals and plants, etc. So, it is urgent to develop efficient and environmentally friendly technology to combat organic dye pollutants in water.5,7
At present, the main methods to remove organic pollutants in water are divided into physical method, chemical method and biological method.8 Physical methods mainly include membrane separation, filtration and evaporation. The chemical method mainly includes adsorption method, REDOX method and neutralization method. Biological methods mainly include activated sludge method and biological filtration method. Among these methods, adsorption method and photodegradation method are widely used in the purification of water pollution due to their convenience, high efficiency and economy, and they will not produce other harmful substances during the process of treatment and bring secondary pollution to the water body.9,10 Specially, photocatalytic technology is an effective means to convert solar energy into chemical energy to generate clean energy and degrade pollutants in the environment.9–12
Molybdenum trioxide (MoO3) is an n-type semiconductor with good photochromic and electrochromic characteristics, which is suitable for various fields, including energy storage, gas sensing devices, catalytic applications and electrochemical devices.13–16 In recent years, MoO3 has become a research object in the field of photocatalysis due to its large specific surface area and electron transmission along the axis, etc., but the photocatalytic degradation ability of MoO3 is limited due to its large band gap width and high photo-generated electron recombination rate.17–21 Graphene aerogels are characterized by large specific surface area, good hydrophilicity and effective improvement of photocatalytic property of material.22–26
In order to improve the photocatalytic degradation performance of MoO3, by loading MoO3 on reduced graphene oxide (rGO) aerogel, the rapid electron conduction could be achieved by virtue of the excellent electrical conductivity of rGO sheet layer to inhibit the combination of photo-generated electron and hole, thereby improving the photocatalytic efficiency.
In this study, MB and MO were selected as representative organic dyes, and the degradation effect of rGO-MoO3 aerogel under simulated visible light on MB and MO in aqueous solution was investigated. Moreover, the degradation behavior of rGO-MoO3 aerogel was investigated from the aspects of reaction kinetics and photocatalytic degradation mechanism.
2. Materials and methods
2.1. Materials
Graphite powder (spectral pure) and all other analytical grade reagents (phosphorus pentoxide, concentrated sulfuric acid, potassium permanganate, hydrogen peroxide, sodium hydroxide, molybdenum pentachloride, anhydrous ethanol, ascorbic acid, sodium chloride, methylene blue and methyl orange) were purchased from Sinopharm Chemical Reagent Co., Ltd and used as received without further purification. All aqueous solutions used for the experiments were prepared with deionized water.2.2. Preparation of rGO-MoO3 aerogels
A typical preparation of MoO3 was described as follows: 0.325 g of MoCl5 was completely dissolved in the mixed solution of 40 mL of deionized water and 10 mL of anhydrous ethanol. After continuous stirring for 1 h, the MoCl5 solution was transferred to the polytetrafluoroethylene reactor and placed in the mufter furnace for reaction at 180 °C for 10 h. After being cooled to room temperature in the air, the generated precipitation was centrifuged and separated, washed with anhydrous ethanol and deionized water for several times, and dried in an oven at 80 °C for 3 h to get impure MoO3. In order to completely convert MoCl5 into MoO3, the impure MoO3 powders were putted in a porcelain crucible, and continued to react at 450 °C for 1 h in muff furnace. After cooling to room temperature, the obtained powder was denoted as MoO3.A typical preparation of rGO-MoO3 aerogel was described as follows: graphene oxide was prepared through the modified Hummers' method.27 50 mL of graphene oxide aqueous solution (3 mg mL−1) was ultrasonically mixed for 20 min to obtain a uniform mixed solution. Then, 150 mg of vitamin C and different quantities of MoO3 were added and stirred evenly for 30 min to obtain a uniform sol mixed solution. Then, the mixed solution was divided into 5 small 25 mL bottles with lids. They were placed in an oven at 95 °C for 6 h to obtain rGO-MoO3 hydrogel, and then soaked in PVA solution for 24 h. Finally, after three times of washing with deionized water, rGO-MoO3 aerogel was obtained through freeze-drying (naming of sample was shown in Table 1).
| Sample | Input mass ratio/actual mass ratio (WrGO![[thin space (1/6-em)]](https://www.rsc.org/images/entities/char_2009.gif) : :![[thin space (1/6-em)]](https://www.rsc.org/images/entities/char_2009.gif) WMoO3) WMoO3) |
aABET (m2 g−1) | Density (mg cm−3) | bPMA (m2 g−1) | cPEA (m2 g−1) | dVtotal (cm3 g−1) | eDave-pore (nm) |
|---|---|---|---|---|---|---|---|
| a Specific surface area.b Micropore surface area.c Remaining surface area.d Pore volume.e Average pore diameter. | |||||||
| rGO | 1![[thin space (1/6-em)]](https://www.rsc.org/images/entities/char_2009.gif) : :![[thin space (1/6-em)]](https://www.rsc.org/images/entities/char_2009.gif) 0/1 0/1![[thin space (1/6-em)]](https://www.rsc.org/images/entities/char_2009.gif) : :![[thin space (1/6-em)]](https://www.rsc.org/images/entities/char_2009.gif) 0 0 |
326.5 | 84.3 | 16.3 | 310.2 | 2.17 | 97.8 |
| MoO3 | 0![[thin space (1/6-em)]](https://www.rsc.org/images/entities/char_2009.gif) : :![[thin space (1/6-em)]](https://www.rsc.org/images/entities/char_2009.gif) 1/0 1/0![[thin space (1/6-em)]](https://www.rsc.org/images/entities/char_2009.gif) : :![[thin space (1/6-em)]](https://www.rsc.org/images/entities/char_2009.gif) 1 1 |
18.3 | 9653.5 | — | — | — | — |
rGO-MoO3 (3![[thin space (1/6-em)]](https://www.rsc.org/images/entities/char_2009.gif) : :![[thin space (1/6-em)]](https://www.rsc.org/images/entities/char_2009.gif) 1) 1) |
3![[thin space (1/6-em)]](https://www.rsc.org/images/entities/char_2009.gif) : :![[thin space (1/6-em)]](https://www.rsc.org/images/entities/char_2009.gif) 1/3 1/3![[thin space (1/6-em)]](https://www.rsc.org/images/entities/char_2009.gif) : :![[thin space (1/6-em)]](https://www.rsc.org/images/entities/char_2009.gif) 1 1 |
224.8 | 103.7 | 19.6 | 205.2 | 1.32 | 118.7 |
rGO-MoO3 (4![[thin space (1/6-em)]](https://www.rsc.org/images/entities/char_2009.gif) : :![[thin space (1/6-em)]](https://www.rsc.org/images/entities/char_2009.gif) 1) 1) |
4![[thin space (1/6-em)]](https://www.rsc.org/images/entities/char_2009.gif) : :![[thin space (1/6-em)]](https://www.rsc.org/images/entities/char_2009.gif) 1/4 1/4![[thin space (1/6-em)]](https://www.rsc.org/images/entities/char_2009.gif) : :![[thin space (1/6-em)]](https://www.rsc.org/images/entities/char_2009.gif) 1 1 |
225.1 | 93.3 | 18.4 | 206.7 | 1.51 | 134.5 |
rGO-MoO3 (5![[thin space (1/6-em)]](https://www.rsc.org/images/entities/char_2009.gif) : :![[thin space (1/6-em)]](https://www.rsc.org/images/entities/char_2009.gif) 1) 1) |
5![[thin space (1/6-em)]](https://www.rsc.org/images/entities/char_2009.gif) : :![[thin space (1/6-em)]](https://www.rsc.org/images/entities/char_2009.gif) 1/5 1/5![[thin space (1/6-em)]](https://www.rsc.org/images/entities/char_2009.gif) : :![[thin space (1/6-em)]](https://www.rsc.org/images/entities/char_2009.gif) 1 1 |
236.5 | 92.1 | 22.4 | 214.1 | 1.57 | 144.8 |
rGO-MoO3 (6![[thin space (1/6-em)]](https://www.rsc.org/images/entities/char_2009.gif) : :![[thin space (1/6-em)]](https://www.rsc.org/images/entities/char_2009.gif) 1) 1) |
6![[thin space (1/6-em)]](https://www.rsc.org/images/entities/char_2009.gif) : :![[thin space (1/6-em)]](https://www.rsc.org/images/entities/char_2009.gif) 1/6 1/6![[thin space (1/6-em)]](https://www.rsc.org/images/entities/char_2009.gif) : :![[thin space (1/6-em)]](https://www.rsc.org/images/entities/char_2009.gif) 1 1 |
247.4 | 88.5 | 23.5 | 223.9 | 1.88 | 132.1 |
2.3. Characterization
Crushing of samples: in the cold storage, 500 mL of rGO-MoO3 aerogel slurry with a concentration of 10 mg mL−1 was rapidly frozen into ice cube with liquid nitrogen. The ice slag was first obtained by crushing it with an ice breaker, and then transferred to the experimental cryogen pulverizer, which added liquid nitrogen in advance for refrigeration. The shredder was opened for 1 min, liquid nitrogen was added for cooling, and sample was continued to grind for 1 min. The powder particle was sieved over 80 mesh, the screened smoothes were put into the tray of the freeze-dryer, and the smoothes were dried at −5 °C under the condition of vacuum degree of 10 Pa for 30 h. After drying, the rGO-MoO3 aerogel was packed, and the physical and chemical properties was shown in Table 1.X-ray diffraction (XRD, Rigaku D/max 2500v/pc X-ray diffractometer, Cu Kα radiation, nickel-filtered, λ = 0.15405 nm) test: the measured voltage was 36 kV, the current was 20 mA, the scanning speed was 4° min−1, and the scanning angle was 5–80°.
Fourier transform infrared (FTIR, Bruker Vertex 70 FTIR spectrophotometer) spectra test: KBr and sample to be tested were placed in an oven at 60 °C and dried for 2 h, and the FTIR spectra were measured with the wavelength range of 400–4000 cm−1.
Raman (Renishaw INVIA spectrometer) spectra test: the 514.5 nm radiation from a 20 mW air-cooled argon ion laser was used as the excitation source.
X-ray photoelectron spectroscopy (XPS, Thermo-VG Scientific) test: the XPS profiles were recorded by an ESCALAB 250 X-ray Photoelectron Spectroscopy.
Scanning electron microscopy (SEM, PHILIPS XL-30) test: the surface morphology, element composition and content of sample were observed under the field emission scanning electron microscope with the acceleration voltage of 20.0 kV.
Transmission electron microscope (TEM, Dutch electronics Philips Tecnai type 10) test: the sample was ultrasonically dispersed in ethanol solution (0.1 mg mL−1), and 1 to 2 drops of the mixture solution were dropped on carbon film. The morphology and element distribution of sample were observed.
The specific surface area (SSA, Micromeritics 2020 analyzer) test: the specific surface areas of rGO and rGO-MoO3 aerogel were detected by automatic specific surface area and pore analyzer. The adsorbent was nitrogen, the degassing mode was heated and vacuum-evacuated, the degassing temperature was 85 °C, the degassing time was 6 h, the ambient temperature was 15 °C, and the saturated vapor pressure was 1.04 bar.
Ultraviolet absorption spectrum (UV/Vis spectra, Hitachi 330 UV-Vis spectrophotometer) test: all the aqueous samples were diluted to 0.05 mg mL−1, and the wavelength range of solid UV/Vis spectrum was 200–800 nm.
Fluorescence spectrum (Hitachi F4600 fluorescence spectrophotometer) test: all the aqueous samples were diluted to 0.05 mg mL−1. The excitation wavelength of MoO3 was 450 nm, and the excitation wavelength of rGO-MoO3 aerogel was 250 nm.
The electron paramagnetic resonance (EPR) signals of the samples were recorded at room temperature on Bruker Elexsys E580 EPR spectrometer in X-band (m = 9.4 GHz, 3.2 cm wavelength, X-band).
2.4. Evaluation of photocatalytic activity
The visible light photocatalytic activity of rGO-MoO3 aerogel on degrading MB and MO was evaluated in the photochemical reactor (XUJIANG XPA-2). A 300 W xenon lamp containing a 420 nm filter (HITACHI Y-430) was used, and the reaction system was kept at 25 °C by circulating cooling water.100 mg of rGO-MoO3 aerogel was put into 200 mL of MB solution (40 mg L−1) or MO solution (20 mg L−1), and stirred for 4 h under dark condition to make the rGO-MoO3 aerogel and MB or MO solution reach the adsorption and desorption equilibrium. Then, the whole reaction system was exposed to Xenon light. 4 mL of solution was taken every 20 min, and MB or MO concentration was determined by a TU-1900 spectrophotometer (MB at 662 nm or MO at 465 nm). The degradation rate (Dp) was calculated through the formula (1).
| Dp = [1 − (C/C0)] × 100% | (1) |
2.5. Stability of photocatalytic properties
The photocatalytic performance stability of rGO-MoO3 aerogel was tested by several successive degradation experiments. After each degradation experiment, the rGO-MoO3 aerogel was taken out and washed with 100 mL of flowing deionized water for three times without any other treatments. After that, the rGO-MoO3 aerogel was freeze-dried for 12 h at −55 °C for the next degradation experiment.To identify the main reactive species of rGO-MoO3 aerogel involving in the photodegradation of MB, the trapping experiments were conducted by using EPR spectrometer. In this experiment, isopropyl alcohol (IPA), benzoquinone (BQ) and disodium ethylenediaminetetraacetic acid (EDTA) were used as scavengers and mixed in the aqueous solution to trap the hydroxyl radical (OH˙), radical anion (˙O2−) and hole (h+), respectively.
3. Results and discussion
3.1. Composition and structural characterization
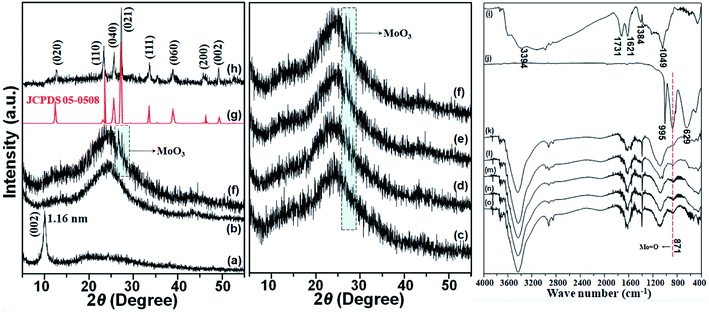
The XRD patterns of GO, rGO, MoO3 and rGO-MoO3 aerogels were shown in Fig. 1. For GO, there was an obvious corresponding characteristic diffraction peak of (001) crystal plane at 2θ = 10.30°; for rGO, this corresponding characteristic peak (2θ = 10.30°) was not found, but a wide peak occurred at 2θ = 24.90°, indicating that GO was reduced during the self-assembly of GO sheet into three-dimensional (3D) rGO aerogel. MoO3 had many characteristic peaks at 2θ = 12.78°, 23.32°, 25.92°, 27.44°, 33.52°, 39.05°, 45.90° and 49.70°, corresponding to crystal faces of (020), (110), (040), (021), (111), (060), (200) and (002), respectively. According to the standard card of MoO3 (JCPDS 05-0508),28 the prepared MoO3 was α-MoO3. According to the calculation of Bragg equation, the average layer spacing of (021) crystal plane was 0.32 nm, which was slightly smaller than the theoretical value of 0.33 nm, possibly due to the loss of interlayer water molecule after high temperature treatment. In addition, the average thickness of MoO3 calculated according to Scherer's formula was about 300 nm.29 For rGO-MoO3 aerogels, the XRD patterns almost coincided with that of rGO aerogel. Except the (021) crystal plane of MoO3, the peaks for MoO3 were not observed in the diffraction patterns of rGO-MoO3 aerogels. The reason could be ascribed to low diffraction intensity of MoO3 (except the (021) crystal plane). What was more, with the content of MoO3 increased, the intensity of the (021) diffraction peak of MoO3 also gradually increased.The FTIR spectra of GO, rGO, MoO3 and rGO-MoO3 aerogels were shown in Fig. 1. At 3394 cm−1, the elongation vibration of –OH was typical in water, and the corresponding characteristic peaks at 1731 cm−1, 1621 cm−1, 1384 cm−1 and 1049 cm−1 respectively represented C![[double bond, length as m-dash]](https://www.rsc.org/images/entities/char_e001.gif) O, C–OH, and C–O–C bonds,27 indicating that graphite powder was oxidized into GO. In rGO and rGO-MoO3 aerogels, these oxidation functional groups were weak, indicating that GO was reduced to rGO. For MoO3, characteristic peaks at 995 cm−1 and 871 cm−1 were derived from Mo
O, C–OH, and C–O–C bonds,27 indicating that graphite powder was oxidized into GO. In rGO and rGO-MoO3 aerogels, these oxidation functional groups were weak, indicating that GO was reduced to rGO. For MoO3, characteristic peaks at 995 cm−1 and 871 cm−1 were derived from Mo![[double bond, length as m-dash]](https://www.rsc.org/images/entities/char_e001.gif) O of MoO3, and characteristic peak at 629 cm−1 corresponded to O–Mo–O bending vibration.30 For rGO-MoO3 aerogels, the FTIR spectra almost coincided with that of rGO aerogel. Except the characteristic peak at 871 cm−1 of MoO3, the characteristic peaks for MoO3 were not observed in the characteristic peaks of rGO-MoO3 aerogels. The reason could be ascribed to the positions of characteristic peaks were almost coincident (except the 871 cm−1 of MoO3). What was more, with the content of MoO3 increased, the intensity of characteristic peak at 871 cm−1 of MoO3 also gradually increased.
O of MoO3, and characteristic peak at 629 cm−1 corresponded to O–Mo–O bending vibration.30 For rGO-MoO3 aerogels, the FTIR spectra almost coincided with that of rGO aerogel. Except the characteristic peak at 871 cm−1 of MoO3, the characteristic peaks for MoO3 were not observed in the characteristic peaks of rGO-MoO3 aerogels. The reason could be ascribed to the positions of characteristic peaks were almost coincident (except the 871 cm−1 of MoO3). What was more, with the content of MoO3 increased, the intensity of characteristic peak at 871 cm−1 of MoO3 also gradually increased.
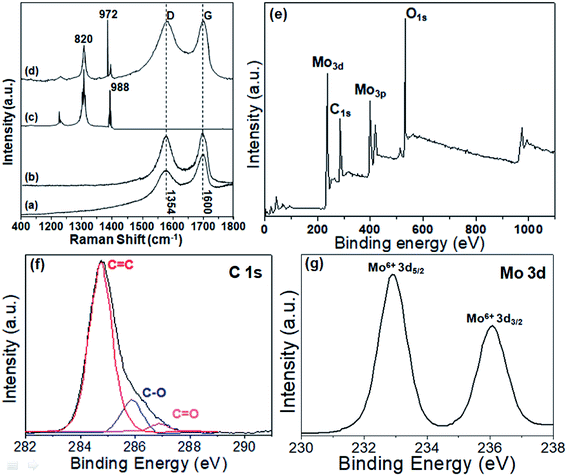
The Raman and XPS spectra were also performed (Fig. 2). In Fig. 2a, the Raman shifts of the GO at 1354 cm−1 and 1600 cm−1 were respectively the characteristic D- and G-bands with an ID/IG ratio of 0.81. Moreover, the ID/IG ratio of rGO was 1.02. The D-band represented the defects in the GO lattice of C atom, and the G-band represented the in-plane stretching vibration of sp2 hybridization of C atom. For rGO aerogel (Fig. 2b), these bands still existed with an ID/IG ratio of 0.97, and the ID/IG ratio increased compared to that of GO. This was due to the formation of smaller and new sp2 domain during reduction.24 For MoO3, two main peaks at 820 cm−1 and 988 cm−1 (M = O stretching) could be found, respectively, which was attributed to the stretching and bending of Mo–O bonds.14,21 In Fig. 2d, the Raman shifts of rGO-MoO3 (3![[thin space (1/6-em)]](https://www.rsc.org/images/entities/char_2009.gif) :
:![[thin space (1/6-em)]](https://www.rsc.org/images/entities/char_2009.gif) 1) aerogel combined the Raman shifts of rGO aerogel and MoO3. Besides the peaks of α-MoO3, the D and G peaks of rGO aerogel were also present.
1) aerogel combined the Raman shifts of rGO aerogel and MoO3. Besides the peaks of α-MoO3, the D and G peaks of rGO aerogel were also present.
In Fig. 2e, the surface chemistry of the rGO-MoO3 (3![[thin space (1/6-em)]](https://www.rsc.org/images/entities/char_2009.gif) :
:![[thin space (1/6-em)]](https://www.rsc.org/images/entities/char_2009.gif) 1) aerogel was displayed, and the rGO-MoO3 (3
1) aerogel was displayed, and the rGO-MoO3 (3![[thin space (1/6-em)]](https://www.rsc.org/images/entities/char_2009.gif) :
:![[thin space (1/6-em)]](https://www.rsc.org/images/entities/char_2009.gif) 1) aerogel only contained C, O and Mo elements. In Fig. 2f, the individual C 1s spectrum of the rGO-MoO3 (3
1) aerogel only contained C, O and Mo elements. In Fig. 2f, the individual C 1s spectrum of the rGO-MoO3 (3![[thin space (1/6-em)]](https://www.rsc.org/images/entities/char_2009.gif) :
:![[thin space (1/6-em)]](https://www.rsc.org/images/entities/char_2009.gif) 1) aerogel was displayed, and different oxygen-containing functional groups of the C
1) aerogel was displayed, and different oxygen-containing functional groups of the C![[double bond, length as m-dash]](https://www.rsc.org/images/entities/char_e001.gif) C bond at 284.8 eV, the C–O bond at 286.2 eV and the C
C bond at 284.8 eV, the C–O bond at 286.2 eV and the C![[double bond, length as m-dash]](https://www.rsc.org/images/entities/char_e001.gif) O bond at 288.9 eV were presented.14,21 In Fig. 2g, the individual Mo 3d spectrum of the rGO-MoO3 (3
O bond at 288.9 eV were presented.14,21 In Fig. 2g, the individual Mo 3d spectrum of the rGO-MoO3 (3![[thin space (1/6-em)]](https://www.rsc.org/images/entities/char_2009.gif) :
:![[thin space (1/6-em)]](https://www.rsc.org/images/entities/char_2009.gif) 1) aerogel spectrum was displayed. With an integrated peak area ratio of 3
1) aerogel spectrum was displayed. With an integrated peak area ratio of 3![[thin space (1/6-em)]](https://www.rsc.org/images/entities/char_2009.gif) :
:![[thin space (1/6-em)]](https://www.rsc.org/images/entities/char_2009.gif) 2, there were two peaks located at 232.8 and 236.2 eV, corresponding to Mo(VI) for MoO3 in rGO-MoO3 (3
2, there were two peaks located at 232.8 and 236.2 eV, corresponding to Mo(VI) for MoO3 in rGO-MoO3 (3![[thin space (1/6-em)]](https://www.rsc.org/images/entities/char_2009.gif) :
:![[thin space (1/6-em)]](https://www.rsc.org/images/entities/char_2009.gif) 1) aerogel.14,21
1) aerogel.14,21
Nitrogen isothermal adsorption and desorption experiment at 77 K could further analyze the porous structure of rGO-MoO3 aerogels, and the results were shown in Table 1 and Fig. S1.† According to IUPAC classification, it could be found that rGO aerogel and rGO-MoO3 aerogels showed V-shaped isotherms. In the low and medium pressure section, there was almost no adsorption of all rGO-MoO3 aerogels, indicating that there was almost no micropore and mesopore in material. At P/P0 > 0.9 (Fig. S1†), rGO aerogel and rGO-MoO3 aerogels had similar steep and rising peaks and H3-type lag rings, which might be related to macroscopic pores or intercrystalline spaces. Nitrogen isothermal adsorption and desorption curves of rGO-MoO3 aerogels with different mass proportions had similar shapes, except that the adsorption capacity would be different at high pressure section due to different pore size.
As shown in Table 1, the specific surface areas of rGO aerogel, rGO-MoO3 (3![[thin space (1/6-em)]](https://www.rsc.org/images/entities/char_2009.gif) :
:![[thin space (1/6-em)]](https://www.rsc.org/images/entities/char_2009.gif) 1) aerogel, rGO-MoO3 (4
1) aerogel, rGO-MoO3 (4![[thin space (1/6-em)]](https://www.rsc.org/images/entities/char_2009.gif) :
:![[thin space (1/6-em)]](https://www.rsc.org/images/entities/char_2009.gif) 1) aerogel, rGO-MoO3 (5
1) aerogel, rGO-MoO3 (5![[thin space (1/6-em)]](https://www.rsc.org/images/entities/char_2009.gif) :
:![[thin space (1/6-em)]](https://www.rsc.org/images/entities/char_2009.gif) 1) aerogel and rGO-MoO3 (6
1) aerogel and rGO-MoO3 (6![[thin space (1/6-em)]](https://www.rsc.org/images/entities/char_2009.gif) :
:![[thin space (1/6-em)]](https://www.rsc.org/images/entities/char_2009.gif) 1) aerogel were 326.5, 224.8, 225.1, 236.5 and 247.4 m2 g−1, respectively. The theoretical specific surface area of rGO was over 2000 m2 g−1, while the specific surface areas of rGO aerogel and rGO-MoO3 aerogels prepared in this experiment were very low. This was mainly for two reasons: first, the agglomeration and incomplete stripping of rGO aerogel during the self-assembly process of rGO aerogel lamella; second, the rGO and rGO-MoO3 aerogels had to be crushed into powder during the test, which destroyed the pore structure inside the aerogel and affected the specific surface area of the aerogel. The mean pore diameters of rGO aerogel, rGO-MoO3 (3
1) aerogel were 326.5, 224.8, 225.1, 236.5 and 247.4 m2 g−1, respectively. The theoretical specific surface area of rGO was over 2000 m2 g−1, while the specific surface areas of rGO aerogel and rGO-MoO3 aerogels prepared in this experiment were very low. This was mainly for two reasons: first, the agglomeration and incomplete stripping of rGO aerogel during the self-assembly process of rGO aerogel lamella; second, the rGO and rGO-MoO3 aerogels had to be crushed into powder during the test, which destroyed the pore structure inside the aerogel and affected the specific surface area of the aerogel. The mean pore diameters of rGO aerogel, rGO-MoO3 (3![[thin space (1/6-em)]](https://www.rsc.org/images/entities/char_2009.gif) :
:![[thin space (1/6-em)]](https://www.rsc.org/images/entities/char_2009.gif) 1) aerogel, rGO-MoO3 (4
1) aerogel, rGO-MoO3 (4![[thin space (1/6-em)]](https://www.rsc.org/images/entities/char_2009.gif) :
:![[thin space (1/6-em)]](https://www.rsc.org/images/entities/char_2009.gif) 1) aerogel, rGO-MoO3 (5
1) aerogel, rGO-MoO3 (5![[thin space (1/6-em)]](https://www.rsc.org/images/entities/char_2009.gif) :
:![[thin space (1/6-em)]](https://www.rsc.org/images/entities/char_2009.gif) 1) aerogel and rGO-MoO3 (6
1) aerogel and rGO-MoO3 (6![[thin space (1/6-em)]](https://www.rsc.org/images/entities/char_2009.gif) :
:![[thin space (1/6-em)]](https://www.rsc.org/images/entities/char_2009.gif) 1) aerogel were 97.8, 118.7, 134.5, 144.8 and 132.1 nm, respectively, indicating macroscopic or intergranular pores formed by powder stacking and 3D pores assembled by incomplete lamella.
1) aerogel were 97.8, 118.7, 134.5, 144.8 and 132.1 nm, respectively, indicating macroscopic or intergranular pores formed by powder stacking and 3D pores assembled by incomplete lamella.
3.2. Morphology characterization
In order to further determine the morphologies of rGO-MoO3 aerogels, the surface morphologies of them were observed by SEM (Fig. 3). It could be seen from Fig. 3a that MoO3 had a flake structure with almost uniform size and a thickness of about 300 nm, which was consistent with the XRD calculation. In Fig. 3b, rGO aerogel was 3D layered lamella and stacked structure with surface fold. It could be seen from Fig. 3c–f that the 3D network structure was formed by rGO aerogel during the self-assembly process of rGO lamella. The rGO-MoO3 aerogel was a porous 3D mesh structure formed by the interconnection between disordered self-assembled lamella and lamella, and the pores formed were more and messier than those inside rGO aerogel. In addition, we could observe that the rGO-MoO3 aerogel was composed of two parts. One was the outer wall of aerogel, formed by the accumulation of many rGO sheet layers with rough surface, and another was the core of aerogel. It could be seen that patchy MoO3 was sporadically attached to the surface of rGO sheet layer (yellow dotted circle), indicating that MoO3 was successfully introduced into rGO aerogel.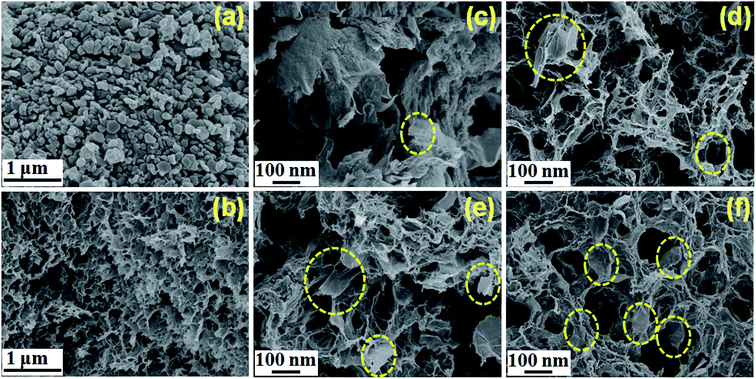 | ||
Fig. 3 The SEM images of (a) MoO3, (b) rGO aerogel, (c) rGO-MoO3 (6![[thin space (1/6-em)]](https://www.rsc.org/images/entities/char_2009.gif) : :![[thin space (1/6-em)]](https://www.rsc.org/images/entities/char_2009.gif) 1) aerogel, (d) rGO-MoO3 (5 1) aerogel, (d) rGO-MoO3 (5![[thin space (1/6-em)]](https://www.rsc.org/images/entities/char_2009.gif) : :![[thin space (1/6-em)]](https://www.rsc.org/images/entities/char_2009.gif) 1) aerogel, (e) rGO-MoO3 (4 1) aerogel, (e) rGO-MoO3 (4![[thin space (1/6-em)]](https://www.rsc.org/images/entities/char_2009.gif) : :![[thin space (1/6-em)]](https://www.rsc.org/images/entities/char_2009.gif) 1) aerogel, and (f) rGO-MoO3 (3 1) aerogel, and (f) rGO-MoO3 (3![[thin space (1/6-em)]](https://www.rsc.org/images/entities/char_2009.gif) : :![[thin space (1/6-em)]](https://www.rsc.org/images/entities/char_2009.gif) 1) aerogel. 1) aerogel. | ||
Fig. 4a was the TEM diagram of MoO3. The test results were completely consistent with those in SEM diagram, and they were uniform sheets. From Fig. 4b, we could see that rGO was a single lamellar layer with slight fold. In the TEM of rGO-MoO3 aerogels, it could be obviously observed that MoO3 was disorderly scattered on the rGO lamella. In Fig. 4e–g, the elemental analysis also showed that rGO-MoO3 aerogel was composed of C, O and Mo elements, indicating that MoO3 and rGO were successfully compounded. In addition, the lattice diffraction fringe from MoO3 could be clearly seen in the high-power TEM figure (Fig. 4d). The lattice spacings of 0.322 nm and 0.398 nm corresponded to the (021) and (101) diffraction fringes of MoO3, respectively. According to the above characterization results, MoO3 was successfully loaded in rGO aerogel.
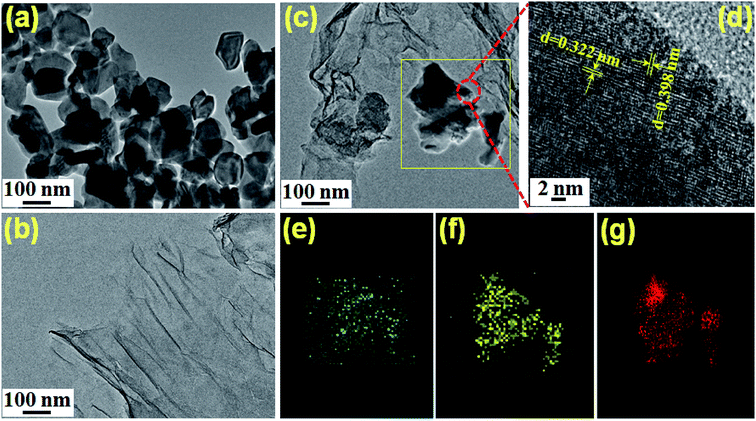 | ||
Fig. 4 The TEM images of (a) MoO3, (b) rGO aerogel, (c) rGO-MoO3 (3![[thin space (1/6-em)]](https://www.rsc.org/images/entities/char_2009.gif) : :![[thin space (1/6-em)]](https://www.rsc.org/images/entities/char_2009.gif) 1) aerogel, (d) lattice diffraction fringe of MoO3 on rGO-MoO3 (3 1) aerogel, (d) lattice diffraction fringe of MoO3 on rGO-MoO3 (3![[thin space (1/6-em)]](https://www.rsc.org/images/entities/char_2009.gif) : :![[thin space (1/6-em)]](https://www.rsc.org/images/entities/char_2009.gif) 1) aerogel, (e–g) mapping of MoO3 on rGO-MoO3 (3 1) aerogel, (e–g) mapping of MoO3 on rGO-MoO3 (3![[thin space (1/6-em)]](https://www.rsc.org/images/entities/char_2009.gif) : :![[thin space (1/6-em)]](https://www.rsc.org/images/entities/char_2009.gif) 1) aerogel. 1) aerogel. | ||
Table 1 also showed the actual MoO3 mass ratio in rGO aerogel. The input mass ratio and the actual component mass ratio of rGO-MoO3 aerogel did not have much difference. Input mass ratios of rGO-MoO3 aerogels were 3![[thin space (1/6-em)]](https://www.rsc.org/images/entities/char_2009.gif) :
:![[thin space (1/6-em)]](https://www.rsc.org/images/entities/char_2009.gif) 1, 4
1, 4![[thin space (1/6-em)]](https://www.rsc.org/images/entities/char_2009.gif) :
:![[thin space (1/6-em)]](https://www.rsc.org/images/entities/char_2009.gif) 1, 5
1, 5![[thin space (1/6-em)]](https://www.rsc.org/images/entities/char_2009.gif) :
:![[thin space (1/6-em)]](https://www.rsc.org/images/entities/char_2009.gif) 1 and 6
1 and 6![[thin space (1/6-em)]](https://www.rsc.org/images/entities/char_2009.gif) :
:![[thin space (1/6-em)]](https://www.rsc.org/images/entities/char_2009.gif) 1, and the actual component mass ratios were 3
1, and the actual component mass ratios were 3![[thin space (1/6-em)]](https://www.rsc.org/images/entities/char_2009.gif) :
:![[thin space (1/6-em)]](https://www.rsc.org/images/entities/char_2009.gif) 1, 4
1, 4![[thin space (1/6-em)]](https://www.rsc.org/images/entities/char_2009.gif) :
:![[thin space (1/6-em)]](https://www.rsc.org/images/entities/char_2009.gif) 1, 5
1, 5![[thin space (1/6-em)]](https://www.rsc.org/images/entities/char_2009.gif) :
:![[thin space (1/6-em)]](https://www.rsc.org/images/entities/char_2009.gif) 1 and 6
1 and 6![[thin space (1/6-em)]](https://www.rsc.org/images/entities/char_2009.gif) :
:![[thin space (1/6-em)]](https://www.rsc.org/images/entities/char_2009.gif) 1, respectively, which meant that MoO3 was completely loaded on GO.
1, respectively, which meant that MoO3 was completely loaded on GO.
As could be seen from Fig. 5, after freeze-drying, the volume of rGO-MoO3 aerogel was slightly larger than that of rGO aerogel, indicating that the addition of MoO3 increased the volume of rGO aerogel. Putting 100 g of weight on rGO-MoO3 aerogels and rGO aerogel, respectively, it could be seen that rGO-MoO3 aerogels would still maintain the intact appearance, while rGO aerogel completely collapsed, which proved that the addition of MoO3 increased the mechanical strength of rGO-MoO3 aerogels. The rGO-MoO3 aerogel was placed on kapok fluff, and it was found that kapok fluff did not deform at all, which indicated that rGO-MoO3 aerogel had the characteristics of low density.
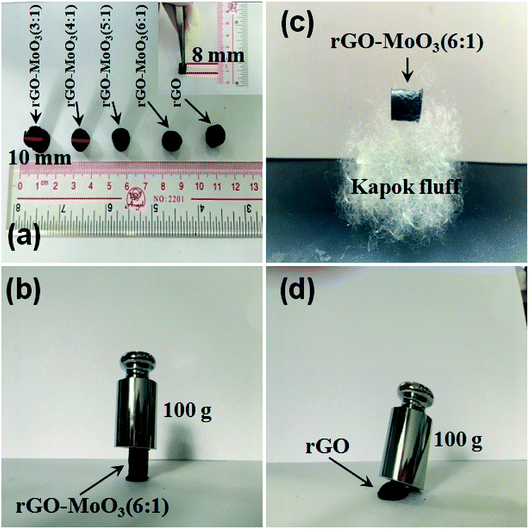 | ||
Fig. 5 (a) The digital photos of rGO and rGO-MoO3 aerogels; (b and c) the mechanical property of rGO-MoO3 (6![[thin space (1/6-em)]](https://www.rsc.org/images/entities/char_2009.gif) : :![[thin space (1/6-em)]](https://www.rsc.org/images/entities/char_2009.gif) 1) aerogel; (d) the mechanical property of rGO aerogel. 1) aerogel; (d) the mechanical property of rGO aerogel. | ||
3.3. Optical properties
The optical properties of rGO-MoO3 aerogels would directly affect their degradation properties. As shown in Fig. 6a, the absorption range of MoO3 was mainly in the ultraviolet region, and the maximum absorption showed at 440 nm, which was generated by inter-band and exciton transition. By contrast, rGO aerogel had full spectrum absorption. For rGO-MoO3 aerogels, the absorption range was almost the same with that of rGO aerogel, but the light absorption ability was lower than that of rGO aerogel. What was more, with the content of rGO increased, the light absorption ability of rGO-MoO3 aerogel also gradually increased.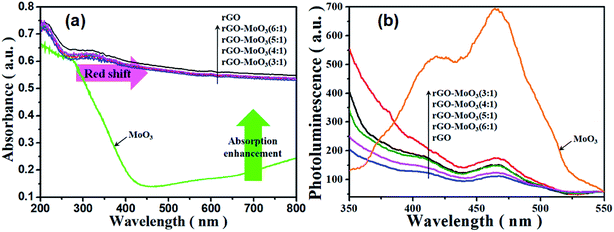 | ||
Fig. 6 UV-Vis diffuse reflectance spectra (a) and photoluminescence emission spectra (b) of rGO, MoO3, rGO-MoO3 (3![[thin space (1/6-em)]](https://www.rsc.org/images/entities/char_2009.gif) : :![[thin space (1/6-em)]](https://www.rsc.org/images/entities/char_2009.gif) 1), rGO-MoO3 (4 1), rGO-MoO3 (4![[thin space (1/6-em)]](https://www.rsc.org/images/entities/char_2009.gif) : :![[thin space (1/6-em)]](https://www.rsc.org/images/entities/char_2009.gif) 1), rGO-MoO3 (5 1), rGO-MoO3 (5![[thin space (1/6-em)]](https://www.rsc.org/images/entities/char_2009.gif) : :![[thin space (1/6-em)]](https://www.rsc.org/images/entities/char_2009.gif) 1) and rGO-MoO3 (6 1) and rGO-MoO3 (6![[thin space (1/6-em)]](https://www.rsc.org/images/entities/char_2009.gif) : :![[thin space (1/6-em)]](https://www.rsc.org/images/entities/char_2009.gif) 1). 1). | ||
The fluorescence spectrum could reflect the carrier transfer process and the captured process of the semiconductor. It could be seen from Fig. 6b that the fluorescence spectrum of rGO-MoO3 aerogel showed a certain fluorescence quenching phenomenon. Because nano-flake MoO3 distributed in the interior of rGO-MoO3 aerogel, the moment when electrons and holes were separated provided convenience for electron conduction and greatly inhibited the recombination of electrons and holes. The 3D structure of rGO-MoO3 aerogel had a large number of active sites, which increased the effective electron conduction, extended the carrier life, and inhibited the recombination of photo-generated electrons and holes. These excellent properties enhanced the photocatalytic effect of semiconductor material.
3.4. Dark adsorption and photodegradation performance
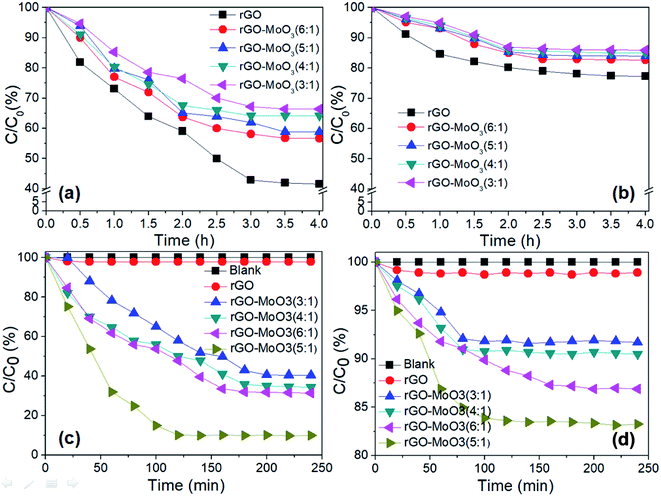
The adsorption performance of rGO-MoO3 aerogels and rGO aerogel under dark condition was shown in Fig. 7a and b. It could be seen from the dark adsorption experiment of rGO-MoO3 aerogels and rGO aerogel that, in the absence of light, the adsorption equilibrium state could be reached between the aerogel and MB solution for about 3 h, or between the aerogel and MO solution for about 2 h. It could be seen that the adsorption performance of rGO-MoO3 aerogels for MB and MO was lower than that of rGO aerogel. This was because MoO3 occupied the adsorption active site on rGO aerogel, and the number of active site greatly affected the adsorption performance of rGO-MoO3 aerogels on MB and MO. The adsorption performance of rGO-MoO3 aerogels and rGO aerogel for MB was higher than that for MO. This was because MB was a cationic dye. The synergy between dye molecules and rGO-MoO3 aerogels could promote the adsorption of MB by rGO-MoO3 aerogels by virtue of electrostatic adsorption and π–π conjugate effect.31,32 On the contrary, MO was an anion dye, and there was electrostatic repulsion between dye molecules and rGO-MoO3 aerogels, so rGO-MoO3 aerogels had a stronger adsorption capacity for MB than for MO.Fig. 7c and d showed the photocatalytic diagrams of rGO-MoO3 aerogels and rGO aerogel on MB and MO. It could be seen from Fig. 7c and d that in the absence of catalyst, the two dyes were very stable under visible light and would not degrade. rGO aerogel had very little photodegradation performance for both MB and MO after photoreaction for 240 min. rGO-MoO3 aerogels hardly degraded MO in any ratio, and the maximum degradation of MO by rGO-MoO3 (5![[thin space (1/6-em)]](https://www.rsc.org/images/entities/char_2009.gif) :
:![[thin space (1/6-em)]](https://www.rsc.org/images/entities/char_2009.gif) 1) aerogel was 16.8%. In visible light, the photodegradation performance of rGO-MoO3 aerogels on MB was relatively high, and the degradation efficiency of rGO-MoO3 (5
1) aerogel was 16.8%. In visible light, the photodegradation performance of rGO-MoO3 aerogels on MB was relatively high, and the degradation efficiency of rGO-MoO3 (5![[thin space (1/6-em)]](https://www.rsc.org/images/entities/char_2009.gif) :
:![[thin space (1/6-em)]](https://www.rsc.org/images/entities/char_2009.gif) 1) aerogel on MB reached 90%. This indicated that MoO3 played a very important role in the photocatalytic efficiency of the whole material. An appropriate amount of MoO3 loading on rGO aerogel could effectively inhibit the recombination of photo-generated electron and hole, so as to improve the photocatalytic performance of rGO-MoO3 aerogels.
1) aerogel on MB reached 90%. This indicated that MoO3 played a very important role in the photocatalytic efficiency of the whole material. An appropriate amount of MoO3 loading on rGO aerogel could effectively inhibit the recombination of photo-generated electron and hole, so as to improve the photocatalytic performance of rGO-MoO3 aerogels.
Under the same condition, the photodegradation efficiency of rGO-MoO3 aerogels containing different amounts of MoO3 for the two dyes was compared, and it was known that rGO-MoO3 (5![[thin space (1/6-em)]](https://www.rsc.org/images/entities/char_2009.gif) :
:![[thin space (1/6-em)]](https://www.rsc.org/images/entities/char_2009.gif) 1) aerogel had the best degradation rate for both dyes within 240 min, especially for MB, which reached 90% at 120 min.
1) aerogel had the best degradation rate for both dyes within 240 min, especially for MB, which reached 90% at 120 min.
3.5. Recycling performance
In practical production, in order to be green and economical, the recycling performance of photocatalyst was studied. Due to the poor degradation effect of rGO-MoO3 aerogels on MO, only the cycling performance of rGO-MoO3 (5![[thin space (1/6-em)]](https://www.rsc.org/images/entities/char_2009.gif) :
:![[thin space (1/6-em)]](https://www.rsc.org/images/entities/char_2009.gif) 1) aerogel on MB photodegradation was analyzed in this experiment. At the end of each experiment, the catalyst was simply treated with deionized water and then freeze-dried for the next use. In the repeated experiment, the rGO-MoO3 (5
1) aerogel on MB photodegradation was analyzed in this experiment. At the end of each experiment, the catalyst was simply treated with deionized water and then freeze-dried for the next use. In the repeated experiment, the rGO-MoO3 (5![[thin space (1/6-em)]](https://www.rsc.org/images/entities/char_2009.gif) :
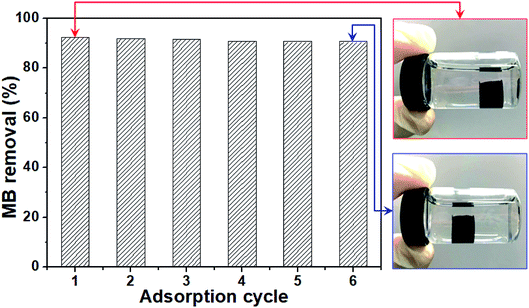
:![[thin space (1/6-em)]](https://www.rsc.org/images/entities/char_2009.gif) 1) aerogel could maintain the 3D structure integrity. The reaction process was suspended in solution with the large-area contact with MB, and the light could be well used (photo in Fig. 8). As shown in Fig. 8, after six cycles of use, the degradation efficiencies of rGO-MoO3 (5
1) aerogel could maintain the 3D structure integrity. The reaction process was suspended in solution with the large-area contact with MB, and the light could be well used (photo in Fig. 8). As shown in Fig. 8, after six cycles of use, the degradation efficiencies of rGO-MoO3 (5![[thin space (1/6-em)]](https://www.rsc.org/images/entities/char_2009.gif) :
:![[thin space (1/6-em)]](https://www.rsc.org/images/entities/char_2009.gif) 1) aerogel to MB were 92.3%, 91.9%, 91.6%, 90.8%, 90.7% and 90.7%, respectively.
1) aerogel to MB were 92.3%, 91.9%, 91.6%, 90.8%, 90.7% and 90.7%, respectively.
3D reticular rGO-MoO3 aerogel could be suspended in reaction solution due to its excellent structure and low density (photo in Fig. 8), so that rGO-MoO3 aerogel could fully contact with dye solution and make full use of visible light source. Moreover, this suspension system also enabled photocatalysis to realize recycling and regeneration in practical application. With high catalytic performance and simple cycle process, rGO-MoO3 (5![[thin space (1/6-em)]](https://www.rsc.org/images/entities/char_2009.gif) :
:![[thin space (1/6-em)]](https://www.rsc.org/images/entities/char_2009.gif) 1) aerogel had a great prospect in practical application.
1) aerogel had a great prospect in practical application.
3.6. Degradation mechanism
rGO aerogel could be used as a photocatalyst carrier due to the strong π–π effect between rGO and metal oxide.33 rGO aerogel had a large specific surface area and could provide a large number of active sites. rGO aerogel could act as electron trap and transfer medium. Since MoO3 was a layered structure composed of weak covalent bond connected to each other, these layers could be separated by mechanical action and strong light, thereby generating more photoelectric reaction.In order to confirm the hypothesis, EPR measurements were used.34–39 The EPR spectra of rGO aerogel, MoO3 and rGO-MoO3 (5![[thin space (1/6-em)]](https://www.rsc.org/images/entities/char_2009.gif) :
:![[thin space (1/6-em)]](https://www.rsc.org/images/entities/char_2009.gif) 1) aerogel were shown in Fig. 9a. From Fig. 9a, it was clear that the rGO aerogel and MoO3 did not show EPR signal while the EPR signal of rGO-MoO3 (5
1) aerogel were shown in Fig. 9a. From Fig. 9a, it was clear that the rGO aerogel and MoO3 did not show EPR signal while the EPR signal of rGO-MoO3 (5![[thin space (1/6-em)]](https://www.rsc.org/images/entities/char_2009.gif) :
:![[thin space (1/6-em)]](https://www.rsc.org/images/entities/char_2009.gif) 1) aerogel was observed. The EPR signal of rGO-MoO3 (5
1) aerogel was observed. The EPR signal of rGO-MoO3 (5![[thin space (1/6-em)]](https://www.rsc.org/images/entities/char_2009.gif) :
:![[thin space (1/6-em)]](https://www.rsc.org/images/entities/char_2009.gif) 1) aerogel consisted of six hyperfine lines, suggesting the existence of paramagnetic centers.38,39 For rGO-MoO3 (5
1) aerogel consisted of six hyperfine lines, suggesting the existence of paramagnetic centers.38,39 For rGO-MoO3 (5![[thin space (1/6-em)]](https://www.rsc.org/images/entities/char_2009.gif) :
:![[thin space (1/6-em)]](https://www.rsc.org/images/entities/char_2009.gif) 1) aerogel, the g values corresponding to three distinct anisotropic lines at g1, g2 and g3 were calculated to be 2.082, 2.013 and 1.951, respectively.38,39 The g1 and g2 might be attributed to the O− as paramagnetic center, and the g3 was related to the Mo5+ as paramagnetic center.38,39 The presence of Mo5+ in rGO-MoO3 (5
1) aerogel, the g values corresponding to three distinct anisotropic lines at g1, g2 and g3 were calculated to be 2.082, 2.013 and 1.951, respectively.38,39 The g1 and g2 might be attributed to the O− as paramagnetic center, and the g3 was related to the Mo5+ as paramagnetic center.38,39 The presence of Mo5+ in rGO-MoO3 (5![[thin space (1/6-em)]](https://www.rsc.org/images/entities/char_2009.gif) :
:![[thin space (1/6-em)]](https://www.rsc.org/images/entities/char_2009.gif) 1) aerogel indicated the presence of oxygen vacancy.
1) aerogel indicated the presence of oxygen vacancy.
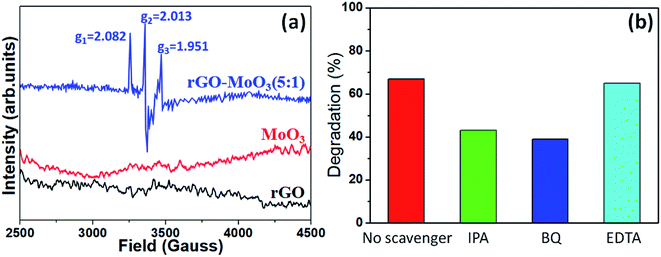 | ||
Fig. 9 (a) EPR signals of rGO aerogel, MoO3 and rGO-MoO3 (5![[thin space (1/6-em)]](https://www.rsc.org/images/entities/char_2009.gif) : :![[thin space (1/6-em)]](https://www.rsc.org/images/entities/char_2009.gif) 1) aerogel recorded at room temperature. (b) Effects of scavengers (IPA, BQ and EDTA) on the degradation efficiency of MB dye for 90 min. 1) aerogel recorded at room temperature. (b) Effects of scavengers (IPA, BQ and EDTA) on the degradation efficiency of MB dye for 90 min. | ||
By performing similar measurements, the reactive species involving in the degradation of dye were determined with adding quenchers (e.g., IPA as OH scavenger, BQ as O2− scavenger, and EDTA as h+ scavenger). Fig. 9b demonstrated the effects of three quenchers on the photodegradation efficiency of rGO-MoO3 (5![[thin space (1/6-em)]](https://www.rsc.org/images/entities/char_2009.gif) :
:![[thin space (1/6-em)]](https://www.rsc.org/images/entities/char_2009.gif) 1) aerogel. It was noted that EDTA (h+ scavenger) did not much affect the degradation efficiency of sample. However, the IPA (OH˙ scavenger) and BQ (˙O2− scavenger) caused to decrease the degradation efficiency of catalyst. Thus, we concluded that the OH˙ and ˙O2− radicals were the main reactive species involving in the degradation of dye.
1) aerogel. It was noted that EDTA (h+ scavenger) did not much affect the degradation efficiency of sample. However, the IPA (OH˙ scavenger) and BQ (˙O2− scavenger) caused to decrease the degradation efficiency of catalyst. Thus, we concluded that the OH˙ and ˙O2− radicals were the main reactive species involving in the degradation of dye.
In visible light, therefore, the diagram of optoelectronic production and conduction path of rGO-MoO3 aerogel was shown in Fig. S2.† The similar effects from mesopores and/or a hierarchical porosity for the as-prepared porous material were also reported in other report.40–43 Under the excitation of visible light, the MoO3 loading on the rGO lamella produced electrons and holes. rGO capture guided on electronic, and electrons and holes could be effectively separated, thus inhibiting the restructuring of charge carrier and improving the activity of catalyst.40–43
Degradation mechanism could be expressed by the following formula:
| α-MoO3 + hν → α-MoO3 + h+ + e− |
| h+ + H2O → OH˙ + H+ (oxidation) |
| e− + O2 → ˙O2− (reduction) |
| ˙O2− + H+ → HO2− + OH− |
| H2O + H2O → H2O2 + H+ → 2OH− |
| ˙O2− + H2O → OH− |
| OH˙ + organic molecules → degradation products |
| ˙O2− + organic molecules → degradation products |
4. Conclusions
The rGO-MoO3 aerogels successfully prepared through chemical reduction assembly mainly contained large pores, almost without micropores or mesoporous. The mean pore diameters of rGO aerogel, rGO-MoO3 (3![[thin space (1/6-em)]](https://www.rsc.org/images/entities/char_2009.gif) :
:![[thin space (1/6-em)]](https://www.rsc.org/images/entities/char_2009.gif) 1) aerogel, rGO-MoO3 (4
1) aerogel, rGO-MoO3 (4![[thin space (1/6-em)]](https://www.rsc.org/images/entities/char_2009.gif) :
:![[thin space (1/6-em)]](https://www.rsc.org/images/entities/char_2009.gif) 1) aerogel, rGO-MoO3 (5
1) aerogel, rGO-MoO3 (5![[thin space (1/6-em)]](https://www.rsc.org/images/entities/char_2009.gif) :
:![[thin space (1/6-em)]](https://www.rsc.org/images/entities/char_2009.gif) 1) aerogel and rGO-MoO3 (6
1) aerogel and rGO-MoO3 (6![[thin space (1/6-em)]](https://www.rsc.org/images/entities/char_2009.gif) :
:![[thin space (1/6-em)]](https://www.rsc.org/images/entities/char_2009.gif) 1) aerogel were 97.8, 118.7, 134.5, 144.8 and 132.1 nm, respectively. The light absorption intensity of rGO-MoO3 (6
1) aerogel were 97.8, 118.7, 134.5, 144.8 and 132.1 nm, respectively. The light absorption intensity of rGO-MoO3 (6![[thin space (1/6-em)]](https://www.rsc.org/images/entities/char_2009.gif) :
:![[thin space (1/6-em)]](https://www.rsc.org/images/entities/char_2009.gif) 1) aerogel was higher than those of other rGO-MoO3 aerogels, and its absorption spectrum had obvious red shift. The presence of rGO increased the absorption spectrum range and active site of the rGO-MoO3 aerogel, thus enhancing its electron conduction, prolonging carrier life and inhibiting electron and hole recombination, and improving the photocatalytic efficiency of the rGO-MoO3 aerogel. rGO-MoO3 aerogels had very low density and good mechanical properties, and would not deform under more than 1000 times of its own pressure.
1) aerogel was higher than those of other rGO-MoO3 aerogels, and its absorption spectrum had obvious red shift. The presence of rGO increased the absorption spectrum range and active site of the rGO-MoO3 aerogel, thus enhancing its electron conduction, prolonging carrier life and inhibiting electron and hole recombination, and improving the photocatalytic efficiency of the rGO-MoO3 aerogel. rGO-MoO3 aerogels had very low density and good mechanical properties, and would not deform under more than 1000 times of its own pressure.
rGO-MoO3 aerogels had good adsorption and photocatalytic degradation effect on MB, but the adsorption and degradation effect of them on MO were not obvious. Among them, rGO-MoO3 (5![[thin space (1/6-em)]](https://www.rsc.org/images/entities/char_2009.gif) :
:![[thin space (1/6-em)]](https://www.rsc.org/images/entities/char_2009.gif) 1) aerogel showed the best degradation effect on MB, displaying high degradation efficiency on MB within 120 min. After six cycles of recycling, the degradation rate of MB decreased by only 1.6%. The hydroxyl radical (OH˙) and radical anion (˙O2−) played an important role in the photodegradation of dye. With high catalytic performance and simple cycle process, rGO-MoO3 aerogels had a great prospect in practical dye degradation application.
1) aerogel showed the best degradation effect on MB, displaying high degradation efficiency on MB within 120 min. After six cycles of recycling, the degradation rate of MB decreased by only 1.6%. The hydroxyl radical (OH˙) and radical anion (˙O2−) played an important role in the photodegradation of dye. With high catalytic performance and simple cycle process, rGO-MoO3 aerogels had a great prospect in practical dye degradation application.
Conflicts of interest
The authors declare that they have no conflict of interest.Acknowledgements
The authors acknowledged financial support from the Foundation of Science and Technology Projects of Guangdong Province (No. 2016A010103047), the Natural Science Foundation of Hunan Province (No. 2019JJ60062), the Science and Technology Innovation Platform Project of Foshan City (2016AG100541, 2017AG100092), the Foshan Technology Research Center (2016GA10161), the Science and Technology Innovation Project of Foshan City (2017AA100161), the Project supported by GDHVPS (2017), the Provincial Key Platform and Major Scientific Research Project of Guangdong College (2017GkQNCX013), the Science and Technology Project of Guangdong Polytechnic (K201713), and the Undergraduate Scientific and Technological Innovation Cultivation Special Fund Project of Guangdong Province (pdjh2019b0721).References
- M. Barlow and T. Clarke, Blue gold: the battle against corporate theft of the world's water, Routledge, 2017 Search PubMed.
- J. Gupta and C. Vegelin, Int. Environ. Agreem.-P., 2016, 16, 433–448 CrossRef.
- G. Rasul, Environmental Development, 2016, 18, 14–25 CrossRef.
- A. K. Yadav, S. Jena, B. C. Acharya and B. K. Mishra, Ecol. Eng., 2012, 49, 53–58 CrossRef.
- A. E. Ghaly, R. Ananthashankar, M. Alhattab and V. V. Ramakrishnan, J. Chem. Eng. Process Technol., 2014, 5, 1–18 Search PubMed.
- N. S. Ngieng, A. Zulkharnain, H. A. Roslan and A. Husaini, ISRN Biotechnol., 2013, 2013, 260730 Search PubMed.
- Y. G. Habba, M. Capochichi-Gnambodoe, L. Serairi and Y. Leprince-Wang, Phys. Status Solidi B, 2016, 253, 1480–1484 CrossRef CAS.
- W. P. Low, M. F. M. Din, M. Ponraj, M. A. Fulazzaky, K. Iwao, A. R. Songip and S. Chelliapan, Desalin. Water Treat., 2015, 53, 1342–1351 CAS.
- R. Saravanan, M. M. Khan, V. K. Gupta, E. Mosquera, F. Gracia, V. Narayanan and A. Stephen, J. Colloid Interface Sci., 2015, 452, 126–133 CrossRef CAS PubMed.
- E. Hu and S. Shang, Molecules, 2019, 24, 2755 CrossRef PubMed.
- Z. Naseem, H. N. Bhatti, M. Iqbal, S. Noreen and M. Zahid, Textiles and Clothing: Environmental Concerns and Solutions, 2019, p. 235 Search PubMed.
- M. Wawrzkiewicz, E. Polska-Adach and Z. Hubicki, Sep. Sci. Technol., 2019, 1–15 CrossRef CAS.
- S. Hoseinzadeh, R. Ghasemiasl, A. Bahari and A. H. Ramezani, J. Mater. Sci.: Mater. Electron., 2017, 28, 14446–14452 CrossRef CAS.
- C. L. Yang, X. W. Zhong, Y. Jiang and Y. Yu, Chin. Chem. Lett., 2017, 28, 2231–2234 CrossRef CAS.
- X. M. Zhang, K. Z. Li, H. J. Li, J. H. Lu and L. L. Zhang, Nano, 2016, 11, 1650036 CrossRef CAS.
- R. Giardi, S. Porro, T. Topuria, L. Thompson, C. Fabrizio, C. F. Pirri and H. C. Kim, Appl. Mater. Today, 2015, 1, 27–32 CrossRef.
- J. Reszczynska, T. Grzyb, J. W. Sobczak, W. Lisowski, M. Gazda, B. Ohtani and A. Zaleska, Appl. Catal., B, 2015, 163, 40–49 CrossRef CAS.
- A. Barras, M. R. Das, R. R. Devarapalli, M. V. Shelke, S. Cordier, S. Szunerits and R. Boukherroub, Appl. Catal., B, 2013, 130, 270–276 CrossRef.
- I. Ghaffar, M. F. Warsi, M. Shahid and I. Shakir, Phys. E, 2016, 79, 1–7 CrossRef CAS.
- L. Y. Huang, H. Xu, R. X. Zhang, X. N. Cheng, J. X. Xia, Y. G. Xu and H. M. Li, Appl. Surf. Sci., 2013, 283, 25–32 CrossRef CAS.
- M. B. R. Kamalam, S. S. R. Inbanathan and K. Sethuraman, Appl. Surf. Sci., 2018, 449, 685–696 CrossRef CAS.
- X. C. Zheng, N. Li, S. Jiang, M. Wu and G. P. Zheng, J. Porous Mater., 2019, 26, 733 CrossRef.
- W. J. Han, C. Zang, Z. Y. Huang, H. Zhang, L. Ren, X. Qi and J. X. Zhong, Int. J. Hydrogen Energy, 2014, 39, 19502–19512 CrossRef CAS.
- G. Gorgolis and C. Galiotis, 2D Mater., 2017, 4, 032001 CrossRef.
- Z. W. Tong, D. Yang, J. F. Shi, Y. H. Nan, Y. Y. Sun and Z. Y. Jiang, ACS Appl. Mater. Interfaces, 2015, 7, 25693–25701 CrossRef CAS PubMed.
- Y. Y. Zhang, X. R. Yan, Y. Y. Yan, D. J. Chen, L. H. Huang, J. X. Zhang, Y. Ke and S. Z. Tan, RSC Adv., 2018, 8, 4239–4248 RSC.
- X. Cai, S. Z. Tan, M. S. Lin, A. Xie, W. J. Mai, X. J. Zhang, Z. D. Lin, T. Wu and Y. L. Liu, Langmuir, 2011, 27, 7828–7835 CrossRef CAS PubMed.
- D. P. Debecker, B. Schimmoeller, M. Stoyanova, C. Poleunis, P. Bertrand, U. Rodemerck and E. M. Gaigneaux, J. Catal., 2011, 277, 154–163 CrossRef CAS.
- R. Q. Tan, Y. He, Y. F. Zhu, B. Q. Xu and L. L. Cao, J. Mater. Sci., 2003, 38, 3973–3978 CrossRef CAS.
- S. L. Bai, C. Chen, M. Cui, R. X. Luo, A. F. Chen and D. Q. Li, RSC Adv., 2015, 5, 50783–50789 RSC.
- T. Wu, X. Cai, S. Tan, H. Li, J. Liu and W. Yang, Chem. Eng. J., 2011, 173, 144–149 CrossRef CAS.
- T. Wu, Z. M. Wu, D. Ma, W. B. Xiang, J. L. Zhang, H. D. Liu, Y. L. Deng, S. Z. Tan and X. Cai, Langmuir, 2018, 34, 15181–15188 CrossRef CAS PubMed.
- X. Cai, B. Zhang, L. Shi, H. D. Liu, J. L. Zhang, L. H. Huang and S. Z. Tan, Desalin. Water Treat., 2016, 57, 6365–6371 CrossRef CAS.
- W. W. Zhong, S. J. Shen, M. He, D. Wang, Z. P. Wang, Z. P. Lin, W. G. Tu and J. G. Yu, Appl. Catal., B, 2019, 258, 117967 CrossRef CAS.
- W. W. Zhong, W. G. Tu, S. S. Feng and A. J. Xu, J. Alloy. Compd., 2019, 772, 669–674 CrossRef CAS.
- W. W. Zhong, S. J. Shen, S. S. Feng, Z. P. Lin, Z. P. Wang and B. Z. Fang, CrystEngComm, 2018, 20, 7851–7856 RSC.
- W. W. Zhong, Z. P. Lin, S. S. Feng, D. Wang, S. J. Shen, Q. H. Zhang, L. Gu, Z. P. Wang and B. Z. Fang, Nanoscale, 2019, 11, 4407–4413 RSC.
- A. Singh, S. Kumar, B. Ahmed, R. K. Singh and A. K. Ojha, J. Alloys Compd., 2019, 806, 1368–1376 CrossRef CAS.
- S. Bai, S. Chen, L. Chen, K. Zhang, R. Luo, D. Li and C. C. Liu, Sens. Actuators, B, 2012, 174, 51–58 CrossRef CAS.
- B. Z. Fang, A. Bonakdarpour, K. Reilly, Y. L. Xing, F. Taghipour and D. P. Wilkinson, ACS Appl. Mater. Interfaces, 2014, 6, 15488–15498 CrossRef CAS PubMed.
- B. Z. Fang, Y. L. Xing, A. Bonakdarpour, S. C. Zhang and D. P. Wilkinson, ACS Sustainable Chem. Eng., 2015, 3, 2381–2388 CrossRef CAS.
- B. Fang, J. H. Kim, M. S. Kim and J. S. Yu, Acc. Chem. Res., 2013, 46, 1397–1406 CrossRef CAS PubMed.
- J. H. Kim, B. Fang, M. Kim and J. S. Yu, Catal. Today, 2009, 146, 25–30 CrossRef CAS.
Footnotes |
| † Electronic supplementary information (ESI) available. See DOI: 10.1039/c9ra08372c |
| ‡ T. Wu and B. Zhang contributed equally to this article. |
| This journal is © The Royal Society of Chemistry 2019 |

