 Open Access Article
A solvent-dependent chemosensor for fluorimetric detection of Hg2+ and colorimetric detection of Cu2+ based on a new diarylethene with a rhodamine B unit†
Heng Zhao,
Haichang Ding,
Huimin Kang,
Congbin Fan ,
Gang Liu
 * and
Shouzhi Pu*
Jiangxi Key Laboratory of Organic Chemistry, Jiangxi Science and Technology Normal University, Nanchang, Jiangxi 330013, PR China. E-mail: liugang0926@163.com; pushouzhi@tsinghua.org.cn; Fax: +86-791-83831996; Tel: +86-791-83831996
First published on 19th December 2019
Abstract
A novel solvent-dependent chemosensor 1o based on a diarylethene containing a rhodamine B unit has been designed. It could be used as a dual-functional chemosensor for selective detection of Hg2+ and Cu2+ by monitoring the changes in the fluorescence and UV-vis spectral in different solvents. A striking fluorescence enhancement at 617 nm was observed in DMSO upon the addition of Hg2+. However, 1o showed a remarkable absorption band appeared with maximum absorption at 555 nm after the addition of Cu2+ in THF. The results of ESI-MS spectra and Job's plot confirmed a 1![[thin space (1/6-em)]](https://www.rsc.org/images/entities/char_2009.gif) :
:![[thin space (1/6-em)]](https://www.rsc.org/images/entities/char_2009.gif) 1 binding stoichiometry between 1o and the two ions. The limits of detection of Hg2+ and Cu2+ were determined to be 0.14 μM and 0.51 μM, respectively. A 1
1 binding stoichiometry between 1o and the two ions. The limits of detection of Hg2+ and Cu2+ were determined to be 0.14 μM and 0.51 μM, respectively. A 1![[thin space (1/6-em)]](https://www.rsc.org/images/entities/char_2009.gif) :
:![[thin space (1/6-em)]](https://www.rsc.org/images/entities/char_2009.gif) 2 demultiplexer circuit was constructed by using UV light as data input, Cu2+ as the address input, and the absorbance at 555 nm and the absorbance ratio of (A603/A274) as the dual data outputs.
2 demultiplexer circuit was constructed by using UV light as data input, Cu2+ as the address input, and the absorbance at 555 nm and the absorbance ratio of (A603/A274) as the dual data outputs.
Introduction
In recent decades chemosensors for selective detection of a wide variety of metal ions have attracted increasing attention due to their potential practical advantages in analytical, biomedical, and environmental chemistry.1,2 Among metal ions, Hg2+ is considered to be one of the most dangerous and toxic pollutants in the environment and biosphere even in low concentration, because its strong affinity to thiol groups present in proteins and enzymes, can causes the dysfunction of most proteins and enzymes.3–5 Moreover, Hg2+ can be accumulated in the body, and easily penetrate through biological membranes, such as skin, gastrointestinal and respiratory tissues,6 causing various types of diseases like central nervous system defects, arrhythmia, kidney damage, minamata disease, and cardiomyopathy.7 On the other hand, the third most abundant essential heavy metal ion (after iron and zinc) present in the human body Cu2+ plays a critical role in the physiology of living organisms, its deficiency can lead to a wide range of diseases including anemia, coronary heart disease, hypopigmentation, brain dysfunction and various neurological diseases.8–11 However, an excessive intake of Cu2+ will disturb the cellular homeostasis and lead to many serious neurodegenerative diseases, such as Alzheimer's disease, Wilson's disease, Parkinson's diseases, and prion diseases.12–15 Thus, the development of sensitive and selective imaging tools for effective and convenient detection of Hg2+ and Cu2+ is of great significance for biochemistry and environmental science.In recent years, diarylethenes have been widely nominated as one of the most attractive photochromic molecules, when they are stimulated by photo irradiation can undergo a reversible transition between open-ring and closed-ring forms with significant changes of absorption/emission spectrum, it is possible to introduce a recognizing group into the diarylethene structure to achieve a fluorescence switch.16–21 Some of diarylethene-based chemosensors for the detection of a wide species of ions have already been reported.22–24 For example, Fu et al. reported a fluorescence chemosensor for detecting Zn2+ based on a new diarylethene with a benzyl-linked 8-aminoquinoline-2-aminomethylpyridine unit.25 Rhodamine and its derivatives have gained tremendous interest in the field of biosensors because of their advantages such as broad emission wavelength, high fluorescence quantum yield, and large extinction coefficient.26–28 Generally speaking, rhodamine derivatives with spirolactam structure are non-fluorescent and colorless. Interestingly, upon binding with protons or metal ions they become strongly fluorescent and produce intense color because of ring-opened structure.29 Therefore, rhodamine derivatives have been widely applied to design chemosensors for naked-eye detecting metal ions.30 Recently, we have reported a diarylethene-based fluorescent sensor with a rhodamine group which exhibited excellent fluorescence regulation and ion recognition.31 Nevertheless, most studies in the field of rhodamine-based sensors have only focused on identifying a single metal ion in a single solvent system, only a few sensors have the ability to identify different metal ions in different solvent systems.28 Thus, the design and synthesize rhodamine-based sensors that have the ability to identify different metal ions in different solvent systems are still a challenge.
In this work, we developed a novel diarylethene-based chemosensor containing a rhodamine B unit for simultaneous Hg2+ and Cu2+ detection. The chemosensor 1o displayed a selective colorimetric response to Cu2+ with a naked-eye-detectable color change from colorless to pink in THF, while it also showed a fluorometric response selectively to Hg2+ with a fluorescent change of color from dark to orange-red in DMSO. Moreover, 1o exhibited excellent photochromic performance under alternate irradiation with UV light and visible light, and it had been successfully applied to construct a 1![[thin space (1/6-em)]](https://www.rsc.org/images/entities/char_2009.gif) :
:![[thin space (1/6-em)]](https://www.rsc.org/images/entities/char_2009.gif) 2 demultiplexer circuit. The photochromism of 1o was presented in Scheme 1.
2 demultiplexer circuit. The photochromism of 1o was presented in Scheme 1.
Experimental
General methods
All reagents and solvents were obtained from J&K Scientific Ltd. (Beijing China). NMR spectra of samples were recorded on Bruker AV400 (400 MHz) in DMSO-d6 or THF-d8 solution using tetramethylsilane (TMS) as an internal standard. Mass spectrum was recorded on a Bruker Amazon SL Ion Trap Mass Spectrometer under ESI mode. Melting point was measured on a WRS-1B melting point apparatus. The fluorescence quantum yield was obtained with an Edinburgh FLS 1000 fluorescence spectrometer. All the emission spectra were recorded using a Hitachi F-4600 spectrofluorimeter and all the absorption spectra were recorded using an Agilent 8454 UV/vis spectrophotometer.Synthesis
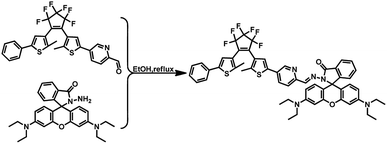
The synthetic protocol of diarylethene (1o) was outlined in Scheme 2. Compounds 2 and 3 were readily synthesized in high yields according to literature procedures.32,33![[thin space (1/6-em)]](https://www.rsc.org/images/entities/char_2009.gif) :
:![[thin space (1/6-em)]](https://www.rsc.org/images/entities/char_2009.gif) 1) to afford pure blue solid of 1o (0.13 g, 0.13 mmol, 66% yield). Mp: 409–411 K. 1H NMR (DMSO-d6, 400 MHz): δ (ppm) 8.81 (s, 1H), 8.41 (s, 1H), 8.10 (d, J = 8.1 Hz, 1H), 8.02 (d, J = 7.4 Hz, 1H), 7.83 (d, J = 8.4 Hz, 1H), 7.76–7.60 (m, 5H), 7.55 (s, 1H), 7.48 (t, J = 7.5 Hz, 2H), 7.41 (d, J = 7.5 Hz, 1H), 7.16 (d, J = 7.5 Hz, 1H), 6.52 (d, J = 12.5 Hz, 4H), 6.40 (d, J = 9.0 Hz, 2H), 3.37 (d, J = 7.3 Hz, 8H), 2.06 (s, 3H), 2.03 (s, 3H), 1.13 (t, J = 6.8 Hz, 12H) (Fig. S1†). 13C NMR (DMSO-d6, 100 MHz), δ (ppm): 164.67, 153.01, 152.86, 152.32, 149.17, 146.22, 145.14, 143.30, 142.25, 141.72, 138.07, 134.82, 133.69, 132.97, 129.70, 129.30, 128.62, 128.09, 127.90, 125.78, 125.33, 125.02, 124.24, 123.70, 123.02, 119.87, 116.21, 108.69, 105.29, 97.97, 65.65, 44.11, 14.53, 12.89. ESI-MS (m/z): 1010.1 [M + Na+]+ (Fig. S2†). Anal. calcd for C55H47F6N5O2S2 (%): C, 66.85; H, 4.79; N, 7.09; O, 3.24. Found: C, 66.98; H, 4.78; N, 7.11; O, 3.25.
1) to afford pure blue solid of 1o (0.13 g, 0.13 mmol, 66% yield). Mp: 409–411 K. 1H NMR (DMSO-d6, 400 MHz): δ (ppm) 8.81 (s, 1H), 8.41 (s, 1H), 8.10 (d, J = 8.1 Hz, 1H), 8.02 (d, J = 7.4 Hz, 1H), 7.83 (d, J = 8.4 Hz, 1H), 7.76–7.60 (m, 5H), 7.55 (s, 1H), 7.48 (t, J = 7.5 Hz, 2H), 7.41 (d, J = 7.5 Hz, 1H), 7.16 (d, J = 7.5 Hz, 1H), 6.52 (d, J = 12.5 Hz, 4H), 6.40 (d, J = 9.0 Hz, 2H), 3.37 (d, J = 7.3 Hz, 8H), 2.06 (s, 3H), 2.03 (s, 3H), 1.13 (t, J = 6.8 Hz, 12H) (Fig. S1†). 13C NMR (DMSO-d6, 100 MHz), δ (ppm): 164.67, 153.01, 152.86, 152.32, 149.17, 146.22, 145.14, 143.30, 142.25, 141.72, 138.07, 134.82, 133.69, 132.97, 129.70, 129.30, 128.62, 128.09, 127.90, 125.78, 125.33, 125.02, 124.24, 123.70, 123.02, 119.87, 116.21, 108.69, 105.29, 97.97, 65.65, 44.11, 14.53, 12.89. ESI-MS (m/z): 1010.1 [M + Na+]+ (Fig. S2†). Anal. calcd for C55H47F6N5O2S2 (%): C, 66.85; H, 4.79; N, 7.09; O, 3.24. Found: C, 66.98; H, 4.78; N, 7.11; O, 3.25.Results and discussion
Photochromism of 1o
Determination of photochromic properties of 1o (20 μM) in THF. As shown in Fig. 1, owing to the π–π* transition, its ring-opening form isomer showed an absorption peak at 348 nm.34 A new absorption band centered at 603 nm appeared along with a color change from colorless to blue upon the irradiation with 297 nm light, which was assigned to the formation of the ring-closed isomer 1c with π-electron delocalization enhancement through the molecular backbone.35 Under irradiation using visible light of λ > 500 nm, 1c blue solution could be bleached to colorless, and its absorption peak 348 nm return to the original state. The isobestic point observed at 366 nm, which suggested a two-component photochromic nature. The quantum yields of the cyclization and cyclization reactions for the determination of 1o were 0.54 and 0.02, respectively.36 The fatigue resistance of 1o indicates that for alternating ultraviolet/visible irradiations, 1o was only reduced by 10.3% after coloring-discoloration cycles executed ten times (Fig. S3†).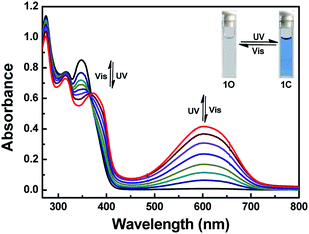 | ||
| Fig. 1 Absorption spectral and color changes of 1o (20 μM) in THF upon alternating irradiation with UV (λ = 297 nm) and visible lights (λ > 500 nm). | ||
Fluorescent spectra response of 1o to Hg2+
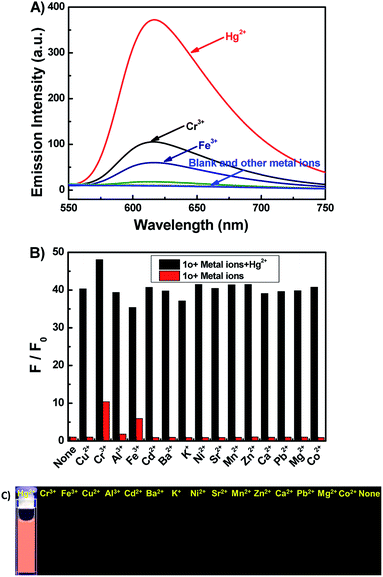
It has been reported that rhodamine B derivatives undergo significant changes in fluorescence spectra when coordinate with metal ions, and thus they can be used as sensitive probes for metal ion detection. The fluorescence spectra of 1o (20 μM) with 16 metal ions (Cu2+, Hg2+, Cr3+, Fe3+, Ni2+, Zn2+, Ca2+, Pb2+, Mg2+, Mn2+, Sr2+, K+, Ba2+, Cd2+, Al3+, and Co2+) was studied in DMSO. As depicted in Fig. 2A, compound 1o alone showed no significant emission signal at 520 nm excitation, however, the 1o's solution exhibited strong fluorescence with an approximate 34-fold enhancement in the fluorescence intensity at 617 nm upon the addition of 10.0 equiv. of Hg2+. Though the 1o also responded to Cr3+ and Fe3+, the fluorescence emission intensity only enhanced 10-fold and 6-fold at 617 nm, respectively. Other metal ions didn't cause detectable increase in the emission intensity (Fig. 2C). The result indicated that the 1o had a relatively higher binding affinity to Hg2+ than Cr3+ or Fe3+, and 1o can be potentially used as a chemosensor for detecting Hg2+ in DMSO. Further, the competitive experiments were conducted by adding Hg2+ to DMSO-solution of 1o in the presence of other metal ions. As a result, the Hg2+ induced spectral enhancement was not affected by the tested background metal ions (Fig. 2B).The fluorescence titration experiments were performed to survey sensitive property of 1o to Hg2+. As shown in Fig. 3A and B, free 1o displayed no fluorescent emission at 617 nm upon excitation at 520 nm. With increasing amounts of Hg2+ (0–10.0 equiv.), the fluorescent intensity gradually increased about 34-fold at 617 nm, accompanied with a fluorescence change of color from dark to orange-red. The absolute fluorescent quantum yield of 1o-Hg2+ (1o′) was measured to be 0.35. The spectral fitting of the fluorescence data obtained by titration experiments of 1o with Hg2+ shows the formation of 1![[thin space (1/6-em)]](https://www.rsc.org/images/entities/char_2009.gif) :
:![[thin space (1/6-em)]](https://www.rsc.org/images/entities/char_2009.gif) 1 stoichiometric 1o-Hg2+ complex with a binding constant 0.42 × 10⁴ M−1 (Fig. S4†).37 The detection limit of Hg2+ was determined to be 0.14 μM (Fig. S5†).38 Hence, 1o could be used as a fluorescence chemosensor to detect Hg2+ with high sensitivity.
1 stoichiometric 1o-Hg2+ complex with a binding constant 0.42 × 10⁴ M−1 (Fig. S4†).37 The detection limit of Hg2+ was determined to be 0.14 μM (Fig. S5†).38 Hence, 1o could be used as a fluorescence chemosensor to detect Hg2+ with high sensitivity.
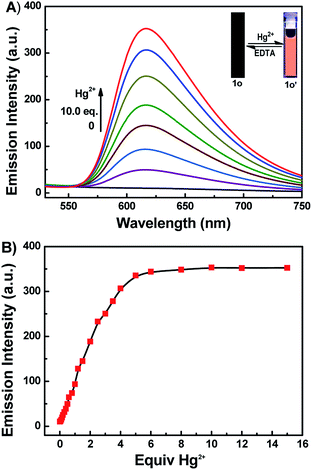 | ||
| Fig. 3 (A) Fluorescence spectra changes of 1o in DMSO induced by Hg2+/EDTA. (B) Fluorescence intensity at 617 nm versus equivalents of Hg2+ added. | ||
The fluorescent intensity and color of 1o-Hg2+ could restore the initial state by the addition of EDTA (10.0 equiv.), attesting the reversibility for the coordination of 1o with Hg2+. Also noteworthy is that complex 1o-Hg2+ showed excellent photoswitching properties under alternate UV/vis irradiation. Upon irradiation with 297 nm UV light, the fluorescence emission intensity of 1o-Hg2+ complex was quenched 73.6% due to the formation of the weak fluorescent isomer 1c-Hg2+ (1c′) (Fig. S6†). Upon being illuminated with visible light, the fluorescent intensity of 1o-Hg2+ could be restored. Based on these features, a dual-responsive and reversible fluorescent molecular switch could be constructed (Scheme 3).
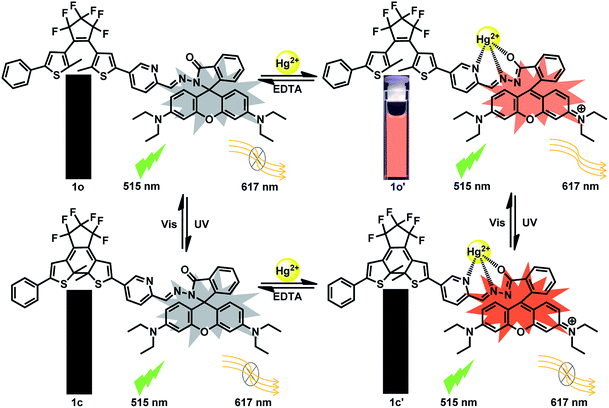 | ||
| Scheme 3 Dual-controlled fluorescent switching behavior of 1o induced by the stimulation of Hg2+/EDTA and UV/vis light. | ||
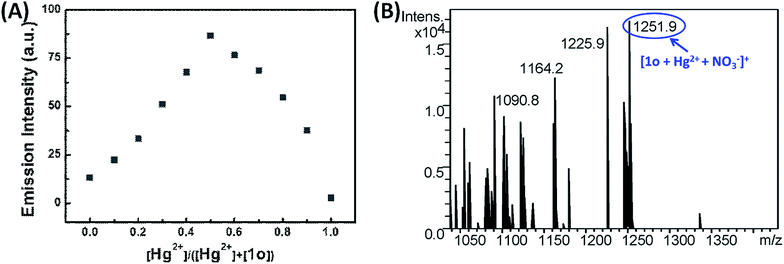
To further investigate the stoichiometry of the 1o-Hg2+ complex, Job's plot experiment for fluorescence measurement was performed (Fig. 4A). The fluorescence reached a maximum value when the ratio of [1o]/[(1o) + (Hg2+)] was 0.5, indicating a 1![[thin space (1/6-em)]](https://www.rsc.org/images/entities/char_2009.gif) :
:![[thin space (1/6-em)]](https://www.rsc.org/images/entities/char_2009.gif) 1 binding stoichiometry between Hg2+ and 1o in the complex. Subsequently, the ESI-MS analyses were performed to further verify the complexation stoichiometry of 1o and Hg2+ (Fig. 4B). A new peak at m/z = 1251.9 corresponding to [1o + Hg2+ + NO3−]+ was observed after the addition of Hg2+ to the solution of 1o. This result also supported that 1o and Hg2+ formed a 1
1 binding stoichiometry between Hg2+ and 1o in the complex. Subsequently, the ESI-MS analyses were performed to further verify the complexation stoichiometry of 1o and Hg2+ (Fig. 4B). A new peak at m/z = 1251.9 corresponding to [1o + Hg2+ + NO3−]+ was observed after the addition of Hg2+ to the solution of 1o. This result also supported that 1o and Hg2+ formed a 1![[thin space (1/6-em)]](https://www.rsc.org/images/entities/char_2009.gif) :
:![[thin space (1/6-em)]](https://www.rsc.org/images/entities/char_2009.gif) 1 complex. 1H NMR titration experiments were employed to gain a deep understanding on the coordination between 1o and Hg2+ (Fig. S7†). Upon the addition of Hg2+, the proton peaks at 8.82, 8.14, 8.01 ppm for pyridine (Ha, Hc and Hd) and 8.28 ppm for CH
1 complex. 1H NMR titration experiments were employed to gain a deep understanding on the coordination between 1o and Hg2+ (Fig. S7†). Upon the addition of Hg2+, the proton peaks at 8.82, 8.14, 8.01 ppm for pyridine (Ha, Hc and Hd) and 8.28 ppm for CH![[double bond, length as m-dash]](https://www.rsc.org/images/entities/char_e001.gif) N (Hb) broadened and downfield shifted, owing to the decreasing of electron density after coordination with Hg2+.39 Herein, combined with our previous knowledge,40,41 we proposed a possible binding mode of Hg2+ with 1o (Fig. S7†).
N (Hb) broadened and downfield shifted, owing to the decreasing of electron density after coordination with Hg2+.39 Herein, combined with our previous knowledge,40,41 we proposed a possible binding mode of Hg2+ with 1o (Fig. S7†).
Colorimetric responses of 1o toward Cu2+
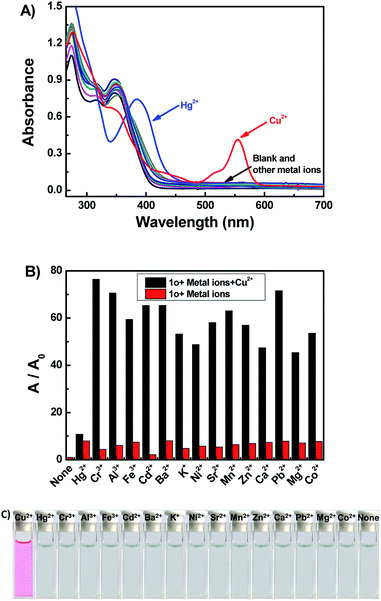
The colorimetric responses of 1o (20 μM) to different metal ions including Cu2+, Hg2+, Cr3+, Al3+, Fe3+, Cd2+, Ba2+, K+, Ni2+, Sr2+, Mn2+, Zn2+, Ca2+, Pb2+, Mg2+, and Co2+ were investigated in THF. The free 1o showed no absorption in the spectral range 500–600 nm, suggesting that the rhodamine moiety adopts a closed spirolactam form. As shown in Fig. 5A, with the addition of 10.0 equiv. of each kind of ions, only Cu2+ could induce a prominent change (a strong absorption at 555 nm). The color of 1o solution changed from colorless to pink upon the addition of Cu2+, which indicated the formation of 1o-Cu2+ (1o′′) with rhodamine moiety in ring-opened form (Fig. 5C).42 A series of competitive tests of the background metal ions were also carried out (Fig. 5B). The absorbance at 555 nm decreases almost to the initial state when the same amount of Hg2+ was added. The result revealed that Cu2+ detection by 1o was little affected by the presence of other metal ions except for Hg2+.To further investigate the sensing mechanism of 1o with Cu2+ ion, UV-vis absorption titration experiments were performed. Upon gradual addition of Cu2+ (0–10.0 equiv.), the absorption band centered at 555 nm gradually enhanced and reached a plateau when 10.0 equiv. of Cu2+ was added (Fig. 6A). The color of the 1o solution changes from colorless to pink, due to the formation of the 1o-Cu2+ (1o′′) complex. There was an isosbestic points at 329 nm demonstrate that the complexation reaction between Cu2+ and 1o exist in equilibrium.43 Furthermore, the absorbance and the solution color could be reverted to the initial state upon the addition of excess of EDTA. From the absorption titration experiments, the absorbances of 1o at 555 nm were plotted as a function of the Cu2+ concentration (Fig. 6B). Within the range of 0–30 μM, a linear relationship (Y = 0.00723X + 0.01803, R = 0.992) can be observed (Fig. S8†). The binding constant of 1o to Cu2+ was found to be 1.76 × 10⁴ M−1 (R = 0.999) (Fig. S9†). The detection limit for Cu2+ was estimated to be 0.51 μM (Fig. S10†).
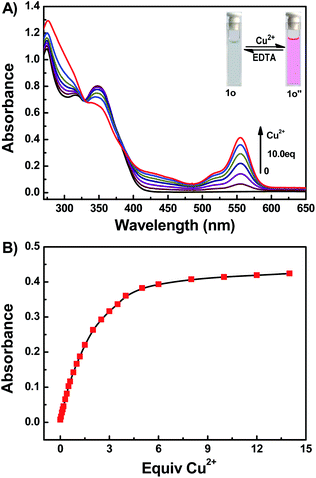 | ||
| Fig. 6 (A) Absorption spectra changes of 1o in THF induced by Cu2+/EDTA. (B) Absorption at 555 nm versus equivalents of Cu2+ added. | ||
To further ascertain the mechanism, Job's plot, ESI-MS and 1H NMR titration experiment were performed. The absorption intensity at 555 nm reached the maximum value when the molar fraction of Cu2+ and 1o was 0.5, which indicated that 1o bounded to Cu2+ with a 1![[thin space (1/6-em)]](https://www.rsc.org/images/entities/char_2009.gif) :
:![[thin space (1/6-em)]](https://www.rsc.org/images/entities/char_2009.gif) 1 stoichiometry (Fig. S11†). Further evidence for the 1
1 stoichiometry (Fig. S11†). Further evidence for the 1![[thin space (1/6-em)]](https://www.rsc.org/images/entities/char_2009.gif) :
:![[thin space (1/6-em)]](https://www.rsc.org/images/entities/char_2009.gif) 1 binding stoichiometry between Cu2+ and 1o was obtained by ESI-MS (Fig. S12†). Upon the addition of Cu2+, a new peak at m/z = 1112.0 corresponding to [1o + Cu2+ + NO3−]+ was observed, which also confirmed the 1
1 binding stoichiometry between Cu2+ and 1o was obtained by ESI-MS (Fig. S12†). Upon the addition of Cu2+, a new peak at m/z = 1112.0 corresponding to [1o + Cu2+ + NO3−]+ was observed, which also confirmed the 1![[thin space (1/6-em)]](https://www.rsc.org/images/entities/char_2009.gif) :
:![[thin space (1/6-em)]](https://www.rsc.org/images/entities/char_2009.gif) 1 stoichiometric ratio of Cu2+/1o. To better understand the interaction between 1o and Cu2+, 1H NMR titration experiments were performed (Fig. S13†). With the addition of Cu2+, the proton peaks at 9.03, 7.81, 7.71 ppm for pyridine (Ha, Hc and Hd) and 8.59 ppm for CH
1 stoichiometric ratio of Cu2+/1o. To better understand the interaction between 1o and Cu2+, 1H NMR titration experiments were performed (Fig. S13†). With the addition of Cu2+, the proton peaks at 9.03, 7.81, 7.71 ppm for pyridine (Ha, Hc and Hd) and 8.59 ppm for CH![[double bond, length as m-dash]](https://www.rsc.org/images/entities/char_e001.gif) N (Hb) broadened and downfield shifted, owing to the decreasing of electron density after coordination with Cu2+.39 Similar observations have been reported for other ion probes.44 Based on these results, together with previous reports, a bonding mode has been proposed as shown in Scheme 4.
N (Hb) broadened and downfield shifted, owing to the decreasing of electron density after coordination with Cu2+.39 Similar observations have been reported for other ion probes.44 Based on these results, together with previous reports, a bonding mode has been proposed as shown in Scheme 4.
Applications in logic circuit
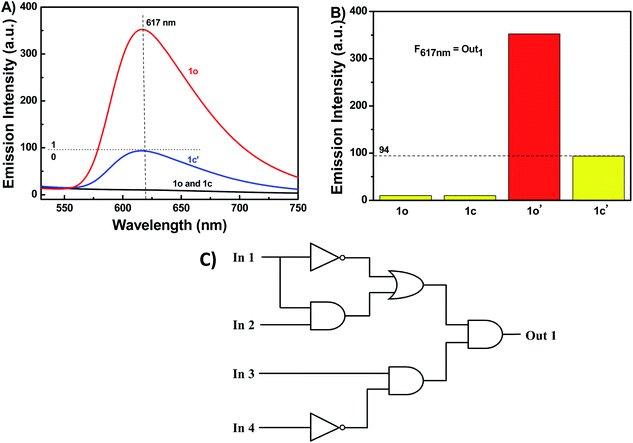
Moreover, a molecular logic circuit was constructed with four inputs and one output based on the fluorescence behavior induced by lights and chemical stimuli (Fig. 7A and C). The four input signals were In 1: 297 nm UV light, In 2: visible light (λ < 500 nm), In 3: Hg2+, and In 4: EDTA, while the fluorescence intensity of 1o at 617 nm was used as the output signal (fluorescence intensity ≤ 94 was assigned the boolean value “0” and fluorescence intensity > 94 was assigned the logical value “1”) (Fig. 7B). For instance, if the input string is ‘0, 1, 1, and 0’, corresponding to In 1, In 2, In 3, and In 4 in the ‘off, off, on, and off’ state. Under these conditions, the emission intensity was enhanced notably due to the formation of 1o-Hg2+ complex, resulting in an output state of ‘on’ with a digit of ‘1’. The truth table of the combinational circuit was presented in Fig. S14.†Owing to significant absorption changes of 1o stimulated by ultraviolet and Cu2+ it would be able to act as a 1![[thin space (1/6-em)]](https://www.rsc.org/images/entities/char_2009.gif) :
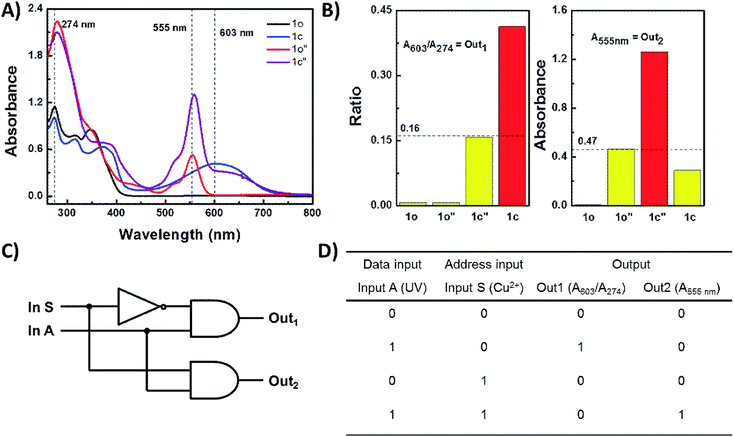
:![[thin space (1/6-em)]](https://www.rsc.org/images/entities/char_2009.gif) 2 digital demultiplexer (Fig. 8A). The data input (In A) was UV light, the address input (In S) was Cu2+, the two outputs were the absorbance at 555 nm and the absorbance ratio of (A603/A274), respectively. Fig. 8D shows the absorbance output levels measured for a solution of 1o in THF under the conditions corresponding to the four possible combinations of inputs. After determining a suitable threshold for the absorbance output, the truth table for the operation of the 1o-based digital multiplexer was obtained (Fig. 8B). The binary data and address inputs can exist in one of two states, on (1) or off (0). The outputs, Out 1 and Out 2 may likewise be set either on (1) or off (0). When In S (or address input) is set off then Out 1 (A603/A274) reports the state of In 1 (UV) and Out (A555 nm) remains off, conversely, when In S is switched on, Out 2 replaces Out 1 to report the state of In A and Out 1 turns off. The corresponding logic circuit was shown in Fig. 8C.
2 digital demultiplexer (Fig. 8A). The data input (In A) was UV light, the address input (In S) was Cu2+, the two outputs were the absorbance at 555 nm and the absorbance ratio of (A603/A274), respectively. Fig. 8D shows the absorbance output levels measured for a solution of 1o in THF under the conditions corresponding to the four possible combinations of inputs. After determining a suitable threshold for the absorbance output, the truth table for the operation of the 1o-based digital multiplexer was obtained (Fig. 8B). The binary data and address inputs can exist in one of two states, on (1) or off (0). The outputs, Out 1 and Out 2 may likewise be set either on (1) or off (0). When In S (or address input) is set off then Out 1 (A603/A274) reports the state of In 1 (UV) and Out (A555 nm) remains off, conversely, when In S is switched on, Out 2 replaces Out 1 to report the state of In A and Out 1 turns off. The corresponding logic circuit was shown in Fig. 8C.
Conclusions
In summary, a novel chemosensor based on a diarylethene containing a rhodamine B unit was developed. It can act as a selective fluorescence chemosensor for Hg2+ in DMSO, with a detection limit of 0.14 μM. It is also a naked-eye probe for Cu2+ in THF, with a detection limit of 0.51 μM. Furthermore, the fluorescence of the 1o-Hg2+ complex was efficiently adjusted by alternating UV/vis lights. A 1![[thin space (1/6-em)]](https://www.rsc.org/images/entities/char_2009.gif) :
:![[thin space (1/6-em)]](https://www.rsc.org/images/entities/char_2009.gif) 2 demultiplexer circuit was constructed by using UV light as data input, Cu2+ as the address input, and the absorbance at 555 nm and the absorbance ratio of (A603/A274) as the dual data outputs. This work may contribute to the design and construct of other diarylethene based multi-functional chemosensors.
2 demultiplexer circuit was constructed by using UV light as data input, Cu2+ as the address input, and the absorbance at 555 nm and the absorbance ratio of (A603/A274) as the dual data outputs. This work may contribute to the design and construct of other diarylethene based multi-functional chemosensors.
Conflicts of interest
There are no conflicts of interest to declare.Acknowledgements
The authors are grateful for the financial support from the National Natural Science Foundation of China (41867052, 21662015, 21861017, 41867053), the Masters' Innovative Foundation of Jiangxi Science and Technology Normal University (YC2018-S406).Notes and references
- J. F. Zhang, Y. Zhou, J. Yoon and J. S. Kim, Chem. Soc. Rev., 2011, 40, 3416–3429 RSC.
- A. P. de Silva, H. Q. Gunaratne, T. Gunnlaugsson, A. J. Huxley, C. P. McCoy, J. T. Rademacher and T. E. Rice, Chem. Rev., 1997, 97, 1515–1566 CrossRef CAS PubMed.
- P. B. Tchounwou, W. K. Ayensu, N. Ninashvili and D. Sutton, Environ. Toxicol., 2003, 18, 149–175 CrossRef CAS PubMed.
- H. N. Kim, W. X. Ren, J. S. Kim and J. Yoon, Chem. Soc. Rev., 2012, 41, 3210–3244 RSC.
- W. F. Fitzgerald, C. H. Lamborg and C. R. Hammerschmidt, Chem. Rev., 2007, 107, 641–662 CrossRef CAS PubMed.
- G. Guzzi and C. A. La Porta, Toxicology, 2008, 244, 1–12 CrossRef CAS PubMed.
- J. C. Clifton 2nd, Pediatr. Clin. North Am., 2007, 54, 237–269 Search PubMed.
- E. Gaggelli, H. Kozlowski, D. Valensin and G. Valensin, Chem. Rev., 2006, 106, 1995–2044 CrossRef CAS PubMed.
- D. J. Waggoner, T. B. Bartnikas and J. D. Gitlin, Neurobiol. Dis., 1999, 6, 221–230 CrossRef CAS PubMed.
- T. R. Halfdanarson, N. Kumar, C. Y. Li, R. L. Phyliky and W. J. Hogan, Eur. J. Haematol., 2008, 80, 523–531 CrossRef CAS PubMed.
- S. R. Jaiser and G. P. Winston, J. Neurol., 2010, 257, 869–881 CrossRef CAS PubMed.
- D. Pramanik, C. Ghosh and S. G. Dey, J. Am. Chem. Soc., 2011, 133, 15545–15552 CrossRef CAS PubMed.
- J. C. Lee, H. B. Gray and J. R. Winkler, J. Am. Chem. Soc., 2008, 130, 6898–6899 CrossRef PubMed.
- E. Tiffany-Castiglioni, S. Hong and Y. Qian, Int. J. Dev. Neurosci., 2011, 29, 811–818 CrossRef CAS PubMed.
- E. V. Stelmashook, N. K. Isaev, E. E. Genrikhs, G. A. Amelkina, L. G. Khaspekov, V. G. Skrebitsky and S. N. Illarioshkin, Biochemistry, 2014, 79, 391–396 CAS.
- M. Irie, T. Fukaminato, K. Matsuda and S. Kobatake, Chem. Rev., 2014, 114, 12174–12277 CrossRef CAS PubMed.
- J. J. Zhang and H. Tian, Adv. Opt. Mater., 2018, 6, 1701278 CrossRef.
- J. F. Lv, G. Liu, C. B. Fan and S. Z. Pu, Spectrochim. Acta, Part A, 2020, 227, 117581 CrossRef CAS PubMed.
- S. van de Linde and M. Sauer, Chem. Soc. Rev., 2014, 43, 1076–1087 RSC.
- S. Z. Pu, C. H. Zheng, Q. Sun, G. Liu and C. B. Fan, Chem. Commun., 2013, 49, 8036–8038 RSC.
- M. Takeshita, E. Mizukami, K. Murakami, Y. Wada and Y. Matsuda, Eur. J. Org. Chem., 2014, 3784–3787 CrossRef CAS.
- J. F. Lv, Y. L. Fu, G. Liu, C. B. Fan and S. Z. Pu, RSC Adv., 2019, 9, 10395–10404 RSC.
- L. Xu, S. Wang, Y. N. Lv, Y. A. Son and D. R. Cao, Spectrochim. Acta, Part A, 2014, 128, 567–574 CrossRef CAS PubMed.
- Y. F. Liang, R. J. Wang, G. Liu and S. Z. Pu, ACS Omega, 2019, 4, 6597–6606 CrossRef CAS PubMed.
- Y. L. Fu, C. B. Fan, G. Liu, S. Q. Cui and S. Z. Pu, Dyes Pigm., 2016, 126, 121–130 CrossRef CAS.
- G. Li, F. R. Tao, H. Wang, L. P. Wang, J. J. Zhang, P. P. Ge, L. Liu, Y. H. Tong and S. Sun, RSC Adv., 2015, 5, 18983–18989 RSC.
- G. Li, L. P. Bai, F. R. Tao, A. X. Deng and L. P. Wang, Analyst, 2018, 143, 5395–5403 RSC.
- S. Z. Pu, H. C. Ding, G. Liu, C. H. Zheng and H. Y. Xu, J. Phys. Chem. C, 2014, 118, 7010–7017 CrossRef CAS.
- H. M. Kang, C. B. Fan, H. T. Xu, G. Liu and S. Z. Pu, Tetrahedron, 2018, 74, 4390–4399 CrossRef CAS.
- H. T. Xu, H. C. Ding, G. Li, C. B. Fan, G. Liu and S. Z. Pu, RSC Adv., 2017, 7, 29827–29834 RSC.
- W. J. Liu, S. Z. Pu, D. H. Jiang, S. Q. Cui, G. Liu and C. B. Fan, Microchim. Acta, 2011, 174, 329–336 CrossRef CAS.
- D. B. Zhang, S. Y. Li, R. M. Lu, G. Liu and S. Z. Pu, Dyes Pigm., 2017, 146, 305–315 CrossRef CAS.
- J. L. Li, G. H. Ding, Y. Y. Niu, L. Y. Wu, H. J. Feng and W. Y. He, Spectrochim. Acta, Part A, 2018, 200, 127–135 CrossRef CAS PubMed.
- H. M. Kang, C. B. Fan, G. Liu and S. Z. Pu, Spectrochim. Acta, Part A, 2019, 211, 322–329 CrossRef CAS PubMed.
- Z. Wang, S. Q. Cui, S. Y. Qiu and S. Z. Pu, Tetrahedron, 2018, 74, 7431–7437 CrossRef CAS.
- S. Q. Cui, S. Y. Qiu, R. M. Lu and S. Z. Pu, Tetrahedron Lett., 2018, 59, 3365–3372 CrossRef CAS.
- H. Ye, F. Ge, X. C. Chen, Y. Li, H. Zhang, B. X. Zhao and J. Y. Miao, Sens. Actuators, B, 2013, 182, 273–279 CrossRef CAS.
- Y. F. Liang, L. Diao, R. J. Wang, N. S. Wang and S. Z. Pu, Tetrahedron Lett., 2019, 60, 106–112 CrossRef CAS.
- G. Zhao, F. F. Song, G. Wei, R. L. Wu, Z. Yan, F. Y. Zhang, S. Y. Guang and H. Y. Xu, Sens. Actuators, B, 2019, 286, 163–172 CrossRef CAS.
- D. Y. Wu, W. Huang, C. Y. Duan, Z. H. Lin and Q. J. Meng, Inorg. Chem., 2007, 46, 1538–1540 CrossRef CAS PubMed.
- P. Sakthivel, K. Sekar, G. Sivaraman and S. Singaravadivel, New J. Chem., 2018, 42, 11665–11672 RSC.
- H. Seo, M. E. Jun, K. Ranganathan, K. H. Lee, K. T. Kim, W. Lim, Y. M. Rhee and K. H. Ahn, Org. Lett., 2014, 16, 1374–1377 CrossRef CAS PubMed.
- Y. Wang, H. Wu, W. N. Wu, X. J. Mao, X. L. Zhao, Z. Q. Xu, Z. H. Xu and Y. C. Fan, Spectrochim. Acta, Part A, 2019, 212, 1–9 CrossRef CAS PubMed.
- Y. Zhang, X. Zeng, L. Mu, Y. Chen, J. X. Zhang, C. Redshaw and G. Wei, Sens. Actuators, B, 2014, 204, 24–30 CrossRef CAS.
Footnote |
| † Electronic supplementary information (ESI) available. See DOI: 10.1039/c9ra08557b |
| This journal is © The Royal Society of Chemistry 2019 |


