 Open Access Article
Creative Commons Attribution 3.0 Unported Licence
Experimental carbonation of CaO in an entrained flow reactor
Jorge
Plou
 *,
Isabel
Martínez
 ,
Gemma S.
Grasa
 and
Ramón
Murillo

Instituto de Carboquímica (CSIC), Environmental Research Group, C/Miguel Luesma Castán No. 4, 50018 Zaragoza, Spain. E-mail: jplou@icb.csic.es
First published on 18th February 2019
Abstract
In this work, the feasibility of an entrained flow reactor for full decarbonisation of gas streams has been proved. Three CaO-based materials (two types of lime and calcined raw meal) with different textural properties and therefore, different CO2 carrying capacities have been fed to the entrained flow reactor in a series of tests in which the Ca/CO2 molar ratio and solid residence time were the operation variables studied. Up to 11 mol CO2 m−2 s−1 has been captured from the gas phase with CaO from calcined lime with a maximum CO2 carrying capacity of 0.57 mol CO2 per mol CaO, reaching CO2 capture efficiencies over 90% for a Ca/CO2 molar ratio of 5 and solid residence times under 5 s.
1. Introduction
The calcium looping (Ca-looping) process has been recognised as the emerging CO2 capture technology having experienced the largest development in terms of the technology readiness level (TRL) compared to other CO2 capture technologies relying on the use of high temperature solids.1 The Ca-looping process is based on the reversible reaction between CaO and CO2 contained in a flue gas, which was patented for the first time more than 20 years ago as a post-combustion CO2 capture method.2 The concept of using CaO as a regenerable sorbent for separating CO2 from a flue gas stream was originally proposed by Shimizu et al.3 to be performed in two interconnected fluidized bed reactors. A flue gas stream containing CO2 is introduced into a carbonator operating at around 650 °C where it is put into contact with a solid stream containing CaO. The CaO reacts with the CO2 to form CaCO3 through an exothermic process, which allows recovering a great amount of energy from this reactor and thus boosts the efficiency of the process. The CaCO3 formed is then sent to the second reactor or calciner where it is regenerated back to CaO at high temperatures around 900–920 °C. Different methods for supplying the energy needed for CaCO3 calcination in the calciner reactor have been studied in the literature over the years, but none of them have been yet developed or proven on a sufficient scale for application.4 However, the one having reached the largest development consists of operating the calciner under oxyfuel conditions, burning within the calciner additional fuel with pure O2 as an oxidant.5| CaO + CO2 ↔ CaCO3 ΔH298 K = −178.8 kJ mol |
The Ca-looping technology having reached the largest demonstration scale has been used as a post-combustion CO2 capture technology in existing coal-fired power plants. The similarity of the key reactor technology in this application to existing circulating fluidised bed combustors has been the main reason for such fast development. Experimental results on a lab-scale (i.e., 10–75 kWth) from different plants in Germany, Canada and Spain demonstrated the possibility of achieving CO2 capture efficiencies ranging from 90 to 97% under realistic flue gas conditions.6–9 Later on, capture rates expected in commercial systems were demonstrated on a larger scale in the 200 kWth installation at IFK,10,11 which served to set the basis for further demonstration on increasing scales. Recently, the operation of the Ca-looping technology in continuous mode integrated for the first time into an existing power plant was successfully demonstrated in the largest pilot plant in operation today of 1.7 MWth located at La Pereda power station in Spain.5 This pilot plant, which entered operation in 2012 in the framework of the FP7 EU project CaOling, has treated a fraction of the flue gases generated in the 50 MWth coal-fired La Pereda power plant. In this pilot plant, novel reactivation methods for overcoming the CO2 carrying capacity decay experienced by naturally derived CaO-based sorbents have been also successfully proven.12
In addition to these well-developed Ca-looping reactor systems, the use of entrained-flow reactors has emerged as a promising reactor configuration for abating CO2 emissions in the cement production industry.13 The synergy between the Ca-looping and the cement production processes relies on the use of lime as part of the feedstock used for clinker production that allows integration of the purged CaO from the Ca-looping process into the clinker production line. Different configurations have been proposed in the literature for integrating the Ca-looping process into a cement plant,14,15 but the most integrated option where the carbonator is integrated into the preheating tower of the clinker production line aims at the highest efficiency.16 In this configuration, the carbonator of the Ca-looping process treats the flue gas exiting the rotary kiln after being properly cooled. The pre-calciner of the cement plant matches the calciner of the Ca-looping and should be therefore operated in oxy-combustion mode.17 The carbonator of the Ca-looping process should operate in the dilute pneumatic transport regime to be suitably integrated within the clinker production line, using calcined raw meal (i.e., containing mainly CaO, SiO2, Al2O3, Fe2O3 and other raw meal components) as a CO2 sorbent and with a very small particle size (i.e., dp < 30 μm). Moreover, the number of cycles that suffer from the calcium-based sorbent is very low as an important fraction of the stream of solids exiting the calciner is directed to the rotary kiln within this configuration. Regarding the use of calcined raw meal as a CO2 sorbent in a Ca-looping process, it has been demonstrated that the calcination conditions used as well as the aggregation level between the Ca and Si atoms in the raw meal determine the CO2 carrying capacity under the carbonator conditions needed for this application.18 Based on entrained-flow carbonator model calculations, high activity sorbents are therefore needed for this application which are able to achieve high CO2 capture efficiencies in short solid residence times within the carbonator (i.e., order of seconds) for the high gas velocities typical of these reactors (i.e., 10–15 m s−1). Moreover, the fluid dynamics of this entrained flow carbonator should be also demonstrated, which has to operate with a higher solid-to-gas ratio than in conventional entrained flow gas–solid systems in cement plants.17
Despite the growing attention on the application of the Ca-looping in cement plants, there is not much experimental information on the performance of an entrained-flow reactor operating as a carbonator under the specific conditions of high superficial velocity, particle size or gas-to-solid ratios typical of these systems. Recently, Turrado et al.19 presented the results on fine CaO-based particle carbonation in a drop tube, working with low superficial velocities and short residence times with the objective of determining kinetic parameters. This particular reactor configuration for the carbonator of a Ca-looping system (entrained flow) could be also explored as a tail-end CO2 cleaning method in those applications with limited CO2 capture rates to fulfil almost complete decarbonisation of the treated gas. Based on this context, the objective of this work is to explore the performance of CaO-based materials with different textural properties in an entrained flow carbonator under different conditions of gas superficial velocity (i.e., short solid residence time), CO2 loading in the feed gas and gas-to-solid ratios. According to the information obtained from these tests, the operating limits of each material application can be elucidated.
2. Experimental section
2.1. Materials description and characterisation
Three different CaO-based materials derived from two types of high-purity calcined lime (i.e., CaO content > 97% wt) and cement raw meal were tested in an entrained flow reactor. The raw meal consisted of a commercial material used in the cement industry and its composition corresponded to the standards for the manufacture of Portland cement (62.0% CaO, 20.3% SiO2, 4.5% Al2O3 and 3.2% Fe2O3).20 The raw meal and lime #1 were calcined at 875 °C in a furnace for 2 hours, whereas for lime #2 a calcination temperature of 800 °C for 3 hours was used. The reason behind using different calcination conditions was to obtain materials with different textural properties and different CO2 carrying capacities. To determine the calcination efficiencies in the furnace, the samples have been analysed by thermogravimetric analysis (TGA) in order to quantify the initial CaO/CaCO3 content of the materials that will be introduced into the reactor. This analysis has been taken into consideration when the Ca/CO2 ratios in the tests were calculated.Characterisation of the three materials used was performed as follows. The BET surface area was determined using a Micromeritics ASAP 2020 instrument according to the ISO 9277 standard. The pore structure of the samples was determined by Hg porosimetry on a Micromeritics AutoPore V. The true density of the samples was obtained by He pycnometry on a Micromeritics AccuPyc II. The particle diameter of the fresh samples was determined by laser diffraction (LS) using the “Tornado Dry Powder Module” of a Beckman Coulter LS13320 device. Finally, the CO2 carrying capacity was evaluated on a TGA apparatus that has been widely used for determining the CO2 carrying capacity of sorbents along calcination/carbonation cycles.21
2.2. Entrained flow reactor description
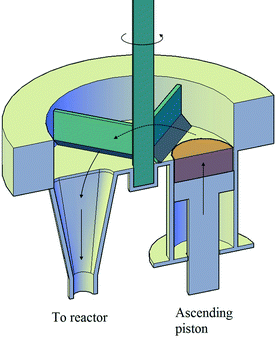
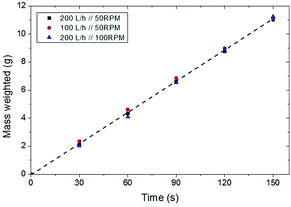
An entrained flow reactor has been designed and constructed to assess the performance of different CaO-based materials as CO2 sorbents. Two of the main characteristics of entrained flow reactors are the short residence time of both solid and gas phases (i.e., below 10 s) and the low solid-to-gas (S/G) ratio, which have been addressed during the design and construction of the plant. Fig. 1 shows a schematic diagram of the plant that consists mainly of three differentiated parts: the solid feeding system, the entrained flow reactor and the fluidized bed vessel. Fig. 2 shows a scheme of the solid feeding system that has been specifically designed for this application. It is based on volumetric feeding and it consists of a homemade stainless steel piston that is displaced vertically using a syringe pump (KDS Legato 100®). The sorbent is discharged into a chamber due to the vertical movement of the piston and it is directed to the entrained flow reactor inlet thanks to a motorized scraper that is continuously rotating inside the chamber. The chamber has also a gas inlet that helps the solid to flow through the reactor inlet. The feeding principle is similar to that of the work of Besenhard et al.22 The solid feeding rate depends on the displacement speed of the syringe pump and it is independent of the gas flow introduced into the system. In this manner, the effect of the S/G ratio was studied independently of the gas velocity. Fig. 3 shows how the flow of solids can be maintained with time and it is independent of the gas flow in the feeding chamber and the rotational speed of the scraper. The system is able to feed up to 7 g min−1 (117 × 10−6 kg s−1) in the case of lime #2.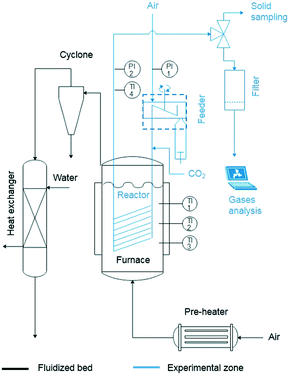 | ||
| Fig. 1 Diagram of the entrained flow reactor (the reacting gas and solid phase path is depicted in blue). | ||
The reactor is a 24 meter spiral-shaped stainless steel tube (external diameter of 3/8′′). The external spiral diameter is 0.24 m and the total height is 0.4 m. The reactor is immersed in a fluidised bed reactor that provides a homogeneous temperature along the reaction path. The reactor inlet is connected to the powder feeding system and the solids are dragged by the air flow. Just before the hot zone (in the fluidised bed reactor), CO2 is mixed with the sorbent/air stream and then introduced into the reactor. The reactor is equipped with two pressure transducers at the beginning and at the end of the entrained reactor, which allow measuring the pressure drop during the tests. There is a thermocouple placed one meter after the end of the reactor (once it leaves the fluidised bath) which shows that the heat losses of the uncovered tube allow reducing the gas temperature below 100 °C in the final part of the reactor and therefore the carbonation reaction is stopped. At the end, exhaust gases are analysed using a combustion gas on-line analyser Testo 350 XL. Solids are collected in an in-line filter and the carbonation degree of the sorbent particles is determined by TGA. Finally, the bubbling fluidized bed reactor is filled with sand and placed inside a cylindrical furnace (15 kW). It is fluidised with air, which has been previously heated up in a pre-heater (6.2 kW). The bubbling reactor has been operated with a total air flow of 100 L STP min−1 at 650 °C, which results in a fluidization velocity of 0.05 m s−1 that is two times the minimum fluidization velocity measured experimentally and ensures vigorous fluidisation of the sand particles. As indicated in Fig. 1, there are three thermocouples immersed at different heights to measure the temperature throughout the bubbling bed of sand (the temperature difference between them is always below 10 °C). The hot air with elutriated fine particles coming out from the bubbling bed is passed through a cyclone to remove solid particles and then cooled down in a heat exchanger with water as a cooling fluid. The outlet temperature of the gases is around 30 °C.
2.3. Experimental routine and residence time distribution (RTD) determination
Before starting any test, the steel syringe is loaded with the solid and packed with a plastic piston to form a bed of solids with homogeneous porosity. In every experiment, the solid in the syringe is weighed and the volume is calculated to verify the packed density. Moreover, the concentration of CO2 is calibrated at different values at the beginning of each test. When starting an experiment, the air/CO2 stream is fed into the spiral tube and after some minutes, when the system is stabilised, the solids start to be fed for a known time. The CO2 concentration was measured using the gas analyser at the reactor outlet, right after the solids were collected into the filter that was at ambient temperature (see Fig. 1). The solids were then analysed with the TGA to determine their CaCO3 content. After every experiment, the reactor was cleaned with compressed air to remove the solid stuck in the reactor walls. The amount of solids collected in the filter during the experiment was weighed and compared with the theoretical amount of solids fed with the syringe. This allows calculating the real amount of material that passes through the reactor.Table 1 compiles the range of operating variables for the tests performed in the entrained flow reactor, which includes the type of solid, the particle residence time within the reactor, the CO2 concentration and the S/G ratio. The range of gas velocity tested has been determined for avoiding saltation conditions within the entrained flow regime, which sets a critical velocity at which particles begin to fall. The saltation velocity (usalt) has been determined according to Rizk's correlation which is given in eqn (1),23,24 as a function of the solid loading (kg solid per kg gas) (φ), the particle diameter (dp) and the tube diameter (D). Based on the calculation of usalt for each experiment, the operation gas flow was determined for avoiding saltation conditions (i.e. ensuring u > usalt).
 | (1) |
| Operational range | |
|---|---|
| Materials | Calcined raw meal and lime samples |
| Gas flow, NL s−1 | 0.069–0.205 |
| CO2 concentration, vol% | 10–30 |
| Gas inlet velocity, m s−1 | 5–15 |
| Solid flow, kg s−1 | 15 × 10−6–120 × 10−6 |
| Particle size, μm | <100 |
| Solid-to-gas ratio, kg kg−1 | 0–1.5 |
| Temperature, °C | 650 |
Before starting the CO2 capture tests, the solid residence time distribution (RTD) was calculated. A video has been recorded directly at the reactor exit (disconnecting the line directed to the filter) for a set of operating conditions, corresponding to the minimum gas flow used along the experimental tests and the maximum solid flow (see Table 1). Lime #2 was used as the solid due to its lower cohesiveness compared with the other two materials. Matlab software tools have been used for image analysis on each individual frame, being possible to extract the average intensity, Iave,BN(t), for each black and white image (using a black background) which is indicative of the amount of material projected on each frame. The intensity values have been normalized and the F(t) curve for the solid RTD has been obtained. Given the high gas velocity in the reactor and its length, a low value for the dispersion module is expected and eqn (2) has been used (valid for D/u·L < 0.01 and both open or closed vessels as contour conditions).
 | (2) |
From the numerical integration of the E(θ) curve, the F(θ) curve has been obtained. This F(θ) curve can be directly fitted with the experimental curve obtained through the image analysis.
For a more accurate determination of the solid residence time inside the reactor, the time needed for the solids to reach the reactor inlet once the syringe pump is switched on has been also experimentally measured. The RTD obtained is shown in Fig. 4. According to this RTD, the average residence time for the solid has been determined to be equal to 5.3 s (i.e., the time at which 50% of the solids have left the reactor), whereas the estimated residence time (τ) according to the reactor volume and gas flow rate is 4.5 s. This corresponds to a τgas/τsol ratio of 85%, which is within the values estimated through Klinzing's correlation given in eqn (3),25,26 where us is the solid velocity, ug is the superficial gas velocity, ut is the terminal velocity of the particles calculated from Levenspiel27 and D is the tube diameter. According to this expression, τgas/τsol ranges between 80–90% depending on the operating conditions chosen. Considering that the τgas/τsol ratio has been experimentally measured within that range, Klinzing's equation has been used to calculate the solid residence time in the reactor for the experiments performed in this work. The non-dimensional dispersion number (D/us·L) derived from these tests was 0.02, which was close to the value of 0.01 for a low dispersion flow. Under these conditions, the dispersion coefficient calculated for the solid (Dsol) was found to be 2.35 m2 s−1.
| us = (ug − ut0.71)·D0.019 | (3) |
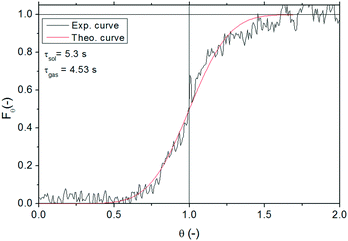 | ||
| Fig. 4 Experimental and theoretical RTD obtained for the solid (lime #2) in the entrained flow reactor. | ||
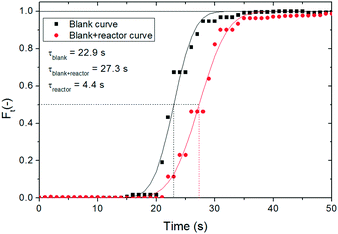
Moreover, the RTD for the gas phase has been also determined. A step signal of a tracer (CO2 in this case) has been introduced in the reactor to determine the RTD. In order to consider the time delay due to the analysis system, the measurement has been performed placing the analyser right after the injection of the CO2/air mixture (i.e., without passing through the reactor), in order to determine the delay associated exclusively with the analyser, and then right after the reactor. Fig. 5 shows the RTD obtained for these two situations. The gas analysis registers the gas composition every second, but in order to reduce the error on the determination, each measurement has been triplicated. As it has been done for the solids, the F(t) experimental curve has been compared with the theoretical curves, through the numerical integration of eqn (2). As seen from Fig. 4, the time delay introduced by the gas analyser is high because the equipment has an internal pump with a lower flow than the gas line. A mean gas residence time of 22.9 s in this equipment has been measured. By comparing this value with the mean gas residence time obtained when placing the analyser after the reactor, a gas residence time of 4.4 s is calculated in the reactor, which corresponds to a dispersion number (D/ug·L) of 0.002 (Dgas = 0.31 m2 s−1). The residence time is very close to the theoretical one of 4.5 s calculated from the gas flow rate and the reactor volume. Therefore the plug flow for the gas phase has been successfully proven.
3. Results and discussion
3.1. Characterisation results
Fig. 6 shows the particle size distribution (PSD) and the cumulated PSD for the three materials tested. As can be seen, the raw meal shows an almost constant volume percentage in the range from 5 to 110 μm, with 62% volume of the particles below 50 μm which become particularly difficult to handle due to their sticky nature. The cohesiveness of this material is also corroborated by the formation of agglomerates that turn into peaks during the determination of the PSD curve shown in Fig. 6 (left). Concerning lime #1, the predominant volume percentage is found at the particle diameter equal to 107 μm, but the PSD ranges from 5 to 110 μm with 43% of cumulated volume particles below 50 μm. Lime #2 had also a maximum in the PSD near 100 μm but the distribution is narrower than for lime #1 and only 7% of the material has a particle diameter of below 50 μm. These different particle size distributions will be related to the different fluid dynamic behaviours observed inside the entrained reactor, as explained further later in this manuscript.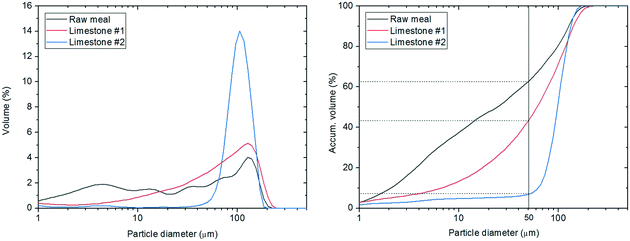 | ||
| Fig. 6 (Left) Particle size distribution and (right) cumulated particle size distribution of the materials. | ||
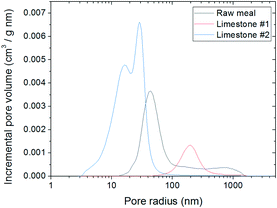
Table 2 compiles the results of the textural characterisation for the three materials used and Fig. 7 shows their pore size distribution. As can be observed, the materials present rather different BET surface areas that will affect their CO2 carrying capacity. Usually, calcined fresh lime has a higher surface area (10–20 m2 g−1)18 than calcined raw meal (5–10 m2 g−1).28 However, the BET surface area obtained for lime #1 is noticeably low due to the stringent calcination conditions used in this case (i.e., higher temperature), which turns out to be a surface area of 1.45 m2 g−1. Such a reduced surface area and a predominant pore radius of 200 nm indicate that it is a highly deactivated material, with large open pores, that will present the lowest CO2 carrying capacity. In contrast, lime #2 shows the highest BET surface area of 11.7 m2 g−1, which is close to calcined fresh lime areas. The bimodal pore size distribution obtained for this calcined lime (with maxima at 16 and 29 nm) with smaller pores than for lime #1 contributes to the higher surface area observed. The calcined raw meal surface area is equal to 6.65 m2 g−1 between those of lime #1 and #2, with an average pore diameter of 40 nm. With respect to the material packed density (measured in the steel syringe), it is important to highlight that this parameter will affect the operation limits for the solid feeding system as it is based on volumetric feeding. At the maximum piston speed, it has been able to feed up to 120 mg s−1 of lime #2, while only 80 mg s−1 of calcined raw meal have been successfully fed.
| Material | BET area (m2 g−1) | True density (kg m−3) | Packed density (kg m−3) |
|---|---|---|---|
| Raw meal | 6.65 | 3142 | 600 |
| Lime #1 | 1.45 | 2989 | 730 |
| Lime #2 (calcined at 800 °C) | 11.72 | 2525 | 850 |
| Lime #2 (calcined at 900 °C) | 8.31 | 2525 | 850 |
When describing the evolution of CaO carbonation conversion with time of a given sorbent as determined in a differential reactor, two characteristic conversions are commonly addressed: Xmax and Xkd.21,29–31Xmax represents the maximum CO2 carrying capacity (normally expressed as mol CO2 per mol CaO) of the sorbent in a reasonable reaction time, usually around 5 minutes. The CaCO3 layer is well developed onto the CaO surface and the material reacts in the so-called product layer diffusion controlled regime. Xkd represents the conversion level at which the transition between the kinetic controlled regime (fast reaction period) and the slow reaction regime (combined control of the chemical reaction and the diffusion through the product layer) takes place.21 Therefore the carbonation reaction rate of the sorbent at a given conversion level (X) will depend on the difference with Xmax or Xkd. As an example, a sorbent with X < Xkd, will react in the so-called kinetic controlled regime, while a sorbent with Xkd < X < Xmax will present a slower reaction rate as the carbonation reaction will be determined by the combined control of the product layer diffusion and the chemical reaction. In an integral reactor, the CaO conversion at the reactor exit will depend on different variables such as temperature, CO2 partial pressure and mean solid residence time in the system assessed. Therefore, it is important for the process design that the sorbent conversion achieved at the reactor exit is well below its Xkd, as in this way all the material flowing in the reactor would react in the kinetic control regime and consequently at its maximum carbonation reaction rate.
To corroborate the materials' CO2 carrying capacity according to their composition and textural properties, the materials were subjected to carbonation/calcination cycles (at 650 °C and CO2 partial pressures between 10 and 30 kPa) paying special attention to weight changes during the initial seconds of reaction as these short contact times will be of interest in entrained flow reactors. Fig. 8 shows the evolution of CaO conversion with time for the three materials tested in this work. As can be observed, the materials followed the expected trends according to their textural characterisation. Lime #2 presented the highest CO2 carrying capacity, being able to convert about 0.45 mol CO2 per mol CaO in the so-called kinetic controlled regime (Xkd) and with a CO2 carrying capacity of 0.57 mol CO2 per mol CaO, which was reached at about 150 s. This value is similar to the conversion reached at the end of the first carbonation of CaO from natural lime.21 In contrast, lime #1 presents a much lower CO2 carrying capacity since it is a highly sintered material according to its characterisation. Xkd corresponds to 0.1 mol CO2 per mol CaO for lime #1, whereas Xmax is equal to 0.15 mol CO2 per mol CaO. This is the typical conversion that a highly deactivated sorbent is able to achieve within the fast reaction stage, as reported in the literature.21 The calcined raw meal presents an Xkd of about 0.22 mol CO2 per mol CaO and an Xmax of about 0.42 mol CO2 per mol CaO, in agreement with data published on this type of sorbent.18
 | ||
| Fig. 8 (Left) CaO conversion of the three materials with a TGA apparatus at 650 °C and 10% vol CO2 in air. (Right) CaO conversion of lime #2 at different CO2 concentrations at 650 °C. | ||
3.2. Entrained flow reactor results
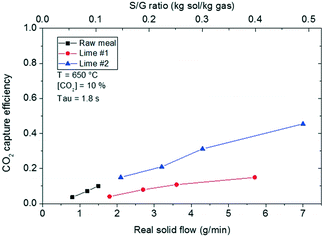
As described in the Experimental section, the main operating variables investigated in the entrained flow reactor have been the CO2 carrying capacity of the sorbent, the CO2 partial pressure and the gas and solid mass flows. Consequently, the S/G ratio and the residence time were the variables to be studied. In all the results, the solid flow corresponds to the real flow of solids passing through the spiral without the fraction remaining in the walls and not the intended nominal solid mass flow injected with the syringe. The temperature in the fluidized bed bath was set at 650 °C for all the tests performed in the entrained flow reactor. The residence time was varied between 1.8 and 5.3 seconds by means of the total gas flow, which corresponded to a linear gas velocity between 13.5 and 4.5 m s−1, respectively. As mentioned before, this gas velocity was chosen to be sufficiently far from the saltation velocity calculated by eqn (2). With respect to the solid velocity, it is controlled by the drag force and it corresponds to 80–90% of the gas velocity depending on the particle diameter and the gas velocity (eqn (3)). Finally, the carbonation efficiency (or CO2 capture efficiency) was defined as the CO2 captured versus the maximum possible according to the equilibrium.Fig. 9 compiles the results obtained in terms of CO2 capture efficiency for the set of experiments performed at the highest gas velocity (13.5 m s−1 at 650 °C) that resulted in a gas residence time of 1.8 s. The real solid flow passing through the reactor is between 0.8 and 7 g min−1 (13–117 × 10−6 kg s−1) for these tests, which are equivalent to the different S/G mass ratios presented. Despite the fact that the syringe pump speed has been operated in a common range from 64 to 211 μm s−1 for the three materials, the solid flow through the reactor depended on the solid. This is mainly due to two factors: the material packed density (Table 2) and the friction with the walls resulting in the solid retained inside the tube. Despite the high velocity, up to 50% weight of the calcined raw meal accumulated inside the reactor. In the case of the lime materials, more than 85% of lime #1 and almost 100% of lime #2 passed through the reactor. A PSD analysis of the calcined raw material deposited in the reactor walls (not shown) revealed that the fraction of solids below 25 μm was more likely to be retained in the reactor. Fig. 9 shows that carbonation efficiencies up to 45% can be obtained in such a short residence time with a S/G ratio of 0.5 kg solid per kg gas and a CaO-based sorbent with a maximum CO2 carrying capacity of 0.57 mol CO2 per mol CaO, which corresponds to a Ca/CO2 molar ratio of 3.35. As expected, CaO from lime #1 that was highly sintered (see the textural properties in Table 2) was only capable of obtaining carbonation efficiencies close to 15–20% at the highest solid flow tested (S/G mass ratio of 0.37 and Ca/CO2 molar ratio of 2.65). Finally, the calcined raw meal reached carbonation efficiencies up to 15% but operating at a much lower real solid flow than both the calcined lime materials, due to the large amount of solids deposited throughout the reactor walls during the tests. Looking into the results obtained, it is possible to appreciate that higher carbonation efficiencies could be possible when operating with the raw meal as the CO2 sorbent in the entrained flow carbonator if it were possible to flow larger amounts of the material through the reactor. In a standard cement plant, in which larger scale entrained flow reactors would be implemented, the powder retention is greatly decreased because of the larger radius of the tube where the friction between the material and the reactor walls diminishes. This powder handling problem with particles with dp < 50 μm is already solved in industrial plants and it is expected to have zero solid retention in the reactors.32
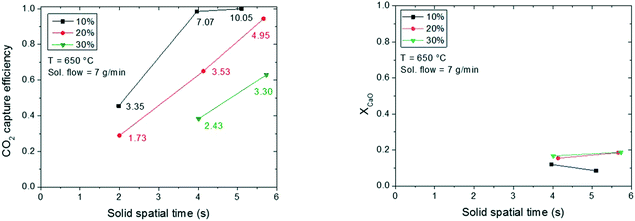
Based on the performance results shown in Fig. 9, the results shown from this point onwards in the manuscript correspond to those obtained with lime #2. The objective of the tests performed was to increase the gas and solid residence time in the reactor to determine an operation window that would allow for high CO2 capture efficiencies in the reactor. Fig. 10 compiles the results of carbonation efficiency and CaO conversion obtained when the solid flow rate is kept at the maximum capacity of the feeding system (i.e., 7 g min−1 (117 × 10−6 kg s−1)). The total gas flow was varied to reach nominal gas residence times in the reactor ranging from 1.8 to 5.3 s. The CO2 partial pressure in the gas stream was varied between 10 and 30% vol. As a consequence of varying the gas flow while maintaining a constant flux of solids, the S/G mass ratio changed between 0.43 and 1.35 kg solid per kg gas and the Ca/CO2 molar ratio between 1 and 10. The real solid residence time is indicated in the X-axis of Fig. 10 and it differs from the gas residence time by 10–20% (according to eqn (3)). As can be observed in Fig. 10 (left), CO2 capture efficiencies over 98% for solid residence times as low as 3.9 s, a S/G mass ratio of 0.97 and a Ca/CO2 molar ratio of 7 can be reached. This corresponds to the test performed with 10% vol CO2 in the gas stream, and under these conditions, the reactor CO2 capture rate has been estimated to be 7 mol CO2 m−2 s−1. A reproducible CO2 capture rate of 10 mol CO2 m−2 s−1 has been obtained in the tests performed with 20% vol CO2 and the CO2 capture efficiency increases following a linear trend with the residence time indicating that the material reacts in the so-called kinetic controlled regime. The CO2 capture is not limited by the sorbent reaction rate but by the Ca/CO2 ratio. The figure shows that it is possible to capture over 95% CO2 from a gas stream with a S/G weight ratio of 1.3 and a Ca/CO2 molar ratio of 4.9 in a solid residence time of about 5.6 s. Higher Ca/CO2 ratios (out of our feeding system range) would allow for higher CO2 capture rates in the reactor in shorter solid residence times. Finally, almost 11 mol CO2 m−2 s−1 has been obtained in the test performed with a gas stream containing 30% vol CO2, a Ca/CO2 molar ratio of 3.3 and a S/G mass ratio of 1.23. In this case, 63% carbonation efficiency has been obtained in the entrained flow reactor.
Fig. 10 (right) shows the CaO conversion determined in the materials collected in the filter at the end of the reactor expressed as mol CO2 per mol Ca for some of the experiments presented in Fig. 10 (left). The results obtained with the samples with a τsol of 1.8 s have not been included due to experimental uncertainties in the collector. As can be observed, for the solid samples collected during the experiment with 10% vol CO2, the sorbent conversion (about 12%) does not increase for reaction times over 4 s. The experiment with the higher residence time and Ca/CO2 ratio presents a slightly lower conversion, as the equilibrium has been reached in this test. For this reason, the CaO conversion reached at the reactor exit in this case has been limited by the equilibrium CO2 partial pressure reached in the experiments with residence times over 3.8 s. Increasing the solid residence time would have a negative impact in the process in terms of efficiency as CO2 capture would no longer take place and part of the sorbent might not react. Analysing the solids collected for the tests with higher CO2 content in the gas stream, it can be observed that increasing the residence time in the reactor increases slightly their conversion, which indicates that the limiting factor to achieve higher CO2 capture efficiencies for the tests with 20 and 30% vol CO2 is the Ca/CO2 ratio.
In order to elucidate the impact of the CO2 carrying capacity of the sorbent used in the entrained flow reactor, lime #2 was calcined at a higher temperature in order to obtain a lower surface area. The BET surface area decreased from 11.7 to 8.31 m2 g−1. The comparison of the carbonation efficiency under the same operating conditions of both sorbents is presented in Fig. 11. As expected, the sorbent was less active and consequently the CaO conversion decreased between 0.19 and 0.16, resulting in a carbonation efficiency of almost 10% less than that of the non-sintered lime for the same solid residence time.
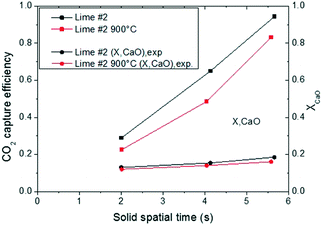 | ||
| Fig. 11 Comparison of CO2 capture efficiency and CaO conversion of lime #2 with different textural properties. | ||
Fig. 12 shows the results obtained for a fixed gas flow, when varying the flow of solids fed to the system for a constant temperature. This analysis allows evaluation of the effect of the Ca/CO2 ratio for an almost constant solid residence time. The experiments have been performed at 650 °C and a CO2 partial pressure of 20% vol. As shown in the figure, increasing the Ca/CO2 molar ratio at the reactor inlet leads to a proportional increase of the carbonation efficiency. Reaching a Ca/CO2 ratio of almost 4.95 at the entrained flow reactor inlet (which is equivalent to work with 1.7 kg of solids per Nm3 of gas) allows obtaining a carbonation efficiency of 94%. Concerning the conversion of CaO, XCaO,est corresponds to the conversion estimated from the CO2 conversion and the mass balance, and XCaO,exp corresponds to the conversion obtained by TGA analysis. From these results, it is possible to state that the error in the determination of the conversion is minor. Since the solid residence time inside the reactor is similar, the CaO conversion does not change with the Ca/CO2 ratio as determined with an average conversion of around 17%.
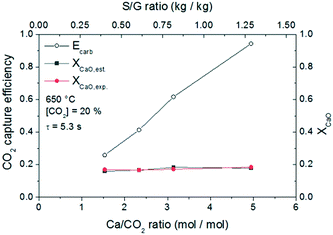 | ||
| Fig. 12 CO2 capture efficiency and CaO conversion at different solid flows of lime #2. Conditions: T = 650 °C, 20% CO2 and nominal gas residence time = 5.3 s. | ||
Finally, the experimental results have been rearranged and the carbonation efficiency as a function of S/G mass ratio and Ca/CO2 molar ratio is presented (Fig. 13). As can be observed for the sorbent lime #2 tested (with an Xmax of 0.57 mol CO2 per mol CaO and an Xkd of 0.45 mol CO2 per mol CaO), Ca/CO2 molar ratios of about 5 would be sufficient to achieve full decarbonisation of the gas stream at 650 °C with residence times as low as 3.8 s as long as the CO2 sorbent used is sufficiently active. In the case of the CO2 sorbent used with a lower CO2 carrying capacity (i.e., lower Xkd as observed for the raw meal in this work), it would be necessary to operate with larger Ca/CO2 ratios at the entrained reactor inlet to reach almost complete decarbonisation of the flue gas stream. This is important experimental proof of the use of entrained flow reactors for CO2 capture in cement plants and confirms the high carbonation rates measured in TGA equipment.
 | ||
| Fig. 13 CO2 capture efficiency (left) according to the S/G mass ratio and (right) according to the Ca/CO2 molar ratio of lime #2. | ||
The experimental results shown in this work demonstrate that the short solid residence times (below 5 s) in the entrained flow reactor allow CaO particles to exit the carbonator still reacting in the fast kinetic regime (i.e., with a conversion below Xkd). Based on this result, high carbonation efficiencies can only be reached by means of increasing the S/G ratio or the Ca/CO2 molar ratio at the reactor inlet. Sufficiently active CO2 sorbents allow operating with similar S/G ratios compared to conventional preheaters in cement plants (1–1.5 kg Nm−3).
4. Conclusions
In this work, experimental tests were carried out in a spiral tube with a length of 24 meters working as an entrained reactor for CO2 capture with calcium sorbents as a low emission solution for a module integrated into a cement plant. Three materials have been tested as CO2 sorbents: two calcined lime samples and calcined raw meal. The materials were calcined under different conditions to obtain materials with different textural properties and therefore different CO2 carrying capacities: highly sintered lime, lime with typical CO2 carrying capacity and the CaO from raw meal that presented an average of 0.25 mol CO2 per mol CaO. The PSD of the materials showed that the calcined raw meal and calcined lime #1 had an important fraction of particles below 50 μm and in particular calcined raw meal presented a highly cohesive nature. This physical characteristic had an extremely important influence in the operation of the experimental rig, as an important fraction of the material (50%) was retained in the reactor during operation with the calcined raw meal. In contrast, almost 100% material was passed through the reactor when feeding CaO from calcined lime. The entrained reactor is immersed in a sand bath that guarantees an isothermal profile along the reactor.The tests carried out in the entrained reactor with the three materials showed a linear trend of the carbonation efficiency that increased with the solid flow at a fixed time due to the higher Ca/CO2 molar ratio. An in-depth study was performed for the material with the highest CO2 carrying capacity (lime #2) and it has been possible to reach the maximum CO2 capture efficiency that is limited by the equilibrium for experiments with Ca/CO2 molar ratios over 4 and solid residence times under 5 s. The Ca/CO2 ratio was the limiting factor for achieving higher CO2 capture efficiencies for experiments with Ca/CO2 molar ratios below 5. The conversion of the material measured at the reactor exit was close to its Xkd determined using the TGA apparatus.
Conflicts of interest
There are no conflicts to declare.Acknowledgements
This work acknowledges the support from the Spanish Ministry of Economy, Industry and Competitiveness through the funding of the project ENE2015-68885-C2-2-R. The authors are also grateful for support from the Regional Aragon Government (DGA) under the research groups' support program.Notes and references
- J. C. Abanades, B. Arias, A. Lyngfelt, T. Mattisson, D. E. Wiley, H. Li, M. T. Ho, E. Mangano and S. Brandani, Int. J. Greenhouse Gas Control, 2015, 40, 126–166 CrossRef CAS.
- T. Hirama, H. Hosoda, K. Kitano and T. Shimizu, Method of separating carbon dioxide from carbon dioxide containing gas and combustion apparatus having function to separate carbon dioxide from the combustion gas, US5665319A, 1996, p. 20.
- T. Shimizu, T. Hirama, H. Hosoda, K. Kitano, M. Inagaki and K. Tejima, Chem. Eng. Res. Des., 1999, 77, 62–68 CrossRef CAS.
- I. Martínez, G. Grasa, J. Parkkinen, T. Tynjälä, T. Hyppänen, R. Murillo and M. C. Romano, Int. J. Greenhouse Gas Control, 2016, 50, 271–304 CrossRef.
- B. Arias, M. E. Diego, J. C. Abanades, M. Lorenzo, L. Diaz, D. Martínez, J. Alvarez and A. Sánchez-Biezma, Int. J. Greenhouse Gas Control, 2013, 18, 237–245 CAS.
- M. Alonso, N. Rodríguez, B. González, G. Grasa, R. Murillo and J. C. Abanades, Int. J. Greenhouse Gas Control, 2010, 4, 167–173 CrossRef CAS.
- A. Charitos, C. Hawthorne, A. R. Bidwe, S. Sivalingam, A. Schuster, H. Spliethoff and G. Scheffknecht, Int. J. Greenhouse Gas Control, 2010, 4, 776–784 CrossRef CAS.
- D. Y. Lu, R. W. Hughes and E. J. Anthony, Fuel Process. Technol., 2008, 89, 1386–1395 CrossRef CAS.
- N. Rodríguez, M. Alonso and J. C. Abanades, AIChE J., 2011, 57, 1356–1366 Search PubMed.
- H. Dieter, A. R. Bidwe, G. Varela-Duelli, A. Charitos, C. Hawthorne and G. Scheffknecht, Fuel, 2014, 127, 23–37 CrossRef CAS.
- H. Dieter, C. Hawthorne, M. Zieba and G. Scheffknecht, Energy Procedia, 2013, 37, 48–56 CrossRef CAS.
- M. E. Diego, B. Arias, A. Méndez, M. Lorenzo, L. Díaz, A. Sánchez-Biezma and J. C. Abanades, Int. J. Greenhouse Gas Control, 2016, 50, 14–22 CAS.
- C. C. Dean, D. Dugwell and P. S. Fennell, Energy Environ. Sci., 2011, 4, 2050 RSC.
- E. De Lena, M. Spinelli, I. Martínez, M. Gatti, R. Scaccabarozzi, G. Cinti and M. C. Romano, Int. J. Greenhouse Gas Control, 2017, 67, 71–92 CrossRef CAS.
- M. C. Romano, M. Spinelli, S. Campanari, S. Consonni, M. Marchi, N. Pimpinelli and G. Cinti, Energy Procedia, 2014, 61, 500–503 CrossRef CAS.
- M. Spinelli, I. Martínez, E. D. Lena, G. Cinti, M. Hornberger, R. Spörl, J. C. Abanades, C. Becker, R. Mathai, K. Fleiger, V. Hoenig, M. Gatti, R. Scaccabarozzi, S. Campanari, S. Consonni and M. C. Romano, Energy Procedia, 2017, 114, 6206–6214 CrossRef CAS.
- M. Spinelli, I. Martínez and M. C. Romano, Chem. Eng. Sci., 2018, 191, 100–114 CrossRef CAS.
- M. Alonso, Y. Álvarez Criado, J. R. Fernández and J. C. Abanades, Energy Fuels, 2017, 31, 13955–13962 CrossRef CAS.
- S. Turrado, B. Arias, J. R. Fernandez and J. C. Abanades, Ind. Eng. Chem. Res., 2018, 57, 13372–13380 CrossRef CAS.
- American Society for Testing and Materials (ASTM) International West Conshohocken, 2018.
- G. Grasa, R. Murillo, M. Alonso and J. C. Abanades, AIChE J., 2009, 55, 1246–1255 CrossRef CAS.
- M. O. Besenhard, S. Fathollahi, E. Siegmann, E. Slama, E. Faulhammer and J. G. Khinast, Int. J. Pharm., 2017, 519, 314–322 CAS.
- M. Rhodes, Introduction to Particle Technology, 2nd edn, 2008, pp. 1–450, DOI:10.1002/9780470727102.
- G. E. Klinzing, F. Rizk, R. Marcus and L. S. Leung, Pneumatic conveying of solids: A theoretical and practical approach, 2010, pp. 1–599, (Web: https://www.springer.com/gp/book/9789048136087) Search PubMed.
- G. E. Klinzing, C. A. Myler, A. Zaltash and S. Dhodapkar, Powder Technol., 1989, 58, 187–193 CrossRef CAS.
- W. Wei, G. Qingliang, W. Yuxin, Y. Hairui, Z. Jiansheng and L. Junfu, Powder Technol., 2011, 212, 403–409 CrossRef.
- D. Kunii and O. Levenspiel, Fluidization engineering, 2nd edn, 2013 Search PubMed.
- S. K. Pathi, W. Lin, J. B. Illerup, K. Dam-Johansen and K. Hjuler, Energy Fuels, 2013, 27, 5397–5406 CrossRef CAS.
- J. C. Abanades, Chem. Eng. J., 2002, 90, 303–306 CrossRef CAS.
- G. Grasa and J. C. Abanades, Ind. Eng. Chem. Res., 2006, 45, 8846–8851 CrossRef CAS.
- B. Arias, J. C. Abanades and G. S. Grasa, Chem. Eng. J., 2011, 167, 255–261 CrossRef CAS.
- P. A. Alsop, Cement plant operations handbook: for dry process plants, Tradeship Publications Ltd, 2007 Search PubMed.
| This journal is © The Royal Society of Chemistry 2019 |

