 Open Access Article
Creative Commons Attribution 3.0 Unported Licence
Hexakis(2,3,6-tri-O-methyl)-α-cyclodextrin–I5− complex in aqueous I−/I3− thermocells and enhancement in the Seebeck coefficient†
Yimin
Liang
a,
Teppei
Yamada
 *ab,
Hongyao
Zhou
a and
Nobuo
Kimizuka
 ab
ab
aDivision of Chemistry and Biochemistry, Graduate School of Engineering, Kyushu University, Motooka 744, Nishi-ku, Fukuoka 819-0395, Japan. E-mail: teppei343@gmail.com
bCenter for Molecular Systems, Kyushu University, Motooka 744, Nishi-ku, Fukuoka 819-0395, Japan
First published on 22nd October 2018
Abstract
A large Seebeck coefficient (Se) of 1.9 mV K−1 was recorded for the I−/I3− thermocell by utilizing the host-guest complexation of hexakis(2,3,6-tri-O-methyl)-α-cyclodextrin (Me18-α-CD) with the oxidized iodide species. The thermocell measurement and UV-vis spectroscopy unveiled the formation of an Me18-α-CD–pentaiodide (I5−) complex, which is in remarkable contrast to the triiodide complex α-CD–I3− previously reported. Although the precipitation of the α-CD–I3− complex in the presence of an electrolyte such as potassium chloride is a problem in thermocells, this issue was solved by using Me18-α-CD as a host compound. The absence of precipitation in the Me18-α-CD and I−/I3− system containing potassium chloride not only improved the Se of the I−/I3− thermocell, but also significantly enhanced the temporal stability of its power output. This is the first observation that I5− species is formed in aqueous solution in a thermocell. Furthermore, the solution equilibrium of the redox couples was controlled by tuning the chemical structure of the host compounds. Thus, the integration of host-guest chemistry with redox couples extends the application of thermocells.
Introduction
Thermo-electric conversion based on the Seebeck effect has attracted much interest due to its potential to retrieve waste heat and convert it to electricity, which provides a promising way to reduce the consumption of fossil fuel. Accordingly, semiconductor-based devices have been utilized as the main thermo-electric materials for many years. However, their small Se limits their development.1–5 Thermocells, often referred to as thermo-electrochemical cells or thermo-galvanic cells, offer an alternative approach for the design of thermo-electric devices, which have attracted increasing attention due to their relatively high Se and low cost.6–8Thermocells are composed of a redox pair that is dissolved into the electrolyte. As reviewed by Quikenden, Pringle et al., various strategies have been devoted to improving the performance of thermocells, and their Se reached up to 1.4 mV K−1 using Pt electrodes and an aqueous solution of [Fe(CN)6]3−/4−.9–11 Recently, carbon nanotubes were utilized as electrodes and the conversion efficiency of the thermocell was enhanced to 3.95% relative to the Carnot cycle.12–14 Ionic liquid-based thermocells have also been extensively studied, which exhibited a high Se of 2.2 mV K−1 in a wide temperature range.15–17 However, strategies to improve the figure-of-merit value is still required for the practical usage of thermocells.
We recently reported the concept of a supramolecular thermocell, which was demonstrated by introducing α-cyclodextrin (α-CD, Fig. S1a†) as a molecular host to the I−/I3− thermocell. α-CD selectively captured the hydrophobic I3− anion, which led to a significant enhancement of Se from 0.8 to 1.4 mV K−1.18 The addition of KCl as the supporting electrolyte resulted in the precipitation of the α-CD–I3− complex in the lower-temperature cells, which further increased the Se value to ca. 2 mV K−1. Polymers such as starch and poly(vinylpyrrolidone) also served as host matrices, which resulted in an increase in Se to 1.5 and 1.2 mV K−1, respectively.19 This host–guest approach is applicable to various types of redox species and its effect is independent of the type of electrode. This was useful in improving the Se value in thermocells, and the highest Se of ca. 2 mV K−1 was achieved for the precipitation–dissolution equilibrium system of α-CD–I3− in aqueous KCl.
Although the addition of KCl was desirable to increase the conductivity of the electrochemical thermocell, the precipitation observed for the α-CD–I3− system decreased the diffusion ratio of the redox species and also impaired the durability of the thermocell. Thus, to solve this issue, it is essential to develop host molecules that show enhanced stability with the inclusion complex in aqueous electrolyte. Herein, we report the use of hexakis(2,3,6-tri-O-methyl)-α-cyclodextrin (Me18-α-CD, Fig. S1c†) as a suitable host molecule for I−/I3− thermocells. The aqueous solution of Me18-α-CD and iodide showed high stability and no precipitation was observed even in the presence of supporting electrolyte. The Se of the thermocell reached 1.92 mV K−1, which is the highest value reported to date for homogeneous I−/I3− thermocells.
In addition, we found that this system showed an unusual off-stoichiometric interaction between Me18-α-CD and I3−, and the formation of Me18-α-CD–pentaiodide (I5−) complex was demonstrated for the first time. It should be noted that the formation of I5− species in aqueous solution has never been confirmed, and its presence has been only reported for solid crystals.20–23 This result shows the design of proper host molecules leads to superior thermoelectric conversion (Fig. 1).
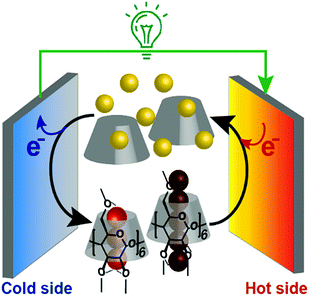 | ||
| Fig. 1 Schematic of a supramolecular thermocell composed of I− (yellow balls), I3− (trio of red balls), I5− (five connected dark red balls) and Me18-α-CD (gray cone-shaped cylinder). | ||
Results and discussion
Thermocell measurement
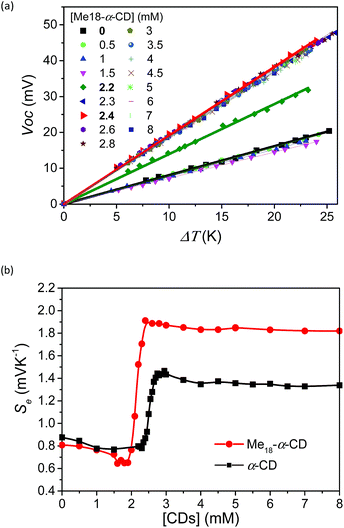
To investigate the effect of host–guest interaction, I−/I3− thermocells were prepared using various concentrations of Me18-α-CD. The concentration of the redox couple was kept same as that in the previous study ([KI] = 10 mM and [I3−] = 2.5 mM).18 In contrast to the previous α-CD–I−/I3− system, the present Me18-α-CD did not cause precipitation, even in the presence of KCl. The detail of the experimental procedure is described in the SI. The open circuit voltage (Voc) of the cell between the hot and cold electrodes corresponds to the generating voltage of the cell. The temperature dependence of Voc at varied concentrations of hosts is shown in Fig. 2a. The Voc values were proportional to the temperature difference (ΔT), where the slope of the line corresponds to the Seebeck coefficient. That is, a high Se value indicates a large voltage with the same temperature difference. In Fig. 2b, the obtained Se was plotted as a function of the Me18-α-CD and α-CD concentration. The data for the α-CD–I−/I3− system was also shown for comparison. The Se value obtained without hosts was 0.84 mV K−1, which confirms the reproducibility of the previous study (0.86 mV K−1).18 In the case of the Me18-α-CD–I−/I3− system, its Se value was almost constant below the Me18-α-CD concentration of 1.5 mM, while a drastic increase was observed above the concentration of 2.0 mM. The high Se value was maintained above the concentration of ca. 2.4 mM. The maximum Se of 1.92 mV K−1 was observed at the concentration of 2.2 mM, which is 1.08 mV K−1 higher than that without host molecules. This value is also ca. 0.5 mV K−1 higher than that obtained from the pristine α-CD–I−/I3− cell system in the absence of KCl and is the highest value observed for homogeneous I−/I3− thermocells. Although we reported a slightly higher Se value of 1.97 mV K−1 for inhomogeneous precipitate–dissolution equilibrium mixtures caused by the addition of KCl to the α-CD–I−/I3− thermocell, the presence of these precipitates significantly decreased its durability.18An inflection point was observed for the curve at [Me18-α-CD] = ca. 2.1 mM, which is well below that observed for α-CD (ca. 2.5 mM). In the case of α-CD, it stoichiometrically captures I3−, thus the concentration of the inflection point was almost the same as the initial concentration of I3−. The observed shift in the inflection point for Me18-α-CD reflects the formation of complexes with different stoichiometries. As discussed below, the observed shift is derived from the complexation of Me18-α-CD with I5− species.
Isothermal titration calorimetry
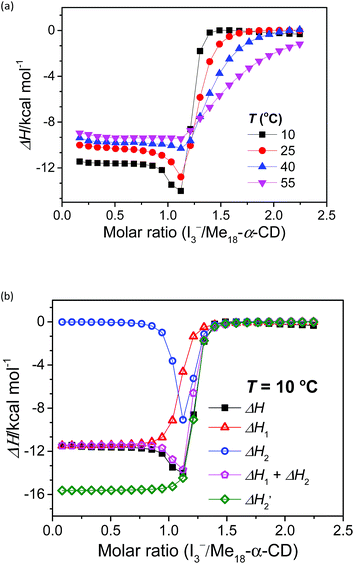
The stoichiometry of Me18-α-CD and the polyiodide anion was investigated by isothermal titration calorimetry (ITC) (Fig. 3a). In the case of pristine α-CD, the inflection point of the ITC curve for α-CD with I3− was observed at ca. 1![[thin space (1/6-em)]](https://www.rsc.org/images/entities/char_2009.gif) :
:![[thin space (1/6-em)]](https://www.rsc.org/images/entities/char_2009.gif) 1, which reflects the 1
1, which reflects the 1![[thin space (1/6-em)]](https://www.rsc.org/images/entities/char_2009.gif) :
:![[thin space (1/6-em)]](https://www.rsc.org/images/entities/char_2009.gif) 1 complexation between I3− and α-CD.18,24–26 In contrast, the inflection point of the ITC curve for Me18-α-CD with I3− was ca. 1.2
1 complexation between I3− and α-CD.18,24–26 In contrast, the inflection point of the ITC curve for Me18-α-CD with I3− was ca. 1.2![[thin space (1/6-em)]](https://www.rsc.org/images/entities/char_2009.gif) :
:![[thin space (1/6-em)]](https://www.rsc.org/images/entities/char_2009.gif) 1 at 10 °C, which further shifted to 1.3
1 at 10 °C, which further shifted to 1.3![[thin space (1/6-em)]](https://www.rsc.org/images/entities/char_2009.gif) :
:![[thin space (1/6-em)]](https://www.rsc.org/images/entities/char_2009.gif) 1 with an increase in temperature. This result shows that the interaction of two I3− molecules with one Me18-α-CD is involved. The most probable reaction is the encapsulation of the I5− ion according to the eqn (1) and (2). The formation of I5− ions in aqueous Me18-α-CD is supported by the UV-Vis and Raman spectral measurements described later.
1 with an increase in temperature. This result shows that the interaction of two I3− molecules with one Me18-α-CD is involved. The most probable reaction is the encapsulation of the I5− ion according to the eqn (1) and (2). The formation of I5− ions in aqueous Me18-α-CD is supported by the UV-Vis and Raman spectral measurements described later.| Me18-α-CD + I3− ⇌ Me18-α-CD–I3− | (1) |
| Me18-α-CD–I3− + I3− ⇌ Me18-α-CD–I5− + I− | (2) |
Since eqn (2) is an equilibrium reaction, the encapsulation reaction occurs at a high concentration of I3−. The ITC curves in Fig. 3a exhibit a hump of ΔH at the molar ratio between 0.8 to 1.1 eq., which can be attributed to the encapsulation of I5−.
To gain insight into the unique ITC data, curve fitting was executed. In the case of pristine α-CD, the ITC curve could be fitted with a simple 1![[thin space (1/6-em)]](https://www.rsc.org/images/entities/char_2009.gif) :
:![[thin space (1/6-em)]](https://www.rsc.org/images/entities/char_2009.gif) 1 binding model between the host and I3− (a simple set of identical sites, SSIS), as reported previously.18,24–26 In contrast, the SSIS model did not fit the ITC curve obtained for the Me18-α-CD–I−/I3− system (Fig. 3a). The fitting was not satisfactory even by applying the TSIS (two sets of independent sites) model, in which two types of sites bind independently to the guest molecules. These observations indicate that the second binding reaction in eqn (2) occurs cooperatively with the complexation between I3− and Me18-α-CD (eqn (1)). We therefore fitted the ITC curve to the model reported by Kataoka et al., which is a modified model based on the SSIS.27 In this model, the concentration of the substance in the second reaction is generated by the initial reaction, and the experimental curve in Fig. 3a was fitted by the simultaneous control of these two interactions. The details of the fitting are revealed in the ESI.† As shown in Fig. 3b, the experimental ITC curve was successively fitted by the sum of ΔH1 and ΔH2 derived from the enthalpy changes according to eqn (1) and (2), respectively. The thermodynamic parameters are shown in Table S3.† The ITC curve of the initial binding stage, i.e., I3− into Me18-α-CD is presented in the red triangles in Fig. 3b. The shift in the stoichiometry from 1
1 binding model between the host and I3− (a simple set of identical sites, SSIS), as reported previously.18,24–26 In contrast, the SSIS model did not fit the ITC curve obtained for the Me18-α-CD–I−/I3− system (Fig. 3a). The fitting was not satisfactory even by applying the TSIS (two sets of independent sites) model, in which two types of sites bind independently to the guest molecules. These observations indicate that the second binding reaction in eqn (2) occurs cooperatively with the complexation between I3− and Me18-α-CD (eqn (1)). We therefore fitted the ITC curve to the model reported by Kataoka et al., which is a modified model based on the SSIS.27 In this model, the concentration of the substance in the second reaction is generated by the initial reaction, and the experimental curve in Fig. 3a was fitted by the simultaneous control of these two interactions. The details of the fitting are revealed in the ESI.† As shown in Fig. 3b, the experimental ITC curve was successively fitted by the sum of ΔH1 and ΔH2 derived from the enthalpy changes according to eqn (1) and (2), respectively. The thermodynamic parameters are shown in Table S3.† The ITC curve of the initial binding stage, i.e., I3− into Me18-α-CD is presented in the red triangles in Fig. 3b. The shift in the stoichiometry from 1![[thin space (1/6-em)]](https://www.rsc.org/images/entities/char_2009.gif) :
:![[thin space (1/6-em)]](https://www.rsc.org/images/entities/char_2009.gif) 1 to ca. 1.2
1 to ca. 1.2![[thin space (1/6-em)]](https://www.rsc.org/images/entities/char_2009.gif) :
:![[thin space (1/6-em)]](https://www.rsc.org/images/entities/char_2009.gif) 1 for the initial bonding stage should be attributed to the contribution of the second binding stage, which consumed a fraction of added I3−.
1 for the initial bonding stage should be attributed to the contribution of the second binding stage, which consumed a fraction of added I3−.
The complexation enthalpy between Me18-α-CD and I3− at various temperatures was extracted in Fig. 4a. The binding constants (K) of Me18-α-CD and I3− were estimated by these fittings and plotted in Fig. 4b. The K of pristine α-CD was also plotted in the figure, which is ca. 25 times larger at 10 °C than that observed at 55 °C, as reported previously.18 On the other hand, Me18-α-CD showed remarkable temperature dependence and a ca. 50-fold increase in K value was observed upon cooling the temperature from 55 °C to 10 °C. This larger change in K observed for Me18-α-CD and I3− enlarged the concentration difference of free I3− between the cold- and hot-branches of the cell.
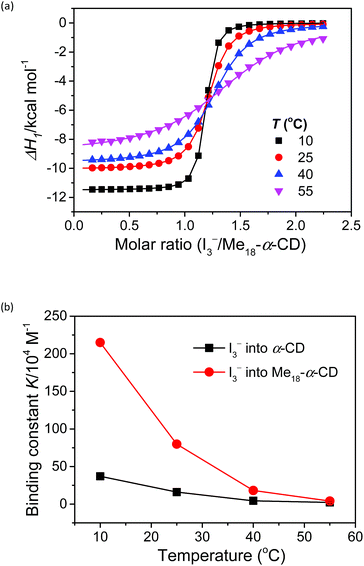 | ||
| Fig. 4 (a) Initial binding enthalpy (ΔH1 in Fig. 3b) of the ITC curves for Me18-α-CD with I3− at various temperatures. (b) Temperature difference in the binding constant, K, observed for α-CD (black squares) and Me18-α-CD (red circles) with I3−. | ||
The enhancement in Se can be attributed to the changes in association enthalpy, where an increase of −1 kcal mol−1 in ΔH increases the Se by 0.06 mV K−1. From Table S3,† the initial binding enthalpy ΔH1 at 25 °C was −10.1 kcal mol−1 and the increment in Se was estimated to be 0.6 mV K−1. On the other hand, Me18-α-CD enhanced the Se of the thermocell to 1.08 mV K−1. This discrepancy indicates that the association of I5− with Me18-α-CD further increased the concentration difference of I3− between both branches of the cell, which further enhanced the Seebeck coefficient.
UV-vis spectroscopy
To investigate the species present in the mixed solution of I2, KI and methyl-α-CD, UV-vis spectroscopy was executed (Fig. 5). The peaks were primarily assigned using reference solutions (Fig. S5†). As shown in Fig. S5,† an aqueous solution of pure KI has two peaks at 192 and 225 nm, which are attributed to the absorption peaks of I−.28,29 When I2 was added to the KI solution, new peaks emerged at 290 and 352 nm, which reflect the formation of I3− ions through eqn (2).28–32| I2 + I− ⇌ I3− | (3) |
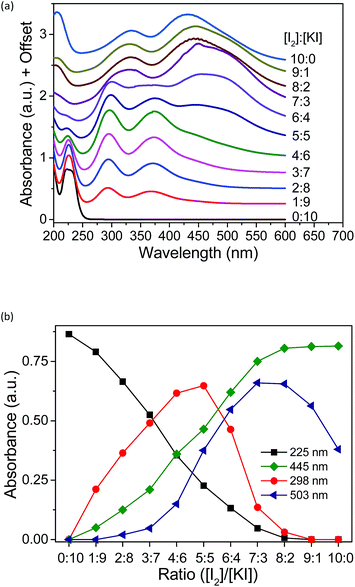 | ||
| Fig. 5 (a) UV-vis spectra of aqueous solutions with varying concentrations. (b) Absorbance of all the peaks in the UV spectra plotted against the ratio of [I2]/[KI]. [Me18-α-CD] = 2.1 mM. | ||
A saturated I2 solution without KI has four peaks at 205, 290, 352, and 460 nm, among which, the peaks at 205 and 460 nm are attributed to I2.28,29,31,32 The other two peaks at 290 and 352 nm are derived from the I3− ion generated by the hydrolysis of iodine, as described in the literature.33–35 The α-CD–I3− complex formed upon the addition of α-CD to the aqueous mixture of KI and I2 gave almost identical peaks at 290 and 353 nm.25,26,35 Moreover, upon the addition of Me18-α-CD, considerable red-shifts to 300 and 375 nm were observed (Fig. S5†), reflecting the complexation by Me18-α-CD according to eqn (1). This red-shift in comparison with that of α-CD can be ascribed to the modified bond distance of I3− in the relatively deeper and more hydrophobic cavity of Me18-α-CD, which may have affected the electronic structure of I3−.36 The component observed for the mixture of I2 and Me18-α-CD at 430 nm is attributed to Me18-α-CD–I2, which is blue shifted due to the elevated LUMO level of I2 by the interaction with the oxygen atoms of Me18-α-CD.37–40 Furthermore, a shoulder peak at 503 nm was observed in the spectrum (Fig. S5†), which has never been reported for the previous solution systems. In the solid state, the absorption at around 500 nm has been assigned to that of the I5− anion;41–46 thus, we attribute the peak at 503 nm to Me18-α-CD–I5−. The complex is formed through eqn (2).
| Me18-α-CD–I3− + I3− ⇌ Me18-α-CD–I5− + I− | (2) |
The formation of Me18-α-CD–I5− was further confirmed by Raman spectroscopy (Fig. S10†) via the increase in the I2 stretching signal at ca. 170 cm−1, which corresponds to I5− as an adduct of I−·2I2.41,47–49
As described above, Me18-α-CD provides deeper hydrophobic cavity compared with that of α-CD (Fig. S1†), which must have stabilized the I5− species in the form of an Me18-α-CD–I5− complex. The assignment of the six peaks is summarized in Table S4.† The I5− ion has been found in solid polarizer films for liquid crystal displays, but to date, it has not been identified in aqueous solutions. Thus, the formation of Me18-α-CD–I5− in aqueous solution provides a way to investigate the property of the discrete I5− ion.
The existing six peaks were further analyzed using Job's method.50 The peaks in Fig. 5a correspond to I− (225 nm), Me18-α-CD–I3− (298 and 372 nm), Me18-α-CD–I2 (326 and 445 nm) and Me18-α-CD–I5− (503 nm). These peaks were separated using Gaussian fitting and the peak intensities were plotted against the initial concentration ratio of I2 and KI, as shown in Fig. 5b. The peak intensity of I− at 225 nm monotonically decreased with an increase in the concentration ratio. Moreover, the absorbance of Me18-α-CD–I3− at 298 nm increased almost proportionally at a low concentration of I2. After reaching the maximum intensity at the ratio of 5![[thin space (1/6-em)]](https://www.rsc.org/images/entities/char_2009.gif) :
:![[thin space (1/6-em)]](https://www.rsc.org/images/entities/char_2009.gif) 5, the peak at 298 nm decreased beyond that ratio. The peak at 445 nm (Me18-α-CD–I2) naturally showed a monotonic increase with an increase in I2 concentration. The peak at 503 nm (Me18-α-CD–I5−) showed the maximum at the [I2]/[KI] ratio of 7
5, the peak at 298 nm decreased beyond that ratio. The peak at 445 nm (Me18-α-CD–I2) naturally showed a monotonic increase with an increase in I2 concentration. The peak at 503 nm (Me18-α-CD–I5−) showed the maximum at the [I2]/[KI] ratio of 7![[thin space (1/6-em)]](https://www.rsc.org/images/entities/char_2009.gif) :
:![[thin space (1/6-em)]](https://www.rsc.org/images/entities/char_2009.gif) 3 to 8
3 to 8![[thin space (1/6-em)]](https://www.rsc.org/images/entities/char_2009.gif) :
:![[thin space (1/6-em)]](https://www.rsc.org/images/entities/char_2009.gif) 2, and decreased beyond this ratio.
2, and decreased beyond this ratio.
If the triiodide is the only polyiodide product in the aqueous mixture of KI and I2, the plot of triiodide species (at 298 nm) should give a parabolic curve. The sharp decrease in Me18-α-CD–I3− (298 nm) and increase in the Me18-α-CD–I5− (503 nm) species between the ratio of 5![[thin space (1/6-em)]](https://www.rsc.org/images/entities/char_2009.gif) :
:![[thin space (1/6-em)]](https://www.rsc.org/images/entities/char_2009.gif) 5 to 7
5 to 7![[thin space (1/6-em)]](https://www.rsc.org/images/entities/char_2009.gif) :
:![[thin space (1/6-em)]](https://www.rsc.org/images/entities/char_2009.gif) 3 indicated that when the ratio of I2 is higher than 5
3 indicated that when the ratio of I2 is higher than 5![[thin space (1/6-em)]](https://www.rsc.org/images/entities/char_2009.gif) :
:![[thin space (1/6-em)]](https://www.rsc.org/images/entities/char_2009.gif) 5, Me18-α-CD–I3− reacts with I3− to give the Me18-α-CD–I5− complex through eqn (2).
5, Me18-α-CD–I3− reacts with I3− to give the Me18-α-CD–I5− complex through eqn (2).
Although molecular iodine is slightly soluble in water (1.18 mM, 20 °C),51–53 no precipitation was observed in our experiments, even in the absence of added KI. This is attributed to the high water solubility of Me18-α-CD–I2 and formation of Me18-α-CD–I5−. In addition, the weak acidity of the saturated iodine solution of pH 6.6 can be associated with the hydrolysis of iodine. The appearance of each solution is shown in Fig. S7.† The dark color of the 10![[thin space (1/6-em)]](https://www.rsc.org/images/entities/char_2009.gif) :
:![[thin space (1/6-em)]](https://www.rsc.org/images/entities/char_2009.gif) 0 solution indicates the coexistence of Me18-α-CD–I2 and Me18-α-CD–I5−.
0 solution indicates the coexistence of Me18-α-CD–I2 and Me18-α-CD–I5−.
Based on these spectral analyses, the concentration of the iodide species in the thermocell was then estimated by UV-vis spectroscopy. Fig. 6a shows the UV spectra with various concentrations of Me18-α-CD at 25 °C. As discussed previously, the two peaks of I3− at 290 and 352 nm showed a red shift upon the addition of Me18-α-CD, which corresponds to the formation of Me18-α-CD–I3−. The other peaks at 445 and 503 nm are attributed to Me18-α-CD–I2 and Me18-α-CD–I5−, respectively. Upon increasing the concentration of Me18-α-CD, the intensity of the peaks at 445 and 503 nm increased and the color of the solution changed from yellow to deep red-black (Fig. S6†), which reflect the formation of Me18-α-CD–I5−. Upon the addition of Me18-α-CD at higher concentrations beyond 3 mM, the color of the solution returned to weak red (Fig. S6†). To understand these color changes, the intensity of the peaks was plotted in Fig. 6b with a variation in the concentration of the host. As the absorbance of I3− (290 nm) decreased, the absorption intensities of the Me18-α-CD–I3− (372 nm) and Me18-α-CD–I2 (445 nm) species increased. The absorbance of Me18-α-CD–I3− and Me18-α-CD–I2 reached almost constant when the concentration of Me18-α-CD was elevated to ca. 3 mM. The absorbance of Me18-α-CD–I5− increased similarly to that of Me18-α-CD–I3− below the Me18-α-CD concentration of 2.1 mM, but it showed an abrupt decrease beyond this host concentration. This indicates that Me18-α-CD–I5− underwent comproportionation to two Me18-α-CD–I3− molecules according to eqn (4).54–57
| Me18-α-CD–I5− + Me18-α-CD + I− ⇌ 2Me18-α-CD–I3− | (4) |
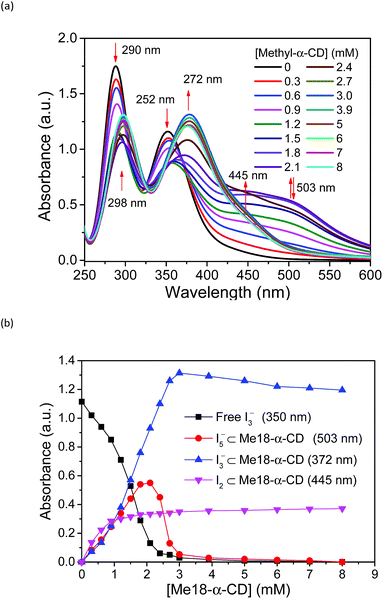 | ||
| Fig. 6 (a) UV-vis spectra of solution 1 with various concentrations of Me18-α-CD at 25 °C. (b) Plots of the peak absorbance of I3−, Me18-α-CD–I3−, Me18-α-CD–I5−, and Me18-α-CD–I2 in (a). | ||
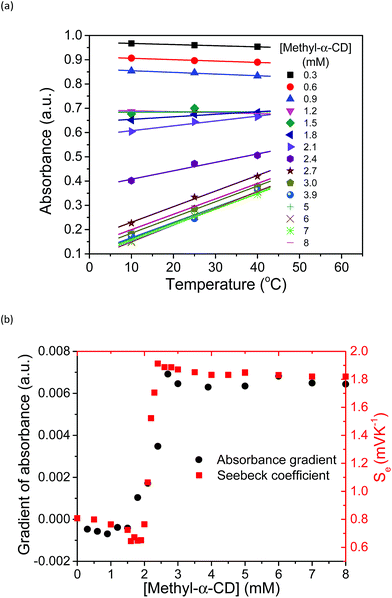
The increase in the VOC and Se values of the thermocell may be associated with the concentration difference in free I3− ions between the lower- and higher-temperature half-cells, which undergo a reduction reaction in the thermocell.18 Therefore, the temperature dependence of the concentration of free I3− was estimated by UV-vis spectroscopy under various host concentrations. All the spectra are revealed in Fig. S8,† and the peak intensity of free I3− species at 352 nm was estimated and plotted at various temperatures and Me18-α-CD concentrations, as shown in Fig. 7a. At lower concentrations of Me18-α-CD, a slight decrease in the peak intensity was observed with an increase in temperature. The peak intensity of free I3− also decreased with an increase in the concentration of Me18-α-CD. Upon an increase in temperature, a relatively large increase in the free I3− signal was observed for the aqueous Me18-α-CD above the host concentration of 1.8 mM. This is ascribed to the decrease in the binding constant between Me18-α-CD and I3− and the dissociation of the complex to liberate free I3− species by heating.
The slope of the lines in Fig. 7a at various Me18-α-CD concentrations was plotted in Fig. 7b. The change in the slope drastically increased in the concentration range of 2.0 to 2.2 mM. The change in the I3− concentration affected the Se, and the trend of the graph quite resembles the curve of Se. Thus, the enhancement of Se of the thermocell can be attributed to the host-guest interaction between Me18-α-CD and I3−.
Temporal stability of the thermocell
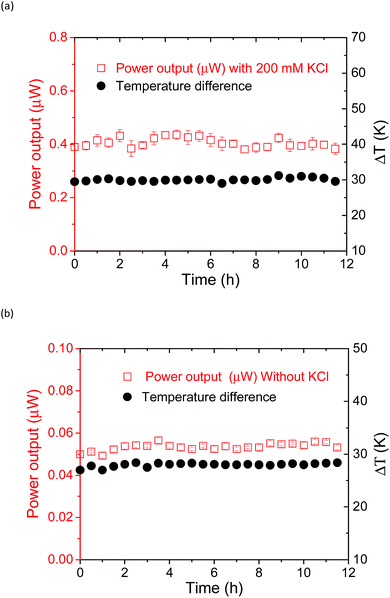
The power output could be obtained by applying an external load voltage (V) to the thermocell (Fig. S11†) and measuring the I–V curves. The maximum power output at each condition was obtained from the plot of power and voltage (Fig. S11b†). The addition of the supporting electrolyte, KCl, to the supramolecular thermocell led to an increase in the current output, as reported previously.18 However, in the previous study, precipitation emerged when pristine α-CD was used as the host matrix, and the power output drastically degraded in 6 h. This precipitation occurred due to the hydrogen bonding between the α-CD–I3− species, which is the fatal flaw for the long-term operation of α-CD-based thermocells. However, such precipitation was not observed when KCl was added to the aqueous mixture of Me18-α-CD, I2 and KI. Apparently, methylation of the hydroxy groups effectively prevented precipitation. Fig. 8 shows the time dependence of the power output obtained for the Me18-α-CD-based supramolecular thermocell with and without KCl. As shown in this figure, a stable power output was observed, reflecting the stability of the Me18-α-CD–I3− complex in aqueous media. The stable power output of the Me18-α-CD–I3−-based thermocell, normalized by the temperature difference, was 0.21 mW m−2 K−1, which is ca. 2.3 times higher than that of the α-CD–I3−-based thermocell after continuous operation for 6 h (0.09 mW m−2 K−1).Conclusions
Me18-α-CD was added to an I−/I3− thermocell and its Seebeck coefficient improved due to host–guest interactions. Compared with pristine α-CD, Me18-α-CD showed stronger interaction with I3−, and the Se of the thermocell was enhanced up to 1.9 mV K−1 without precipitation. The observed Se value is the highest reported for pure-water thermocell systems to date.UV-vis spectroscopy revealed that I5− was captured in the aqueous Me18-α-CD, in addition to Me18-α-CD–I3−. This result is the first observation of I5− formed in an aqueous system. The binding constants of Me18-α-CD and I3− were estimated by ITC measurement. The estimated enhancement of Se was ca. 0.6 mV K−1. The additional enhancement of Se was derived from the formation of I5−, which boosted the concentration difference between the hot and cold branches of the cell. The thermal change in the free I3− concentration was evaluated by UV-vis measurement, which resembled the Se trend. The methylation of the hydroxyl groups in Me18-α-CD effectively prevented the formation of the hydrogen-bonded polymer complexes observed for the α-CD–I3− complex. As a result, the absence of precipitation in the present Me18-α-CD/I3− system offered high durability, which was a critical issue in the previous α-CD–I3− system. These results indicate that the precise design of the host–guest interaction is imperative to improve the performance of thermocells.
Conflicts of interest
There are no conflicts to declare.Acknowledgements
This study was partly supported by JST PRESTO Grant Number JPMJPR141D, Japan and JSPS KAKENHI Grant Numbers JP25220805, JP17H03046, JP26708007 and JP16H06513 (Coordination Asymmetry). The authors gratefully acknowledge the support of ITC measurement from Dr Yu Hoshino (Department of Chemical Engineering, Graduate School of Engineering, Kyushu University).Notes and references
- K. Biswas, J. He, I. D. Blum, C.-I. Wu, T. P. Hogan, D. N. Seidman, V. P. Dravid and M. G. Kanatzidis, Nature, 2012, 489, 414–418 CrossRef CAS PubMed.
- L. M. Goncalves, P. Alpuim and J. H. Correia, J. Electron. Mater., 2010, 39, 1516–1521 CrossRef CAS.
- A. R. M. Siddique, S. Mahmud and B. Van Heyst, Renewable Sustainable Energy Rev., 2017, 73, 730–744 CrossRef.
- T. C. Harman, M. P. Walsh, B. E. Laforge and G. W. Turner, J. Electron. Mater., 2005, 34, L19–L22 CrossRef CAS.
- G. Jeffrey Snyder and E. S. Toberer, Nat. Mater., 2008, 7, 105–114 CrossRef PubMed.
- T. I. Quickenden and Y. Mua, J. Electrochem. Soc., 1995, 142, 3985–3994 CrossRef CAS.
- A. Gunawan, C. H. Lin, D. A. Buttry, V. Mujica, R. A. Taylor, R. S. Prasher and P. E. Phelan, Nanoscale Microscale Thermophys. Eng., 2013, 17, 304–323 CrossRef CAS.
- L. Zhang, T. Kim, N. Li, T. J. Kang, J. Chen, J. M. Pringle, M. Zhang, A. H. Kazim, S. Fang, C. Haines, D. Al-Masri, B. A. Cola, J. M. Razal, J. Di, S. Beirne, D. R. MacFarlane, A. Gonzalez-Martin, S. Mathew, Y. H. Kim, G. Wallace and R. H. Baughman, Adv. Mater., 2017, 29, 1605652 CrossRef PubMed.
- Y. Mua and T. I. Quickenden, J. Electrochem. Soc., 1996, 143, 2558–2564 CrossRef CAS.
- T. I. Quickenden and C. F. Vernon, Sol. Energy, 1986, 36, 63–72 CrossRef CAS.
- M. F. Dupont, D. R. MacFarlane and J. M. Pringle, Chem. Commun., 2017, 53, 6288–6302 RSC.
- R. Hu, B. A. Cola, N. Haram, J. N. Barisci, S. Lee, S. Stoughton, G. Wallace, C. Too, M. Thomas, A. Gestos, M. E. Dela Cruz, J. P. Ferraris, A. A. Zakhidov and R. H. Baughman, Nano Lett., 2010, 10, 838–846 CrossRef CAS PubMed.
- H. Im, T. Kim, H. Song, J. Choi, J. S. Park, R. Ovalle-Robles, H. D. Yang, K. D. Kihm, R. H. Baughman, H. H. Lee, T. J. Kang and Y. H. Kim, Nat. Commun., 2016, 7, 10600 CrossRef CAS PubMed.
- M. S. Romano, N. Li, D. Antiohos, J. M. Razal, A. Nattestad, S. Beirne, S. Fang, Y. Chen, R. Jalili, G. G. Wallace, R. Baughman and J. Chen, Adv. Mater., 2013, 25, 6602–6606 CrossRef CAS PubMed.
- T. J. Abraham, D. R. MacFarlane and J. M. Pringle, Energy Environ. Sci., 2013, 6, 2639–2645 RSC.
- T. J. Abraham, D. R. MacFarlane and J. M. Pringle, Chem. Commun., 2011, 47, 6260–6262 RSC.
- T. Kim, J. S. Lee, G. Lee, H. Yoon, J. Yoon, T. J. Kang and Y. H. Kim, Nano Energy, 2017, 31, 160–167 CrossRef CAS.
- H. Zhou, T. Yamada and N. Kimizuka, J. Am. Chem. Soc., 2016, 138, 10502–10507 CrossRef CAS PubMed.
- H. Zhou, T. Yamada and N. Kimizuka, Sustainable Energy Fuels, 2018, 2, 472–478 RSC.
- E. M. Nour, L. H. Chen and J. Laane, J. Phys. Chem., 1986, 90, 2841–2846 CrossRef CAS.
- E. E. Havinga and E. H. Wiebenga, Acta Crystallogr., 1958, 11, 733–737 CrossRef CAS.
- R. J. Hach and R. E. Rundle, J. Am. Chem. Soc., 1951, 73, 4321–4324 CrossRef CAS.
- F. H. Herbstein and M. Kapon, Nature Phys. Sci., 1972, 239, 153–154 CrossRef CAS.
- S. Kitamura, K. Nakatani, T. Takaha and S. Okada, Macromol. Rapid Commun., 1999, 20, 612–615 CrossRef CAS.
- J. L. Pursell and C. J. Pursell, J. Phys. Chem. A, 2016, 120, 2144–2149 CrossRef CAS PubMed.
- J. W. Minns and A. Khan, J. Phys. Chem. A, 2002, 106, 6421–6425 CrossRef CAS.
- W. Kim, Y. Yamasaki and K. Kataoka, J. Phys. Chem. B, 2006, 110, 10919–10925 CrossRef CAS PubMed.
- S. V. Kireev and S. L. Shnyrev, Laser Phys., 2015, 25, 75602 CrossRef.
- Y. J. Wei, L. C. Ge and L. P. Mo, Spectrosc. Spectr. Anal., 2005, 25, 86–88 CAS.
- Y. Bichsel and U. Von Gunten, Anal. Chem., 1999, 71, 34–38 CrossRef CAS PubMed.
- D. A. Palmer, R. W. Ramette and R. E. Mesmer, J. Solution Chem., 1984, 13, 673–683 CrossRef CAS.
- R. C. Troy, M. D. Kelley, J. C. Nagy and D. W. Margerum, Inorg. Chem., 1991, 30, 4838–4845 CrossRef CAS.
- I. Lengyel, I. R. Epstein and K. Kusth, Inorg. Chem., 1993, 32, 5880–5882 CrossRef CAS.
- J. W. Minns and A. Khan, J. Phys. Chem. A, 2002, 106, 6421–6425 CrossRef CAS.
- V. Calabrese and A. Khan, J. Phys. Chem. A, 2000, 104, 1287–1292 CrossRef CAS.
- D. L. Mould, Biochem. J., 1954, 58, 593–600 CrossRef CAS PubMed.
- R. S. Mulliken, J. Am. Chem. Soc., 1950, 72, 600–608 CrossRef CAS.
- R. P. Lang, J. Am. Chem. Soc., 1962, 84, 1185–1191 CrossRef CAS.
- K. H. Kim, H. Ki, J. H. Lee, S. Park, Q. Kong, J. Kim, J. Kim, M. Wulff and H. Ihee, Phys. Chem. Chem. Phys., 2015, 17, 8633–8637 RSC.
- C. Reichardt, Chem. Rev., 1994, 94, 2319–2358 CrossRef CAS.
- P. H. Svensson and L. Kloo, Chem. Rev., 2003, 103, 1649–1684 CrossRef CAS PubMed.
- H. Kim, Biopolymers, 1982, 21, 2083–2096 CrossRef CAS.
- W. Saenger, Naturwissenschaften, 1984, 71, 31–36 CrossRef CAS.
- E. H. Wiebenga, E. E. Havinga and K. H. Boswijk, Advances inoganic Chem. Radiochem., 1961, vol. 3, pp. 133–169 Search PubMed.
- M. Mizuno, J. Tanaka and I. Harada, J. Phys. Chem., 1981, 85, 1789–1794 CrossRef CAS.
- M. Noltermeyer and W. Saenger, Nature, 1976, 259, 629–632 CrossRef.
- P. Deplano, J. R. Ferraro, M. L. Mercuri and E. F. Trogu, Coord. Chem. Rev., 1999, 188, 71–95 CrossRef CAS.
- P. H. Svensson and L. Kloo, Chem. Rev., 2003, 103, 1649–1684 CrossRef CAS PubMed.
- L. A. Bengtsson, H. Stegemann, B. Holmberg and H. Füllbier, Mol. Phys., 1991, 73, 283–296 CrossRef CAS.
- P. Job, Ann. Chim. Appl., 1928, 9, 113 CAS.
- L. I. Katzin and E. Gebert, J. Am. Chem. Soc., 1955, 77, 5814–5819 CrossRef CAS.
- F. C. Kracek, J. Phys. Chem., 1931, 35, 417–422 CrossRef.
- D. Diaz, I. Vargas-Baca and J. Gracia-Mora, J. Chem. Educ., 1994, 71, 708–714 CrossRef CAS.
- L. Martin, S. Yang, A. C. Brooks, P. N. Horton, L. Male, O. Moulfi, L. Harmand, P. Day, W. Clegg and W. Harrington, CrystEngComm, 2015, 17, 7354–7362 RSC.
- C. A. Filgueiras, J. A. Horn, J. M. Skakle and J. L. Wardell, Acta Crystallogr., Sect. E: Struct. Rep. Online, 2001, 57, o338–o340 CrossRef CAS.
- A. J. Blake, F. A. Devillanova, R. O. Gould, W. Li, S. Parsons and M. Schr, Chem. Soc. Rev., 1998, 27, 195–205 RSC.
- L. Kloo, H. Svensson and M. J. Taylor, J. Chem. Soc., Dalton Trans., 2000, 7, 1061–1065 RSC.
Footnote |
| † Electronic supplementary information (ESI) available. See DOI: 10.1039/c8sc03821j |
| This journal is © The Royal Society of Chemistry 2019 |

