 Open Access Article
A Golgi-targeting fluorescent probe for labile Fe(II) to reveal an abnormal cellular iron distribution induced by dysfunction of VPS35†
Tasuku
Hirayama‡
 *a,
Masatoshi
Inden‡
*b,
Hitomi
Tsuboi
a,
Masato
Niwa
a,
Yasuhiro
Uchida
b,
Yuki
Naka
b,
Isao
Hozumi
b and
Hideko
Nagasawa
 a
a
aLaboratory of Pharmaceutical and Medicinal Chemistry, Gifu Pharmaceutical University, 1-25-4, Daigaku-Nishi, Gifu, 501-1196, Japan. E-mail: hirayamat@gifu-pu.ac.jp
bLaboratory of Medical Therapeutics and Molecular Therapeutics, Gifu Pharmaceutical University, 1-25-4, Daigaku-Nishi, Gifu, 501-1196, Japan. E-mail: inden@gifu-pu.ac.jp
First published on 26th November 2018
Abstract
Iron is involved in numerous physiologically essential processes in our body. However, excessive iron is a pathogenic factor in neurodegenerative diseases, causing aberrant oxidative stress. Divalent metal transporter 1 (DMT1) acts as a primary transporter of Fe(II) ions. The intracellular delivery of DMT1 toward the cellular membrane via the trans-Golgi network during the endocytotic process is partially regulated by a retromer-mediated protein-sorting system comprising vacuolar protein-sorting proteins (VPSs). Thus, together with DMT1, the Golgi-apparatus acts as a hub organelle in the delivery system for intracellular Fe(II) ions. Dysfunction of the VPS-relevant protein sorting system can induce the abnormal delivery of DMT1 toward lysosomes concomitantly with Fe(II) ions. To explore this issue, we developed a fluorescent probe, Gol-SiRhoNox, for the Golgi-specific detection of Fe(II) ions by integrating our original N-oxide-based Fe(II)-specific chemical switch, a new Golgi-localizable chemical motif, and polarity-sensitive fluorogenic scaffold. Our synchronous imaging study using Gol-SiRhoNox and LysoRhoNox, a previously developed fluorescent probe for lysosomal Fe(II), revealed that the intracellular distribution balance of Fe(II) ions between the Golgi apparatus and lysosomes is normally Golgi-dominant, whereas the lysosome-specific elevation of Fe(II) ions was observed in cells with induced dysfunction of VPS35, a member of the retromer complex. Treatment of cells with dysfunctional VPS35 with R55, a molecular chaperone, resulted in the restoration of the subcellular distribution of Fe(II) ions to the Golgi-dominant state. These results indicate that the impairment of the DMT1 traffic machinery affects subcellular iron homeostasis, promoting Fe(II) leakage at the Golgi and lysosomal accumulation of Fe(II) through missorting of DMT1.
Introduction
Iron is the most abundant transition metal on Earth and exhibits potent redox activity. Living organisms utilize the redox activity of iron species to carry out a number of physiologically essential processes, such as oxygen transport, DNA synthesis, respiration, and metabolic reactions.1–3 However, excess iron is potentially toxic because of its uncontrolled redox activity. In particular, labile Fe(II), which is defined as a protein-free or weakly protein-bound form of Fe(II) ions, induces oxidative damage through Fenton chemistry.4–6 Consequently, mammalian cells have evolved a sophisticated cellular system to take up and hold essential iron species without causing undesired oxidative damage.7We have recently succeeded in monitoring the intraendosomal generation of labile Fe(II) during transferrin- (Tf-) mediated endocytosis by using Mem-RhoNox, a fluorescent probe that we developed.8 An imaging study using this probe revealed that the Fe(II)-activated probe accumulated at the Golgi apparatus concomitantly with the cellular membrane. Furthermore, our results demonstrated that previously reported fluorescent probes, including RhoNox-1![[thin space (1/6-em)]](https://www.rsc.org/images/entities/char_2009.gif) 9 and SiRhoNox-1
9 and SiRhoNox-1![[thin space (1/6-em)]](https://www.rsc.org/images/entities/char_2009.gif) 10 that localize in the Golgi/endoplasmic reticulum (ER), sensitively detect not only exogenous but also endogenous labile Fe(II) ions, whereas probes for other organelles, such as a mitochondrial probe,11 are not as sensitive in cells. Considering these findings, we reasoned that the Golgi apparatus may be a key organelle that holds considerable amounts of labile Fe(II).
10 that localize in the Golgi/endoplasmic reticulum (ER), sensitively detect not only exogenous but also endogenous labile Fe(II) ions, whereas probes for other organelles, such as a mitochondrial probe,11 are not as sensitive in cells. Considering these findings, we reasoned that the Golgi apparatus may be a key organelle that holds considerable amounts of labile Fe(II).
During the cellular-iron-uptake process, divalent metal transporter 1 (DMT1) transports Fe(II) ions through the cellular membrane, which metal ions cannot directly permeate. Then, abundant glutathione readily reduces Fe(III) ions to Fe(II) ions and stabilizes Fe(II) ions rather than Fe(III) ions as a labile form.12 The cellular dynamics of DMT1 are regulated by a retromer complex composed of three vacuolar protein-sorting proteins (VPSs), which direct the DMT1 to the cellular membrane via the trans-Golgi network by a retrorecycling process.13 Due to the fact that the retromer-mediated protein-sorting machinery partially controls the subcellular distribution of DMT1, impairment of this machinery can cause missorting of DMT1 proteins to other organelles, including lysosome-associated membrane protein- (Lamp2-) positive organelles, resulting in the disruption of subcellular iron homeostasis.14 Recently, the increasing number of reports have demonstrated that the dysfunction of this retromer-mediated protein sorting machinery, in particular, the mutation of vacuolar protein-sorting protein 35 (VPS35), is involved in the pathogenic mechanisms of severe neurodegenerative diseases including Alzheimer's disease and Parkinson's disease,15–21 in which abnormal deposition of iron in the brain is a hallmark. In this context, we assume that the Golgi apparatus plays a pivotal role in the subcellular trafficking of labile Fe(II) concomitantly with DMT1. Thus, we reasoned that labile Fe(II) ions are primarily held in the Golgi apparatus and that the missorting of DMT1, caused by the dysfunction of VPS35, should facilitate the abnormal accumulation of labile Fe(II) in lysosomes.22
To monitor the labile and reactive Fe(II) species, our group9,10,23 and others24–28 have developed several reactivity-based Fe(II) fluorescent probes with redox-state-selectivity and used them to visualize labile Fe(II) in living cells. DMT1 is delivered into the trans-Golgi network under normal physiological conditions but into lysosomes upon VPS dysfunction14,17 Thus, fluorescent probes for Golgi- and lysosome-specific detection of labile Fe(II) ions provide direct evidence for the impaired fractionation of Fe(II) ions caused by the retromer disorder.
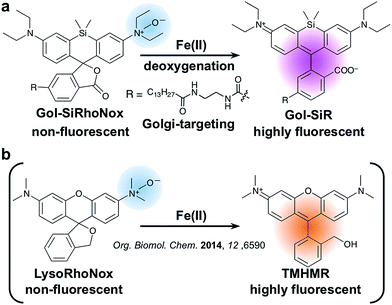
In this article, we report the synthesis, photophysical properties, and live cell imaging applications of a novel Golgi-specific fluorescent probe for Fe(II), termed Gol-SiRhoNox. We demonstrate that Gol-SiRhoNox successfully detects fluctuations in labile Fe(II) levels in a Golgi-specific manner and that labile Fe(II) ions are abundant in the Golgi-apparatus. Furthermore, we apply Gol-SiRhoNox as well as LysoRhoNox (referred to as HMRhoNox-M),23 a previously reported fluorescent probe for lysosomal Fe(II) ions, to a fluorescence imaging study of the subcellular distribution of labile Fe(II) ions in normal and VPS35-knockdown/mutant cells as a cellular model that exhibits impaired retromer functions. The dysfunction of the VPS35 protein has been reported to be a potential risk factor for hereditary Parkinson's syndrome, the phenotype of which depends on the dysfunction of the retromer complex.19,22 A synchronous imaging study of labile Fe(II) in the Golgi-apparatus and lysosomes reveals an altered distribution balance of labile Fe(II) between the Golgi and lysosomes through the missorting of DMT1 in the VPS35-knockdown/mutant cells.
Finally, we reveal that the impaired accumulation of labile Fe(II) caused by the retromer dysfunction can be repaired by treatment with R55, a molecular chaperone which restores the retromer function,29 in VPS35-knockdown cells. Overall, we have established that the organelle-specific fluorescent probes for labile Fe(II) can be applied to the investigation of the abnormal subcellular distribution of labile Fe(II), which is a potential risk factor for neurodegenerative diseases.30,31
Results and discussion
Design and synthesis of Gol-SiRhoNox
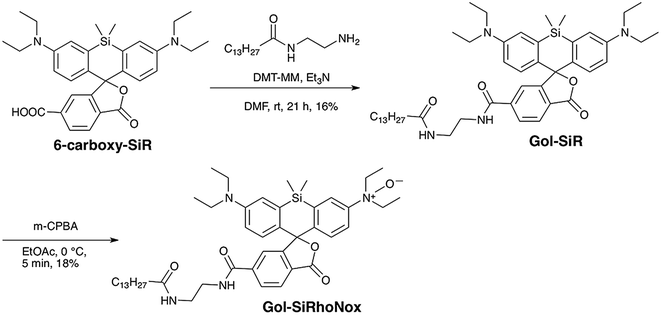
To achieve a selective turn-on response to labile Fe(II), we decided to use the N-oxide strategy, which we have recently established as a selective fluorogenic switch.10 Installation of N-oxide into fluorophores having dialkylarylamine in their π-conjugation system attenuates the fluorescence intensity, whereas the N-oxide can be readily and selectively cleaved via Fe(II)-induced deoxygenation, resulting in fluorescence recovery. We chose SiRhoNox-1, which consists of silicon-fused rhodamine modified with N-oxide, as a fluorogenic scaffold for the detection of Fe(II) ions because of its GFP-compatible color (λex/λem = 645/660 nm) and the fact that it presents the best response in terms of the off/on ratio and kinetics of the probes that we have reported to date.10Tsukiji et al. demonstrated that the myristoyl-Gly-Cys (myrGC) motif can control the localization of small molecules to the inner leaflet of the plasma membrane (iPM) concomitantly with the Golgi apparatus.32 The transportation of myrGC-conjugated molecules requires palmitoylation of the cysteine residue at the Golgi,33 and thus we reasoned that the myristoyl motif without the Gly-Cys (GC) section would enhance subcellular localization specificity at the Golgi without translocation to iPM. Accordingly, we designed Gol-SiRhoNox by conjugating the SiRhoNox-1 scaffold with a myristoyl motif (Scheme 1a). Gol-SiR, a fluorescent control compound without N-oxide, was synthesized via amidation of 6-carboxy-SiR34 with myristoyl ethylenediamine. Then, Gol-SiR was converted to its N-oxide form, Gol-SiRhoNox, by N-oxidation with m-chloroperbenzoic acid (m-CPBA) (Scheme 2). In this research, we utilized LysoRhoNox (Scheme 1b, referred to as HMRhoNox-M in our previous work)23 for the detection of lysosomal labile Fe(II).
Photophysical properties and fluorescence response of Gol-SiRhoNox
Although Gol-SiR, a fluorescent counterpart of Gol-SiRhoNox, shows weak absorbance and fluorescence in a purely aqueous system (Fig. S1a†), its absorption (ε = 16![[thin space (1/6-em)]](https://www.rsc.org/images/entities/char_2009.gif) 000 M−1 cm−1) at 655 nm and fluorescence at 665 nm (λex = 630 nm) increase with the increasing dioxane content in aqueous solutions (Fig. S1b and c†). Maximal absorption is observed in a 30% dioxane/water mixture, suggesting that equilibrium between the closed spirocyclic form and the open quinoid form of Gol-SiR shifts to the fluorescent open configuration for 30% dioxane (quantum yield = 0.47) and to the non-fluorescent closed form under completely aqueous conditions (quantum yield = not measurable) (Table 1). Thus, the open/closed behavior of the Gol-SiR fluorophore is consistent with the previously reported characteristics of the carboxy-SiR.34 The photophysical behaviors including the absorption and fluorescence of Gol-SiRhoNox and Gol-SiR are inert to the pH change from 4 to 9 (Fig. S1d and e†). The detection limit of Gol-SiRhoNox in the aqueous system was calculated to be around 50 nM, which would be high enough to detect endogenous labile Fe(II) (Fig. S1f†).35
000 M−1 cm−1) at 655 nm and fluorescence at 665 nm (λex = 630 nm) increase with the increasing dioxane content in aqueous solutions (Fig. S1b and c†). Maximal absorption is observed in a 30% dioxane/water mixture, suggesting that equilibrium between the closed spirocyclic form and the open quinoid form of Gol-SiR shifts to the fluorescent open configuration for 30% dioxane (quantum yield = 0.47) and to the non-fluorescent closed form under completely aqueous conditions (quantum yield = not measurable) (Table 1). Thus, the open/closed behavior of the Gol-SiR fluorophore is consistent with the previously reported characteristics of the carboxy-SiR.34 The photophysical behaviors including the absorption and fluorescence of Gol-SiRhoNox and Gol-SiR are inert to the pH change from 4 to 9 (Fig. S1d and e†). The detection limit of Gol-SiRhoNox in the aqueous system was calculated to be around 50 nM, which would be high enough to detect endogenous labile Fe(II) (Fig. S1f†).35
| Dye | λ abs (nm) | λ em (nm) | ε (M−1 cm−1) | Φ |
|---|---|---|---|---|
| a The photophysical properties were measured in HEPES buffer (pH 7.4) containing 30% dioxane. b These properties were measured in HEPES buffer (pH 7.4). c The data were cited from ref. 23 and 40. d Not detectable in the visible region. | ||||
| Gol-SiRa | 655 | 665 | 16![[thin space (1/6-em)]](https://www.rsc.org/images/entities/char_2009.gif) 000 000 |
0.47 |
| Gol-SiRhoNoxa | n.d.d | n.d.d | n.d.d | n.d.d |
| TMHMRb,c | 550 | 575 | 98![[thin space (1/6-em)]](https://www.rsc.org/images/entities/char_2009.gif) 000 000 |
0.32 |
| Lyso-RhoNoxb,c | n.d.d | n.d.d | n.d.d | n.d.d |
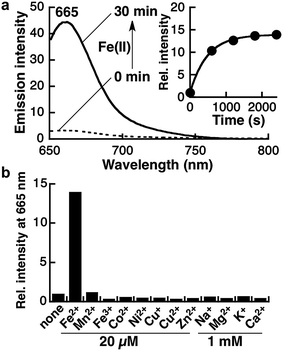
Kim and coworkers evaluated the hydrophobicity of the Golgi apparatus with a solvatochromic fluorophore and revealed that the local polarity at the Golgi apparatus is slightly less lipophilic than dioxane.36 In this context, the spirocyclization properties of Gol-SiR should attenuate the background signal derived from other organelles.34 The spirocyclization of Gol-SiR prompted us to conduct photophysical studies of the fluorescence measurement of Gol-SiRhoNox in the 30% dioxane/water mixed solvent system to assess its fluorescence response to Fe(II). Gol-SiRhoNox shows a significant enhancement of fluorescence intensity (15-fold) at 665 nm within 30 min (Fig. 1a). The apparent response rate of Gol-SiRhoNox to Fe(II) (kobs = 2.1 × 10⁻³ s−1) is as fast as that of SiRhoNox-1 (kobs = 1.7 × 10⁻³ s−1),10 which is a counterpart of Gol-SiRhoNox without the myristoyl substituent moiety. We assume that the detection limit of the probe (∼50 nM) (Fig. S1f†) is sensitive enough to detect labile Fe(II) because intracellular labile Fe(II) is thought to exist at a submicromolar level35 because of the dissociation constants of the intracellular iron chaperones to Fe(II) in micromolar ranges.37–39 Metal selectivity (Fig. 1b) and stability against biological reductants and reactive oxygen species (Fig. S2†) are well conserved in comparison with those of the previous N-oxide-based fluorescent probes.9,10,23 Furthermore, the fluorescence enhancement of Gol-SiRhoNox was not affected in the presence of excess biological reductants including glutathione and β-NADH (nicotineamideadenine dinucleotide reduced form) or a mixture of amino acids (Fig. S2b and c†), which abundantly exist in cells and potentially act as reductants or a ligand of Fe(II). These results indicate that modification with the Golgi-targeting moiety does not affect the response and high selectivity for Fe(II) but enhances the selectivity of the fluorescence signal at the lipophilic Golgi apparatus. The Fe(II)-mediated deoxygenation reaction of Gol-SiRhoNox proceeds almost exclusively to generate fluorescence from Gol-SiR and a similar amount of its dealkylated compound (approximately 40% conversion yield, Fig. S3†) as in the case of the myristoyl-free analogue, SiRhoNox-1.10
Live cell imaging of the Golgi-selective detection of Fe(II)
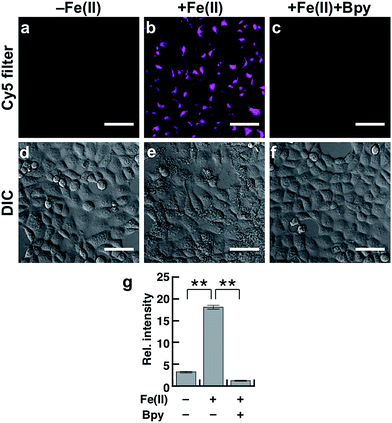
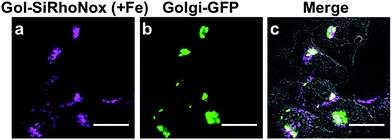
To evaluate the performance of Gol-SiRhoNox for live cell applications, we treated hepatocellular carcinoma (HepG2) cells with Gol-SiRhoNox in the presence and absence of Fe(II) ions. During the experiments, the cells were washed carefully 3 times to remove Fe(II) thoroughly from the medium before the addition of Gol-SiRhoNox, which excludes the possibility of the extracellular activation of the probe. Pretreatment of the cells with Fe(II) causes an observably higher emission signal than that of the control cells (Fig. 2a and b). The total intracellular iron level was also increased by the supplementation of Fe(II) (Fig. S4a†). In contrast, the signal enhancement is completely suppressed by supplementation of 2,2′-bipyridyl (Bpy), a cell-permeable chelator of Fe(II) (Fig. 2b and c). We confirmed that no significant cell death occurred under the present experimental conditions (Fig. S4b†). Furthermore, the imaging study using Gol-SiR, a fluorescent counterpart of Gol-SiRhoNox, revealed that the fluorescence signals did not change during 30 scans over 5 min (Fig. S4c and d†), suggesting that the fluorescent product once generated in cells should be robust against the irradiation of excitation light.The subcellular location of Gol-SiRhoNox was investigated by GFP tagged with a Golgi-localizing signal protein, revealing that the distribution pattern of the Fe(II)-triggered fluorescence signal is in good agreement with that obtained using Golgi-targeted GFP (Fig. 3). We also validated the intracellular localization of the probe by using BODIPY FL C5-ceramide, a commercially available Golgi marker, resulting in the well-overlapped staining pattern compared to the other organelles including mitochondria, lysosomes, and the endoplasmic reticulum (ER) (Fig. S5†). Furthermore, no significant signals on the cell membranes or in the ER are observed, suggesting that the myristoyl group acts as a highly specific Golgi-targeting unit without translocating to the iPM. These images indicate that Gol-SiRhoNox detects labile Fe(II) specifically at the Golgi apparatus. This distinct localization specificity is a notable feature of Gol-SiRhoNox, as our previous probe, SiRhoNox-1, exhibits ER staining.10 The fluorescence response to exogenous Fe(II) in the cells is significantly higher (5.6-fold) than those of the previous probes (<2.0-fold), suggesting that the Golgi apparatus may act as one of the intracellular storages against the acute influx of labile Fe(II). Gol-SiRhoNox was able to distinguish the fluctuation of Fe(II) triggered by exogenously supplemented Fe(II) as low as 1 μM and exhibited a roughly dose-dependent fluorescence enhancement toward the exogenously supplemented Fe(II) over 1 μM (Fig. S6†). Furthermore, Gol-SiRhoNox is sensitive enough to detect endogenous labile Fe(II), which is suggested by the significant decrease in the fluorescence signal level upon treatment with Bpy only (Fig. S7a–d†). Although some types of N-oxide-based probes having near infrared BODIPY scaffolds could be reduced by cytochrome P450 reductase under hypoxic conditions,41,42 we can exclude this possibility because our experiments were performed under normal culture conditions (O2 ≈ 20%) where the reductase-induced reduction of N-oxide can be ignored.43,44 Furthermore, diphenyliodonium chloride (DPI)41,45–47 treatment did not affect the fluorescence signal, indicating that NAD(P)H-dependent reductases did not contribute to the fluorescence response (Fig. S7f–j†).
Live cell imaging study of the effect of VPS35 knockdown on subcellular delivery of labile Fe(II)
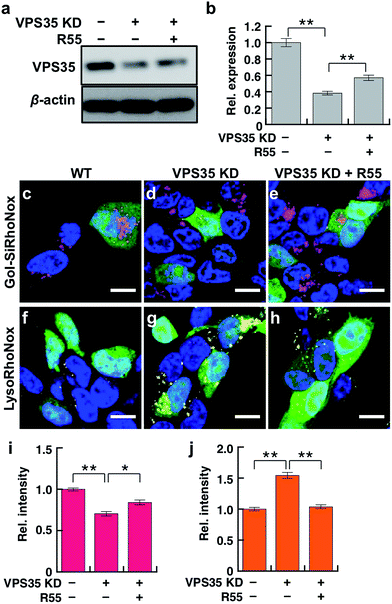
VPS35 is a member of the retromer complex that regulates the intracellular delivery of proteins from endosomes to the trans-Golgi network. DMT1 is the main transporter of Fe(II) ions and one of the cargoes of the retromer complex that includes VPS35.14 Dysfunction of VPS35 is regarded as a risk factor for familial PD owing to the abnormal trafficking/sorting of the cargo proteins,21 and we believe that the missorting of DMT1 causes the undesired distribution and accumulation patterns of labile Fe(II). In this context, we explored the effect of the dysfunction of VPS35 on the subcellular distribution of labile Fe(II) in living SH-SY5Y neuroblastoma cells using two fluorogenic indicators for Golgi and lysosomal labile Fe(II), that is, Gol-SiRhoNox and LysoRhoNox, respectively. Prior to the imaging study of the VPS35 knockdown cells, we evaluated the performance of Gol-SiRhoNox to detect labile Fe(II) in SH-SY5Y cells by addition of exogenous Fe(II) and revealed that the probe could work in SH-SY5Y cells as in the case of HepG2 cells (Fig. S8 and S9†). To simulate the neuronal dysfunction of VPS35, we established an SH-SY5Y cell line with a reduced expression level for VPS35 (VPS35 KD cells), for which the expression of VPS35 protein is stably downregulated by microRNA (Fig. 4a and b). We employed a molecular chaperone compound, R55, which can recover the retromer-dependent cellular functions through upregulation of the VPS35 protein level29 to regulate the mis-sorting of proteins owing to the abnormal retromer function. Prior to the imaging experiments, we confirmed that R55 improves the expression level of VPS35 in VPS35 KD cells (Fig. 4 and b). Additionally, the mislocalization of DMT1 into the lysosomes of VPS35 KD cells was restored to the Golgi-dominant pattern by supplementation with R55 (Fig. S10†).Gol-SiRhoNox exhibits significantly higher fluorescence at the Golgi of the wild-type cells than that of the VPS35 KD cells (Fig. 4c, d and i, indicated by magenta), indicating that the basal level of labile Fe(II) in the Golgi is significantly decreased by the knockdown of VPS35. In contrast, the imaging study with LysoRhoNox reveals a more intense fluorescence signal for VPS35 KD cells than the wild-type cells (Fig. 4f, g and j, indicated by yellow), suggesting that the knockdown of VPS35 induces lysosomal accumulation of labile Fe(II). Treatment of the VPS35 KD cells with R55, which can recover the expression level of VPS35,29 resulted in an increase in Fe(II) at the Golgi (Fig. 4c–e and i) and a decrease in lysosomal Fe(II) (Fig. 4f–h and j), suggesting that the treatment with R55 recovered the labile Fe(II) distribution to the basal state through the recovery of the expression level of VPS35 (Fig. 4a and b). The imaging study reveals that the intracellular distribution of labile Fe(II) is altered by the function and expression level of VPS35.
We investigated whether the present VPS35 KD cells showed disordered retromer trafficking owing to VPS35 dysfunction, that is missorting of DMT1, by immunostaining subcellular DMT1 with TGN46 (Fig. S10a and b†) and Lamp2 (Fig. S10c and d†) as Golgi- and lysosome-marker proteins, respectively. Intracellular localization of DMT1 was observed mainly in the Golgi of the wild-type cells (Fig. S10a and b†) but in the lysosome in VPS35 KD cells (Fig. S10c and d†). The lysosomal localization of DMT1 is a typical phenotype of this retromer dysfunction.14 Subsequently, we found that the accumulation level of labile Fe(II) is correlated with the organelle population of DMT1.
Furthermore, the alteration of this DMT1 localization enhances the sensitivity to exogenous Fe(II) in an organelle-specific manner (Fig. S11†). Supplementation of exogenous Fe(II) ions causes a dramatic enhancement of the fluorescence signal (1.6-fold) at the Golgi in the wild-type cells, but a relatively small increase (1.1-fold) is observed in VPS35 KD cells (Fig. S11a–e†). In contrast, the lysosomes of VPS35 KD cells are more sensitive to exogenous Fe(II) (2.4-fold) than those of wild-type cells (1.5-fold, Fig. S11f–j†). A similar trend is observed in the cells overexpressing mutant VPS35 (D620N), a PD-linked VPS35 mutation (Fig. S12†).
The enhancement of the fluorescence signal from the probes is not caused by the altered accumulation level of the probes themselves between the wild-type and VPS35 KD cell lines, as evidenced by the fact that the fluorescent analogue of the probe (Gol-SiR) and LysoTracker® deep red (Golgi and lysosomal markers, respectively) exhibit identical staining and fluorescence signals in both the cell lines (Fig. S13†). Dysfunction of VPS35 does not facilitate iron uptake, as verified by measuring the total iron content of the cell lysates by atomic absorption spectrometry (Fig. S14†), indicating that the distribution of labile Fe(II) altered not extracellularly but intracellularly.
The present imaging study thoroughly demonstrates that dysfunction of VPS35 impairs the Golgi-network trafficking of iron and promotes lysosomal accumulation of Fe(II). Such an aberrant accumulation of Fe(II) ions in neuronal lysosomes is widely considered to be a potential risk factor for neurodegenerative diseases.30,31 In our study, a significant accumulation of α-synuclein, which has been implicated as a risk factor for PD,30 was observed in VPS35 KD cells (Fig. S15†).
Accordingly, the treatment of VPS35 KD cells with R55 causes a shift in the distribution pattern of labile Fe(II) from a lysosome-dominant to a Golgi-dominant pattern, which is in good agreement with the staining pattern of the wild-type cells (Fig. 4). Thus, the significant recovery of Golgi labile Fe(II) and the decrease in lysosomal Fe(II) are induced by treatment with R55 (Fig. 4e, h, i and j). The present data indicate that the protein expression level of VPS35 is tightly linked to the distribution of labile Fe(II) and that dysfunction of the retromer-mediated cellular trafficking is directly correlated with the accumulation of Fe(II) in the lysosomes.
Conclusion
We have developed Gol-SiRhoNox as a new fluorescence probe for the specific detection of labile Fe(II) at the Golgi apparatus by tethering a lipid-based Golgi targeting moiety and an N-oxide-based fluorogenic molecule. The probe exhibits a turn-on response to Fe(II) with high selectivity and can be used to detect labile Fe(II) in live cells in a Golgi-specific manner without translocating onto the iPM domain. The imaging study using Gol-SiRhoNox depicts a prominent fluorescence increase upon exogenous Fe(II) supplementation, indicating that the Golgi apparatus acts as a potential subcellular storage against the acute influx of labile Fe(II).Gol-SiRhoNox was used orthogonally with LysoRhoNox, which is a lysosome-specific fluorescent probe, for live-cell imaging to visualize the population of intracellular labile Fe(II) in the Golgi and lysosome simultaneously. Our complementary imaging study revealed that the subcellular distribution balance of labile Fe(II) between the Golgi and lysosomes can be perturbed by the dysfunction of the retromer protein VPS35 as an essential component of the retromer involved in the cellular sorting and delivery system.
In the wild-type cells, the Golgi apparatus is significantly sensitive to exogenous supplementation of Fe(II) and potentially rich in labile Fe(II). In contrast, the VPS35 KD cells exhibited a relatively low population of Fe(II) at the Golgi and severe accumulation of Fe(II) in the lysosome compared to the wild-type.
A molecular chaperone, R55, which repairs the subcellular transporting machinery via upregulation of the expression level of VPS35, restored the normal distribution of Fe(II) in the VPS35 KD cells. Since DMT1 is a representative cargo protein and regulates intracellular iron transportation, the impairment of iron transport and metabolism is a prominent phenomenon in dopaminergic neurons in PD sufferers.48 In addition, a strong correlation between defects in iron homeostasis and neurodegeneration has been identified by investigation into a group of diseases known as Neurodegeneration with Brain Iron Accumulation (NBIA), which are characterized by excessive iron deposition in the basal ganglia, globus pallidus, substantia nigra, and cerebellar dentate nuclei.49 Defects in iron homeostasis are also implicated in several other neurodegenerative diseases such as PD,48 Alzheimer's disease,16 Huntington's disease,50 amyotrophic lateral sclerosis,51 SENDA,52 and prion disease.53
In the present study, our complementary imaging approach using our novel organelle-targeting Fe(II) probes revealed that the dysfunction of VPS35 causes an abnormal iron distribution in the cells through missorting of DMT1. Taken together, the present set of probes (with some probes currently under development in our group) for labile Fe(II) species is a powerful tool to investigate the association between iron homeostasis and the causative genes related to membrane trafficking as well as NBIA.
Conflicts of interest
The authors declare no competing financial interest.Acknowledgements
This work was financially supported by JSPS KAKENHI (no. 25702050 for T. H. and JP17K08311 for M. I.). M. N. was supported by a Grant-in Aid for JSPS Fellows. We thank Ms. Emi Inaba for her technical assistance.References
- N. C. Andrews, Nat. Rev. Genet., 2000, 1, 208–217 CrossRef CAS PubMed.
- M. Costas, M. P. Mehn, M. P. Jensen and L. Que, Chem. Rev., 2004, 104, 939–986 CrossRef CAS PubMed.
- S. Puig, L. Ramos-Alonso, A. M. Romero and M. T. Martinez-Pastor, Metallomics, 2017, 9, 1483–1500 RSC.
- W. Sung and J. Morgan, Environ. Sci. Technol., 1980, 14, 561–568 CrossRef CAS.
- B. Halliwell and J. M. C. Gutteridgeb, FEBS Lett., 1992, 307, 108–112 CrossRef CAS PubMed.
- S. Enami, Y. Sakamoto and A. J. Colussi, Proc. Natl. Acad. Sci. U. S. A., 2014, 111, 623–628 CrossRef CAS PubMed.
- G. J. Anderson and C. D. Vulpe, Cell. Mol. Life Sci., 2009, 66, 3241–3261 CrossRef CAS PubMed.
- M. Niwa, T. Hirayama, I. Oomoto, D. O. Wang and H. Nagasawa, ACS Chem. Biol., 2018, 13, 1853–1861 CrossRef CAS PubMed.
- T. Hirayama, K. Okuda and H. Nagasawa, Chem. Sci., 2013, 4, 1250–1256 RSC.
- T. Hirayama, H. Tsuboi, M. Niwa, A. Miki, S. Kadota, Y. Ikeshita, K. Okuda and H. Nagasawa, Chem. Sci., 2017, 8, 4858–4866 RSC.
- T. Hirayama, S. Kadota, M. Niwa and H. Nagasawa, Metallomics, 2018, 10, 794–801 RSC.
- R. C. Hider and X. Kong, Dalton Trans., 2013, 42, 3220–3229 RSC.
- C. Burd and P. J. Cullen, Cold Spring Harbor Perspect. Biol., 2014, 6, a016774 CrossRef PubMed.
- M. Tabuchi, I. Yanatori, Y. Kawai and F. Kishi, J. Cell Sci., 2010, 123, 756–766 CrossRef CAS PubMed.
- S. A. Small and G. A. Petsko, Nat. Rev. Neurosci., 2015, 16, 126–132 CrossRef CAS PubMed.
- A. A. Belaidi and A. I. Bush, J. Neurochem., 2016, 139, 179–197 CrossRef CAS PubMed.
- M. Ando, M. Funayama, Y. Li, K. Kashihara, Y. Murakami, N. Ishizu, C. Toyoda, K. Noguchi, T. Hashimoto, N. Nakano, R. Sasaki, Y. Kokubo, S. Kuzuhara, K. Ogaki, C. Yamashita, H. Yoshino, T. Hatano, H. Tomiyama and N. Hattori, Mov. Disord., 2012, 27, 1413–1417 CrossRef CAS PubMed.
- C. M. Cahill, D. K. Lahiri, X. Huang and J. T. Rogers, Biochim. Biophys. Acta, 2009, 1790, 615–628 CrossRef CAS PubMed.
- C. Vilariño-Güell, C. Wider, O. a. Ross, J. C. Dachsel, J. M. Kachergus, S. J. Lincoln, A. I. Soto-Ortolaza, S. a. Cobb, G. J. Wilhoite, J. a. Bacon, B. Behrouz, H. L. Melrose, E. Hentati, A. Puschmann, D. M. Evans, E. Conibear, W. W. Wasserman, J. O. Aasly, P. R. Burkhard, R. Djaldetti, J. Ghika, F. Hentati, A. Krygowska-Wajs, T. Lynch, E. Melamed, A. Rajput, A. H. Rajput, A. Solida, R.-M. Wu, R. J. Uitti, Z. K. Wszolek, F. Vingerhoets and M. J. Farrer, Am. J. Hum. Genet., 2011, 89, 162–167 CrossRef PubMed.
- T. Hasegawa, N. Sugeno, A. Kikuchi and T. Baba, Tohoku J. Exp. Med., 2017, 242, 63–76 CrossRef PubMed.
- W. Wang, X. Wang, H. Fujioka, C. Hoppel, A. L. Whone, M. A. Caldwell, P. J. Cullen, J. Liu and X. Zhu, Nat. Med., 2016, 22, 54–63 CrossRef CAS PubMed.
- A. Zimprich, A. Benet-Pagès, W. Struhal, E. Graf, S. H. Eck, M. N. Offman, D. Haubenberger, S. Spielberger, E. C. Schulte, P. Lichtner, S. C. Rossle, N. Klopp, E. Wolf, K. Seppi, W. Pirker, S. Presslauer, B. Mollenhauer, R. Katzenschlager, T. Foki, C. Hotzy, E. Reinthaler, A. Harutyunyan, R. Kralovics, A. Peters, F. Zimprich, T. Brücke, W. Poewe, E. Auff, C. Trenkwalder, B. Rost, G. Ransmayr, J. Winkelmann, T. Meitinger and T. M. Strom, Am. J. Hum. Genet., 2011, 89, 168–175 CrossRef CAS PubMed.
- M. Niwa, T. Hirayama, K. Okuda and H. Nagasawa, Org. Biomol. Chem., 2014, 12, 6590–6597 RSC.
- B. Spangler, C. W. Morgan, S. D. Fontaine, M. N. Vander Wal, C. J. Chang, J. A. Wells and A. R. Renslo, Nat. Chem. Biol., 2016, 12, 680–685 CrossRef CAS PubMed.
- A. T. Aron, M. O. Loehr, J. Bogena and C. J. Chang, J. Am. Chem. Soc., 2016, 138, 14338–14346 CrossRef CAS PubMed.
- A. T. Aron, M. C. Heffern, Z. R. Lonergan, M. N. Vander Wal, B. R. Blank, B. Spangler, Y. Zhang, H. M. Park, A. Stahl, A. R. Renslo, E. P. Skaar and C. J. Chang, Proc. Natl. Acad. Sci. U. S. A., 2017, 114, 12669–12674 CrossRef CAS PubMed.
- A. T. Aron, A. G. Reeves and C. J. Chang, Curr. Opin. Chem. Biol., 2018, 43, 113–118 CrossRef CAS PubMed.
- C. M. Ackerman, S. Lee and C. J. Chang, Anal. Chem., 2017, 89, 22–41 CrossRef CAS PubMed.
- V. J. Mecozzi, D. E. Berman, S. Simoes, C. Vetanovetz, M. R. Awal, V. M. Patel, R. T. Schneider, G. a. Petsko, D. Ringe and S. a. Small, Nat. Chem. Biol., 2014, 10, 443–449 CrossRef CAS PubMed.
- L. Zecca, M. B. H. Youdim, P. Riederer, J. R. Connor and R. R. Crichton, Nat. Rev. Neurosci., 2004, 5, 863–873 CrossRef CAS PubMed.
- D. Hare, S. Ayton, A. Bush and P. Lei, Front. Aging Neurosci., 2013, 5, 1–19 Search PubMed.
- M. Ishida, H. Watanabe, K. Takigawa, Y. Kurishita, C. Oki, A. Nakamura, I. Hamachi and S. Tsukiji, J. Am. Chem. Soc., 2013, 135, 12684–12689 CrossRef CAS PubMed.
- S. P. Creaser and B. R. Peterson, J. Am. Chem. Soc., 2002, 124, 2444–2445 CrossRef CAS PubMed.
- G. Lukinavičius, K. Umezawa, N. Olivier, A. Honigmann, G. Yang, T. Plass, V. Mueller, L. Reymond, I. R. Corrêa, Z.-G. Luo, C. Schultz, E. a. Lemke, P. Heppenstall, C. Eggeling, S. Manley and K. Johnsson, Nat. Chem., 2013, 5, 132–139 CrossRef PubMed.
- Z. I. Cabantchik, Front. Pharmacol., 2014, 5, 1–11 CAS.
- H. Singh, H. W. Lee, C. H. Heo, J. W. Byun, A. R. Sarkar and H. M. Kim, Chem. Commun., 2015, 51, 12099–12102 RSC.
- I. Yanatori, Y. Yasui, M. Tabuchi and F. Kishi, Biochem. J., 2014, 37, 25–37 CrossRef PubMed.
- H. Shi, K. Z. Bencze, T. L. Stemmler and C. C. Philpott, Science, 2008, 320, 1207–1210 CrossRef CAS PubMed.
- A.-L. Bluteau, H. A. O'Neill, M. C. Kennedy, M. Ikeda-Saito, G. Isaya and L. I. Szweda, Science, 2004, 305, 242–245 CrossRef PubMed.
- S. Kenmoku, Y. Urano, H. Kojima and T. Nagano, J. Am. Chem. Soc., 2007, 129, 7313–7318 CrossRef CAS PubMed.
- H. J. Knox, J. Hedhli, T. W. Kim, K. Khalili, L. W. Dobrucki and J. Chan, Nat. Commun., 2017, 8, 1794 CrossRef PubMed.
- H. J. Knox, T. W. Kim, Z. Zhu and J. Chan, ACS Chem. Biol., 2018, 13, 1838–1843 CrossRef CAS PubMed.
- C. R. Nishida, M. Lee and P. R. O. de Montellano, Mol. Pharmacol., 2010, 78, 497–502 CrossRef CAS PubMed.
- M. Sugiura and R. Kato, J. Pharmacol. Exp. Ther., 1977, 200, 25–32 CAS.
- S. Chakraborty and V. Massey, J. Biol. Chem., 2002, 277, 41507–41516 CrossRef CAS PubMed.
- W. Piao, S. Tsuda, Y. Tanaka, S. Maeda, F. Liu, S. Takahashi, Y. Kushida, T. Komatsu, T. Ueno, T. Terai, T. Nakazawa, M. Uchiyama, K. Morokuma, T. Nagano and K. Hanaoka, Angew. Chem., Int. Ed. Engl., 2013, 52, 13028–13032 CrossRef CAS PubMed.
- C. Riganti, E. Gazzano, M. Polimeni, C. Costamagna, A. Bosia and D. Ghigo, J. Biol. Chem., 2004, 279, 47726–47731 CrossRef CAS PubMed.
- H. Jiang, J. Wang, J. Rogers and J. Xie, Mol. Neurobiol., 2017, 54, 3078–3101 CrossRef CAS PubMed.
- P. Hogarth, J. Mov. Disord., 2015, 8, 1–13 CrossRef PubMed.
- M. Muller and B. R. Leavitt, J. Neurochem., 2014, 130, 328–350 CrossRef CAS PubMed.
- S. Y. Jeong, K. I. Rathore, K. Schulz, P. Ponka, P. Arosio and S. David, J. Neurosci., 2009, 29, 610–619 CrossRef CAS PubMed.
- H. Saitsu, T. Nishimura, K. Muramatsu, H. Kodera, S. Kumada, K. Sugai, E. Kasai-Yoshida, N. Sawaura, H. Nishida, A. Hoshino, F. Ryujin, S. Yoshioka, K. Nishiyama, Y. Kondo, Y. Tsurusaki, M. Nakashima, N. Miyake, H. Arakawa, M. Kato, N. Mizushima and N. Matsumoto, Nat. Genet., 2013, 45, 445–449 CrossRef CAS PubMed.
- N. Singh, PLoS Pathog., 2014, 10, 9–11 Search PubMed.
Footnotes |
| † Electronic supplementary information (ESI) available: NMR spectra of the newly synthesized compounds, experimental details and additional data of synthesis, spectroscopic studies, photostability, knockdown/mutation of VPS35 by lentivirus infection, Western blotting, total iron quantification, cytotoxicity assay, and imaging studies. See DOI: 10.1039/c8sc04386h |
| ‡ These authors contributed equally. |
| This journal is © The Royal Society of Chemistry 2019 |

