 Open Access Article
Creative Commons Attribution 3.0 Unported Licence
Inhibition of autophagic flux by cyclometalated iridium(III) complexes through anion transportation†
Mu-He
Chen‡
a,
Yue
Zheng‡
a,
Xiong-Jie
Cai‡
b,
Hang
Zhang
a,
Fang-Xin
Wang
a,
Cai-Ping
Tan
*a,
Wen-Hua
Chen
 *b,
Liang-Nian
Ji
a and
Zong-Wan
Mao
 *a
*a
aMOE Key Laboratory of Bioinorganic and Synthetic Chemistry, School of Chemistry, Sun Yat-Sen University, Guangzhou 510275, P. R. China. E-mail: tancaip@mail.sysu.edu.cn; cesmzw@mail.sysu.edu.cn
bGuangdong Provincial Key Laboratory of New Drug Screening, School of Pharmaceutical Sciences, Southern Medical University, Guangzhou 510515, P. R. China. E-mail: whchen@smu.edu.cn
First published on 31st January 2019
Abstract
Synthetic anion transporters that can interfere with the intracellular pH homeostasis are gaining increasing attention for tumor therapy, however, the biological mechanism of anion transporters remains to be explored. In this work, two phosphorescent cyclometalated Ir(III) complexes containing 2-phenylpyridine (ppy) as the cyclometalated ligand, and 2,2′-biimidazole (H2biim, Ir1) or 2-(1H-imidazol-2-yl)pyridine (Hpyim, Ir2) as the ancillary ligands have been synthesized and characterized. Due to the protonation and deprotonation process of the N–H groups on H2biim and Hpyim, Ir1 and Ir2 display pH-dependent phosphorescence and can specifically image lysosomes. Both Ir1 and Ir2 can act as anion transporters mainly through the anion exchange mechanism with higher potency observed for Ir1. Mechanism investigation shows that Ir1 and Ir2 can induce caspase-independent cell death through reactive oxygen species (ROS) elevation. As Ir1 and Ir2 can alkalinize lysosomes through anion disturbance, they can inhibit autophagic flux. Our work provides a novel anticancer mechanism of metal complexes, which gives insights into the innovative structure-based design of new metallo-anticancer agents.
Introduction
Autophagy is an important process for cells to recycle waste.1 When autophagy is initiated, various damaged organelles and proteins are encapsulated into the bilayer membrane vesicles, forming autophagosomes. Subsequently, autophagosomes fuse with lysosomes to form autolysosomes. Hydrolytic enzymes in lysosomes degrade the contents of autolysosomes into nutrients that can be re-used by the cell. The relationship between autophagy and cancer is not yet fully understood. Autophagy is described as a double-edged sword in oncology.2,3 The prevailing view is that autophagy is primarily cytoprotective.4 However, when autophagy is extensive and prolonged, cell death may be induced.4–6Cancer cells have many different hallmarks compared with normal cells.7 Dysregulated pH is gradually being considered as one of the hallmarks of cancer.8 Compared with normal cells, cancer cells have a higher intracellular pH and a lower extracellular pH to facilitate tumor proliferation and survival.9 Recently, researchers have begun to reverse the pH gradient of cells by various means and use this method as a new anticancer strategy.10 Anions are important for cells to maintain their pH homeostasis.11 Therefore, synthetic small-molecule anion transporters that can promote the transport of anions through lipophilic membranes and perturb the pH homeostasis are gaining attention as promising anticancer agents.11–14
Organometallic anticancer iridium complexes have drawn the attention of researchers over the past decade because of their different anticancer mechanisms from cisplatin and their potential to overcome cisplatin resistance and side effects.15–18 In particular, phosphorescent cyclometalated iridium(III) complexes have been widely applied in bioimaging and biosensing due to their high photostability, large Stokes' shifts, relatively long emission life-times and environment-sensitive luminescence properties.17 Moreover, the long-lived phosphorescence of the iridium complexes allows for time-gated detection of the signal that can eliminate the short-lived autofluorescence or scattering to produce images with lower background noise.19 In the past few years, cyclometalated iridium(III) complexes have already found a variety of biological applications, such as metallodrugs, biomolecular probes, and living cell imaging agents.20–24 It has been demonstrated that they can act as theranostic anticancer agents by integrating the imaging and therapeutic capabilities into one single molecule.25–28
Synthetic small-molecule anion transporters reported to date are mainly organic small molecules, such as prodigiosin analogues,29–31 squaramide derivatives,32–34 tris-(2-aminoethyl)amine (tren)-based compounds35,36 and calix[4]pyrrole derivatives.12,37–39 To the best of our knowledge, no metal complexes have been reported as anion transporters. In addition, our understanding of the effects of anion transporters on cells is still at a relatively early stage. New types of easy-to-make anion transporters are needed to better understand the mechanism of action of anion transporters at cellular levels. Metal complexes have some advantages to be developed as the anion transporters. For example, Ir complexes have diverse coordination structures, and their lipophilicity can be easily tuned. They have high capability to penetrate cancer cell membranes and can image the biological processes at subcellular levels.
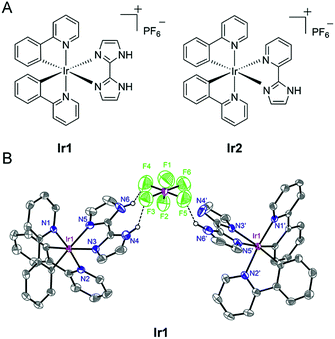
In the present study, we designed two cyclometalated Ir(III) complexes employing 2,2′-biimidazole (H2biim) (Ir1) or 2-(1H-imidazol-2-yl) pyridine (Hpyim) (Ir2) as the ancillary ligands and 2-phenylpyridine (ppy) as the cyclometalated ligand (Fig. 1A). H2biim in Ir1 can act as the anion binding moiety as it contains two N–H groups. Ir2 containing Hpyim with only one N–H group as the protonation and deprotonation site is studied for comparison purposes. Mechanism investigations show that Ir1 can promote cell death by elevation of reactive oxygen species (ROS) levels. As expected, Ir1 can function as an anion transporter and increase the lysosomal pH, leading to autophagic flux inhibition. To our knowledge, this is the first time that metal complexes are reported as anion transporters and their anticancer mechanisms are linked to anion transportation. Our findings provide new insights into the mechanism investigations of metallo-anticancer drugs.
Results and discussion
Synthesis and photophysical properties
Ir1 (ref. 40) and Ir2 were obtained by the direct reaction of H2biim or Hpyim with the dimeric Ir(III) precursor [Ir(ppy)2Cl]2 in CH2Cl2/CH3OH (2![[thin space (1/6-em)]](https://www.rsc.org/images/entities/char_2009.gif) :
:![[thin space (1/6-em)]](https://www.rsc.org/images/entities/char_2009.gif) 1, v/v). The crude products were purified by column chromatography on silica gel. Both complexes were characterized by ESI-MS, 1H NMR, 13C NMR, elemental analysis and X-ray crystallography (Fig. 1B and S1–S5†). The purity of Ir1 and Ir2 is >97% as measured by HPLC. Ir1 and Ir2 are stable in human plasma for 72 h from the HPLC-MS traces (Fig. S6 and S7†). In Ir1, two N–H…F hydrogen bonds are formed inside a positive and negative ion pair, and in addition, an N–H…F hydrogen bond is found between the same anion and another neutral Ir(III) moiety lacking one proton. Such strong hydrogen-bonding interactions of Ir1 with anions indicate the potential of Ir1 as an anion transporter.
1, v/v). The crude products were purified by column chromatography on silica gel. Both complexes were characterized by ESI-MS, 1H NMR, 13C NMR, elemental analysis and X-ray crystallography (Fig. 1B and S1–S5†). The purity of Ir1 and Ir2 is >97% as measured by HPLC. Ir1 and Ir2 are stable in human plasma for 72 h from the HPLC-MS traces (Fig. S6 and S7†). In Ir1, two N–H…F hydrogen bonds are formed inside a positive and negative ion pair, and in addition, an N–H…F hydrogen bond is found between the same anion and another neutral Ir(III) moiety lacking one proton. Such strong hydrogen-bonding interactions of Ir1 with anions indicate the potential of Ir1 as an anion transporter.
The UV/Vis absorption spectra of Ir1 and Ir2 were recorded in phosphate buffer saline (PBS), CH2Cl2 and CH3CN at room temperature (Fig. S8†). The intense energy absorption bands (250–350 nm) of Ir1 and Ir2 can be attributed to the spin-allowed ligand-centered transitions (1LC). The low energy absorption bands at 350–400 nm are assigned to a combination of spin-allowed metal-to-ligand charge transfer (1MLCT) and ligand-to-ligand charge transfer (1LLCT) processes. The lowest absorption tails (400–450 nm) can be assigned to spin-forbidden 3MLCT and 3LLCT transitions.41Ir1 and Ir2 emit green (500–550 nm) light in PBS, CH2Cl2 and CH3CN at room temperature upon excitation at 405 nm (Fig. S9†). Three excited states (3LC, 3MLCT and 3LLCT) possibly contribute to the emission of Ir1 and Ir2.41 Detailed photophysical characteristics are summarized in Table S3.† The luminescence lifetimes of Ir1 and Ir2 range from 27.44 to 132.58 ns and their quantum yields fall between 2% and 13%. Both the emission intensities and lifetimes are solvent-dependent. Ir1 and Ir2 have higher quantum yields in CH3CN than in PBS and CH2Cl2. Besides, Ir1 and Ir2 show higher lifetimes in PBS or CH2Cl2 than in CH3CN.
Protonation/deprotonation processes
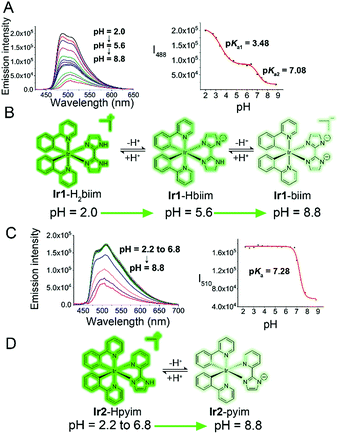
Under physiological conditions, compounds with suitable pKa values can go through reversible protonation/deprotonation processes, which can change their electronic states and photophysical properties.42 The acidity of free H2biim and Hpyim is low (pKa > 11).43,44 However, it has been reported that the acidity of imidazole derivatives increases upon coordination with metal ions due to the stronger stability of the ligand anion, so imidazoles in metal complexes are more susceptible to deprotonation.43 Both UV/Vis absorption spectra and emission spectra of Ir1 and Ir2 exhibit pH-dependent properties (Fig. 2A and C, S10†). The effect of pH on the absorption spectra of the complexes is relatively small. Ir1 and Ir2 display higher absorption peaks in a more alkaline environment (Fig. S10†). The effect of pH on the emission spectra of Ir1 and Ir2 is more significant, and results also show that the protonation/deprotonation processes of Ir1 and Ir2 are different (Fig. 2B and D). Both Ir1 and Ir2 are in the turn-off state and emit weak phosphorescence at neutral and basic pH (pH ≥ 7.4). When the pH decreases to about 2.0, the emission intensity increases about 12- and 3-fold for Ir1 and Ir2, respectively. Ir1 with the H2biim ligand has two protonated/deprotonated sites with two pKa values being 3.48 and 7.08. It can be inferred that Ir1 exists mainly in the Ir1-Hbiim or Ir1-biim form in the cytoplasm (pH ≈ 7.4) and in the Ir1-H2biim or Ir1-Hbiim form in acidic organelles, e.g., lysosomes and endosomes (pH 4.7–6.3).45Ir2 has only one protonated/deprotonated site (pKa = 7.28), so Ir2 exists mainly in the Ir2–pyim form in the cytoplasm and in the Ir2–Hpyim form in acidic organelles. The complexes will become neutral or charged when the protons lose. The off-on effect makes Ir1 and Ir2 suitable for imaging intracellular low pH environments, such as lysosomes and endosomes.Anion transport capability
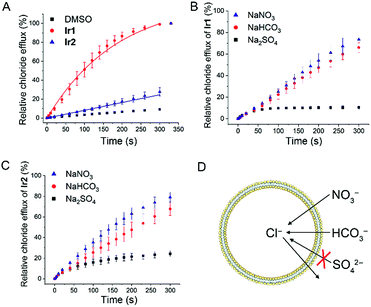
Next, we tested the anion transport ability of Ir1 and Ir2 by a conventional method.46 Vesicles made of egg-yolk L-α-phosphatidylcholine (EYPC) containing 500 mM NaCl and 5 mM citric-phosphate buffer (pH 7.2) were suspended in isotonic and chloride-free 500 mM NaNO3 solutions with citric-phosphate buffer (pH 7.2). After adding the DMSO solution of Ir1 and Ir2, a chloride ion selective electrode was used to monitor the chloride efflux in the solution. The vesicles were lysed by adding 5 wt% Triton X-100 at 300 s and the electrode reading was taken as 100% chloride release.As shown in Fig. 3A and S11,†Ir1 transports about 86% of the chloride anions in 200 s, whereas Ir2 transports only about 17% under the same conditions. By comparing the initial rate of chloride transport (kini), we know that Ir1 (kini = 0.68% s−1) has a much higher chloride transport capacity than Ir2 (kini = 0.08% s−1).
To further confirm this conclusion, we performed pH-dependent and concentration-dependent anion transport experiments (Fig. S12–S23†). By Hill analysis, we obtained the EC50 values of Ir1 and Ir2 under various conditions (Table S4†). The EC50 values that refer to the concentration of a carrier required to release 50% of chloride anions after the same time period can be used to compare the transport ability of different compounds under different conditions.
When the pH inside and outside the vesicles increases from 4.0 to 7.2, the transport activities of both Ir1 and Ir2 increase. Ir1 displays higher transport activity than Ir2, and the EC50 value of Ir1 can reach 0.038 mol% (with respect to lipid). Moreover, the transport activity of Ir1 and Ir2 is mainly affected by the pH outside the vesicle, which implies that the deprotonation process has a profound effect on anion transport activity. Similar transport activity measurements were carried out by suspending the vesicles in NaHCO3 or Na2SO4 solutions (Fig. 3B and C). It can be seen that Ir1 and Ir2 can carry out Cl−/HCO3− transport in addition to Cl−/NO3− transport (Fig. 3D). Only a low level of Cl−/SO42− can be transported by Ir1 and Ir2. The strong hydrophilicity of sulfate anions makes themselves difficult to be transported across the lipid bilayer, so only a very small degree of chloride efflux can be observed when sulfate is the only anion in the external solution. The results imply that Ir1 and Ir2 transport anions primarily through an anion exchange mechanism.
Different metal cations (Li+, Na+, K+, Rb+ and Cs+) do not cause significant difference in the anion transport activity of Ir1 and Ir2, so metal cations are not the main determinants of anion transport (Fig. S24†). To investigate whether Ir1 and Ir2 transport anions through a mechanism of ion channels or carriers, we added cholesterol to the liposomes (EYPC![[thin space (1/6-em)]](https://www.rsc.org/images/entities/char_2009.gif) :
:![[thin space (1/6-em)]](https://www.rsc.org/images/entities/char_2009.gif) cholesterol = 7
cholesterol = 7![[thin space (1/6-em)]](https://www.rsc.org/images/entities/char_2009.gif) :
:![[thin space (1/6-em)]](https://www.rsc.org/images/entities/char_2009.gif) 3 in molar ratio) and then tested its effect on the anion transport activity of Ir1 and Ir2. Cholesterol is thought to increase the viscosity of lipid membranes and reduce the diffusion within the lipid bilayers. Cholesterol can greatly influence mobile carriers, but has little effect on ion channels.32 The addition of cholesterol significantly reduces the anion transport activity of Ir1 and Ir2, indicating that Ir1 and Ir2 do not transport the anion through a channel mechanism (Fig. S25†). Calcein leakage assays show that Ir1 and Ir2 do not cause membrane rupture that can lead to non-specific chloride excretion (Fig. S26†).
3 in molar ratio) and then tested its effect on the anion transport activity of Ir1 and Ir2. Cholesterol is thought to increase the viscosity of lipid membranes and reduce the diffusion within the lipid bilayers. Cholesterol can greatly influence mobile carriers, but has little effect on ion channels.32 The addition of cholesterol significantly reduces the anion transport activity of Ir1 and Ir2, indicating that Ir1 and Ir2 do not transport the anion through a channel mechanism (Fig. S25†). Calcein leakage assays show that Ir1 and Ir2 do not cause membrane rupture that can lead to non-specific chloride excretion (Fig. S26†).
To test whether the complexes have anion transport activity in cells, we chose a chloride-quenching fluorescent indicator N-(ethoxycarbonylmethyl)-6-methoxyquinolinium bromide (MQAE) to detect the concentration of intracellular chloride ions (Fig. S27†).12,34,47 The fluorescence of MQAE is significantly reduced, which indicates that the complexes can induce chloride ion influx in cells. Meanwhile, the intracellular chloride concentrations of the control group are not altered. These results indicate that the complexes possess anion transport activity in cells.
In vitro cytotoxicity
We tested the octanol–water partition coefficient (log![[thin space (1/6-em)]](https://www.rsc.org/images/entities/char_2009.gif) Po/w) of Ir1 and Ir2 and their cytotoxicity towards different cancer cell lines, including human cervical cancer (HeLa), human lung adenocarcinoma (A549), cisplatin-resistant A549 (A549R), human hepatoma (HepG2) and human metastatic breast cancer (MDA-MB-231) as well as human normal liver (LO2) cells by the MTT (3-(4,5-dimethylthiazol-2-yl)-2,5-diphenyltetrazoliumbromide) assay (Table 1). Both Ir1 and Ir2 exhibit higher anticancer activity than cisplatin. In addition, Ir1 and Ir2 are effective on cisplatin-resistant A549R cells, which indicates that they can overcome cisplatin resistance. Ir1 and Ir2 have similar lipophilicity with log
Po/w) of Ir1 and Ir2 and their cytotoxicity towards different cancer cell lines, including human cervical cancer (HeLa), human lung adenocarcinoma (A549), cisplatin-resistant A549 (A549R), human hepatoma (HepG2) and human metastatic breast cancer (MDA-MB-231) as well as human normal liver (LO2) cells by the MTT (3-(4,5-dimethylthiazol-2-yl)-2,5-diphenyltetrazoliumbromide) assay (Table 1). Both Ir1 and Ir2 exhibit higher anticancer activity than cisplatin. In addition, Ir1 and Ir2 are effective on cisplatin-resistant A549R cells, which indicates that they can overcome cisplatin resistance. Ir1 and Ir2 have similar lipophilicity with log![[thin space (1/6-em)]](https://www.rsc.org/images/entities/char_2009.gif) Po/w values being 1.42 and 1.58, respectively. However, Ir1 exhibits higher cytotoxicity than Ir2 in the cancer cells tested.
Po/w values being 1.42 and 1.58, respectively. However, Ir1 exhibits higher cytotoxicity than Ir2 in the cancer cells tested.
| Cell | IC50 (μM) | ||
|---|---|---|---|
| Ir1 | Ir2 | Cisplatin | |
| a IC50 values are drug concentrations necessary for 50% inhibition of cell viability. Data are presented as means ± standard deviations obtained in at least three independent experiments. Cells were treated with the compounds for 48 h. | |||
| HeLa | 3.0 ± 0.2 | 6.9 ± 0.2 | 16.0 ± 1.2 |
| A549 | 3.6 ± 0.4 | 5.9 ± 0.5 | 21.1 ± 1.5 |
| A549R | 8.5 ± 0.3 | 10.6 ± 0.8 | 124.0 ± 9.9 |
| HepG2 | 6.7 ± 1.1 | 10.2 ± 0.8 | 9.1 ± 0.5 |
| MDA-MB-231 | 2.1 ± 0.5 | 7.3 ± 0.8 | 16.4 ± 0.9 |
| LO2 | 5.9 ± 0.4 | 13.3 ± 1.4 | 22.8 ± 2.1 |
Intracellular localization
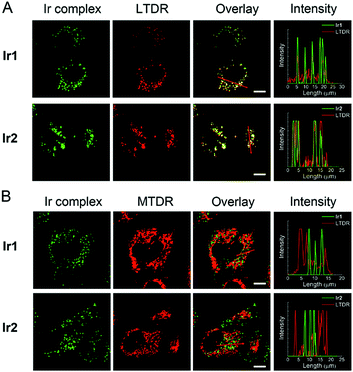
The cellular uptake levels and intracellular localization of Ir1 and Ir2 can be monitored by tracking the luminescence of the complexes using confocal microscopy. The complexes can enter A549 cells and emit intense dot-like green luminescence in the cytoplasm after 2 h incubation (Fig. S28†). In order to study more precisely about the subcellular localization of the complexes, we stained mitochondria and lysosomes with commercial dyes respectively before adding the complexes. The confocal images were quantified by an intensity profile (Fig. 4). The bright green spots of the complexes are clearly overlapping with the lysosomal probe (LysoTracker Deep Red, LTDR). Both complexes show high Pearson's colocalization coefficient (PCC) with LTDR (PCCIr1–LTDR = 0.81, PCCIr2–LTDR = 0.82). In contrast, barely no overlap of luminescent regions between Ir1/Ir2 and the mitochondrial commercial probe (MitoTracker Deep Red, MTDR) can be observed. The PCC values of MTDR with Ir1 and Ir2 are 0.12 and 0.07, respectively. These results indicate that Ir1 and Ir2 can specifically image lysosomes.In order to further explore the mechanism of Ir1 and Ir2 targeting lysosomes, we alkalized lysosomes with bafilomycin (BAF) before adding LTDR or Ir(III) complexes (Fig. S29†). When lysosomes are alkalized, LTDR and the complexes diffusely distribute in the cells and lose their typical intracellular dot-like distribution. Therefore, the acidic environment within lysosomes is one of the necessary conditions for Ir1 and Ir2 to accumulate in lysosomes. The reason for Ir1 and Ir2 to accumulate in lysosomes may be similar to that described for LTDR. LTDR consists of a fluorophore linked to a weak base, and the protonation of weak bases can retain it within the lysosomal membrane.48 The pH-dependent protonation/deprotonation properties of Ir1 and Ir2 and their deprotonation in the cytoplasm to the basic forms may contribute to their ability to target and image acidic lysosomes.
We further used ICP-MS to quantitatively determine the intracellular localization of the complexes (Fig. S30†). The results show that most of the Ir1 and Ir2 remain in the cytoplasm. In addition, a small portion of Ir1 and Ir2 is detected in the mitochondria. This may be due to the lipophilicity of Ir1 and Ir2 after deprotonation, so they can be captured by mitochondria that are also lipophilic. The presence of Ir1 and Ir2 in mitochondria is observed by confocal microscopy, which may be ascribed to the weak fluorescence of the deprotonated forms.
Induction of cell death
Based on the morphological characteristics and biochemical markers, cell death can be divided into several categories, mainly including necrosis, apoptosis and autophagy.49 First, annexin V/propidium iodide (PI) double staining was carried out to verify whether Ir1 and Ir2 induce apoptosis under different treatment conditions (Fig. S31†). The method can identify cells in different stages, such as viable, apoptotic, or necrotic cells.50 A549 cells treated with cisplatin show typical characteristics of early apoptosis (annexin V-positive and PI-negative). No obvious apoptosis features are observed in A549 cells treated with Ir1 or Ir2 within 24 h. However, cells treated with Ir1 (12 μM) show significant apoptotic characteristics after 48 h treatment.During apoptosis, the volume of cells shrinks. We further monitored the volume change of Ir(III)-treated cells (Fig. S32†). The population of cells treated with Ir1/Ir2 under relatively milder conditions is kept at a high forward scatter (FSC) and low side scatter (SSC) state. However, after incubation with Ir1 at 12 μM for 48 h, a separate subpopulation with a low FSC and high SSC profile is formed, which shows the occurrence of apoptosis.
DNA ladder experiments and PI staining of fixed cells were performed to analyse the DNA fragmentation in nuclei. After incubation with Ir1 at 12 μM for 48 h, about 43% of the cells display fragmented nuclei (Fig. S33†). An increase in DNA fragmentation is observed in cells treated with Ir1 at 12 μM for 48 h, which is similar to that found in cisplatin-treated cells (Fig. S34†). However, the integrity of DNA is kept with shorter incubation periods or lower drug concentrations.
Iridium complexes can often induce cell death by producing intracellular ROS.26,27 The impact of Ir1 and Ir2 on ROS levels is measured by 2′,7′-dichlorodihydrofluorescein diacetate (H2DCF-DA) staining and flow cytometry. The nonfluorescent H2DCF-DA can be converted to the highly fluorescent 2′,7′-dichlorofluorescein (DCF) by cellular ROS.51 A concentration-dependent increase in ROS levels is observed in Ir(III)-treated cells (Fig. S35†). The DCF fluorescence increases by about 11- and 9-fold in Ir1- and Ir2-treated (4 μM, 12 h) A549 cells, respectively. Co-treatment of Ir(III) with the ROS scavenger (NAC) leads to marked inhibition of cell death induced by Ir1 and Ir2 (Fig. S36†). These results show that cell death induced by Ir1 and Ir2 is ROS-mediated.
Finally, we used different inhibitors to further study the modes of cell death induced by Ir1 and Ir2. Treatment of Ir1 and Ir2 shows no impact on caspase activation, as evaluated by a Caspase-Glo® 3/7 Assay (Fig. S37†). Accordingly, the pan-caspase inhibitor z-VAD-fmk cannot diminish the cell death-inducing effects of Ir1 and Ir2 (Fig. S38†). Cells pre-treated with 3-methyladenine (3-MA, an autophagy inhibitor) show increased cell viability. Necrostatin-1 (Nec-1, a RIP1-specific inhibitor that can prevent necroptosis) has minimal impact on cell viability. Similarly, cycloheximide (a protein synthesis inhibitor that prevents paraptosis) does not alter the cell viability notably.52,53 These data collectively indicate that Ir1 and Ir2 can mainly induce ROS-mediated and caspase-independent apoptotic cell death.
Inhibition of autophagy
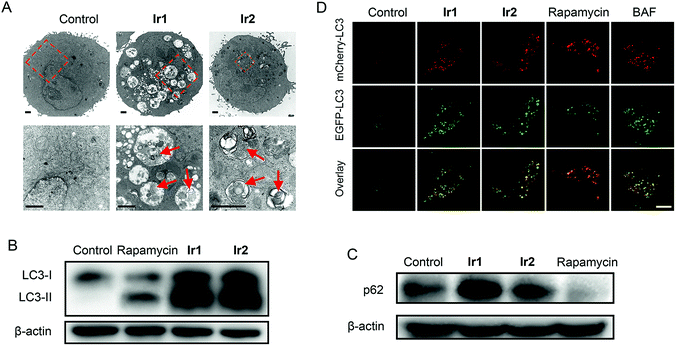
For small molecule-based iridium complexes, the anti-cancer properties are influenced by many factors, e.g., molecular charge, size, substituent group, hydrophobicity/hydrophilicity and subcellular localizations.16,18,54 Small structural modifications may lead to changes in biological activity and the mechanism of action. We used transmission electron microscopy (TEM) to observe the ultrastructural changes in cells treated with Ir1 or Ir2 (Fig. 5A). Compared with the control group, cells treated with Ir1 or Ir2 display many vacuoles containing plenty of undegraded organelles or cytoplasmic substances, whereas the nuclei remain intact. These are typical morphological features of autophagy.55 Besides, the vacuoles in cells treated with Ir2 are obviously fewer than those observed in Ir1-treated cells.Microtubule-associated protein (MAP) light chain 3 (LC3) and p62 protein (also called sequestosome 1, SQSTM1) can be used as markers for events related to autophagy.56,57 During autophagy, the soluble form of LC3 (LC3-I) is converted into the membrane-bound form LC3-II with a spotted distribution in the cytoplasm. When autophagy is induced and lysosomal functions are intact, an increase in LC3-II levels will be accompanied by a decrease in p62 levels. However, when autophagy is blocked due to impaired lysosomal functions, LC3-II and p62 accumulation can be observed. After A549 cells are treated with Ir1 or Ir2 for 24 h, a significant increase in both LC3-II and p62 levels is detected (Fig. 5B and C). However, an increase in LC3-II levels and a decrease in p62 levels are observed for rapamycin that can induce autophagy without significant effects on the lysosomes.58
The tandem fluorescent-tagged protein mCherry-EGFP-LC3 can inhibit autophagic flux based on different pH stability of the fluorescent proteins. EGFP is easily hydrolysed by acidic lysosomes, while mCherry is stable in acidic environments. The fluorescence intensities of mCherry and EGFP in A549 cells treated with Ir1 and Ir2 are similar (Fig. 5D). Similar phenomena are observed in cells treated with the alkalinizing agent BAF. In contrast, rapamycin-treated cells predominantly exhibit strong red fluorescence of mCherry. The results suggest that Ir1 and Ir2 can inhibit the autophagic flux.
Alkalinization of lysosomes
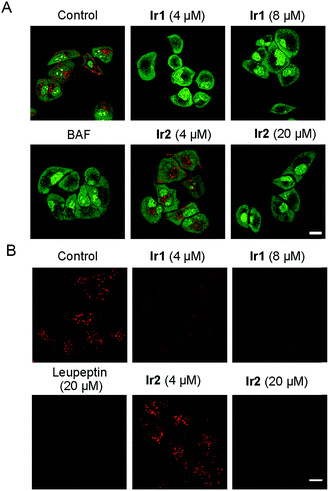
Lysosomes can decompose waste delivered by autophagosomes through internal hydrolases, so lysosomal dysfunction is the main reason for the inhibition of autophagic flux.1 As Ir1 and Ir2 could inhibit the autophagic flux, we next studied their ability to affect the normal function of lysosomes. It has been reported that the chloride concentration inside lysosomes is higher than that outside lysosomes,59 as Ir1 and Ir2 are concentrated in lysosomes and have Cl−/HCO3− transport ability through an anion exchange mechanism. Therefore, the complexes may transport chloride out of lysosomes along the concentration gradient and transport the HCO3− into the lysosomes to balance the charge. As a result, Ir1 and Ir2 may increase the lysosomal pH by increasing the HCO3− concentration in the lysosomes.13First, the acridine orange (AO) staining experiment was performed to determine whether Ir1 and Ir2 could cause lysosomal alkalinization. AO can be protonated, concentrated and dimerized in acidic compartments, and it emits green fluorescence in the cytoplasm/nuclei and red fluorescence in lysosomes.60 It can be seen that the red fluorescence of AO is greatly diminished in cells treated with Ir1 (4 μM, 6 h; Fig. 6A), which indicates that Ir1 can effectively alkalize lysosomes. The capability of Ir2 to alkalize lysosomes is much lower, and a much higher dose (20 μM) is needed to obtain similar effects. Accordingly, LTDR was diffusely distributed in cells and lost its ability to image lysosomes in cells pretreated with Ir1/Ir2 (Fig. S39†). Next, we used a ratiometric lysosomal pH probe, fluorescein–tetramethylrhodamine-labeled dextran, to quantitatively measure the impact of Ir1 and Ir2 on the lysosomal pH. After treatment with Ir1 and Ir2, the lysosomal pH increases from about 4.6 to 6.8 and 5.0 for Ir1 and Ir2, respectively (Fig. S40–42†). These results collectively show that Ir(III) treatment can cause lysosome alkalinisation.
It has been reported that the activity of the proteolytic enzyme cathepsin B is closely related to lysosomal pH.61 Then we measured the cathepsin B activity by using a Magic Red cathepsin detection kit. The cell permeable probe is non-fluorescent, and it emits red fluorescence when the peptide linkage of the probe is cleaved by cathepsin B in lysosomes. A concentration-dependent decrease in the MR-(RR)2 fluorescence is observed in Ir(III)-treated cells (Fig. 6B). The red fluorescence is significantly diminished in cells treated with relatively higher doses of Ir1 (8 μM) and Ir2 (20 μM), which indicates the loss of cathepsin B activity. A similar phenomenon is also observed in cells treated with leupeptin (a serine and cysteine protease inhibitor). As Ir1 and Ir2 can alkalize lysosomes and inactivate hydrolases, they can cause lysosomal dysfunction and block autophagy at the lysosomal stage.
In vivo anticancer activity
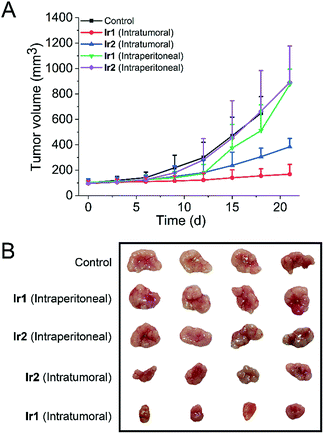
To test whether the iridium complexes can inhibit tumor growth in vivo, we used nude mice implanted with A549 cells (Fig. 7). Mice were divided into five groups (control group, two intratumoral injection groups and two intraperitoneal injection groups). For the intratumoral injection groups, both complexes can inhibit tumor growth and Ir1 exhibits a significantly higher tumor inhibitory effect than Ir2. After three weeks, the tumor volume of Ir1-treated mice decreases by about 75% compared with the control group. No significant change in the body weight of mice is observed in both Ir1- and Ir2-treated mice (Fig. S43†).In addition, H&E staining was performed on excised major organs, including the heart, lung, liver, spleen, and kidney, after intratumoral administration of the complexes. Similarly, no significant abnormalities are observed in the images of the stained organ slices (Fig. S44†). These results suggest that Ir1 and Ir2 have low systemic toxicity.
However, compared with the control group and intratumoral injection groups, no significant therapeutic effect was observed for the intraperitoneal injection groups. This may be attributed to the fact that the complexes do not have obvious tumor-targeting ability. These results indicate that Ir1 and Ir2 process potent in vivo anticancer activities and low systemic toxicity, but structural optimization is still needed to achieve improved tumor-targeting capacities.
Conclusions
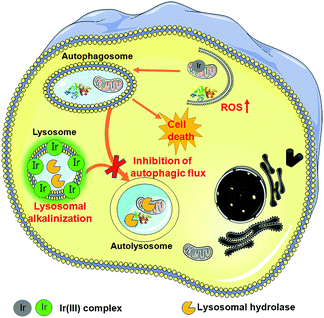
In summary, we have synthesized two cyclometalated iridium(III) complexes, Ir1 and Ir2, as anion transporters. Both Ir1 and Ir2 can promote anion transport in liposomal models. Both complexes exhibit higher in vitro anticancer activities than cisplatin against the cancer cells screened. Ir1 and Ir2 can accumulate in lysosomes and specifically image lysosomes. Ir1 and Ir2 mainly induce cell death through apoptosis by elevating intracellular ROS. Interestingly, Ir1 and Ir2 can increase lysosomal pH and impair the activity of lysosomal enzymes possibly through promoting chloride transport (Fig. 8). Ir1 displays higher potency than Ir2 in lysosomal alkalinization, in vitro cytotoxicity, autophagy induction and autophagic flux inhibition. Moreover, Ir1 displays a good anticancer effect and undetectable systemic toxicity in vivo. Our future study will be concentrated on the structural optimization of metal complexes to achieve better tumor-targeting performance. In all, this study provides new insights into the mechanism investigations of metallo-anticancer drugs and may aid in the future rational design of new types of anion transporters.Conflicts of interest
There are no conflicts to declare.Acknowledgements
This study was supported by the National Natural Science Foundation of China (21778078, 21837006, 21877057, 21571196 and 21572282), the 973 program (2015CB856301), the Guangdong Natural Science Foundation (2015A030306023), the Innovative Research Team in University of Ministry of Education of China (IRT_17R111) and the Fundamental Research Funds for the Central Universities. We thank Prof. Quan Chen from the Institute of Zoology, Chinese Academy of Science for his advice on our paper. All animal procedures were performed in accordance with the Guidelines for Care and Use of Laboratory Animals of Sun Yat-Sen University and the experimental protocols were approved by the Sun Yat-Sen University Animal Care and Use Committee.Notes and references
- B. Levine and D. J. Klionsky, Dev. Cell, 2004, 6, 463–477 CrossRef CAS PubMed.
- A. Apel, H. Zentgraf, M. W. Buchler and I. Herr, Int. J. Cancer, 2009, 125, 991–995 CrossRef CAS PubMed.
- E. White and R. S. DiPaola, Clin. Cancer Res., 2009, 15, 5308–5316 CrossRef PubMed.
- N. Mizushima, B. Levine, A. M. Cuervo and D. J. Klionsky, Nature, 2008, 451, 1069–1075 CrossRef CAS PubMed.
- M. C. Maiuri, E. Zalckvar, A. Kimchi and G. Kroemer, Nat. Rev. Mol. Cell Biol., 2007, 8, 741–752 CrossRef CAS PubMed.
- Y. Chen, E. McMillan-Ward, J. Kong, S. J. Israels and S. B. Gibson, Cell Death Differ., 2008, 15, 171–182 CrossRef CAS PubMed.
- D. Hanahan and R. A. Weinberg, Cell, 2011, 144, 646–674 CrossRef CAS PubMed.
- B. A. Webb, M. Chimenti, M. P. Jacobson and D. L. Barber, Nat. Rev. Cancer, 2011, 11, 671–677 CrossRef CAS PubMed.
- R. A. Gatenby and R. J. Gillies, Nat. Rev. Cancer, 2004, 4, 891–899 CrossRef CAS PubMed.
- D. Neri and C. T. Supuran, Nat. Rev. Drug Discovery, 2011, 10, 767–777 CrossRef CAS PubMed.
- N. Busschaert and P. A. Gale, Angew. Chem., Int. Ed., 2013, 52, 1374–1382 CrossRef CAS PubMed.
- S. K. Ko, S. K. Kim, A. Share, V. M. Lynch, J. Park, W. Namkung, W. Van Rossom, N. Busschaert, P. A. Gale, J. L. Sessler and I. Shin, Nat. Chem., 2014, 6, 885–892 CrossRef CAS PubMed.
- P. A. Gale, R. Perez-Tomas and R. Quesada, Acc. Chem. Res., 2013, 46, 2801–2813 CrossRef CAS PubMed.
- P. A. Gale, J. T. Davis and R. Quesada, Chem. Soc. Rev., 2017, 46, 2497–2519 RSC.
- C. H. Leung, H. J. Zhong, D. S. H. Chan and D. L. Ma, Coord. Chem. Rev., 2013, 257, 1764–1776 CrossRef CAS.
- P. Y. Zhang and P. J. Sadler, J. Organomet. Chem., 2017, 839, 5–14 CrossRef CAS.
- K. K. W. Lo and K. Y. Zhang, RSC Adv., 2012, 2, 12069–12083 RSC.
- Z. Liu and P. J. Sadler, Acc. Chem. Res., 2014, 47, 1174–1185 CrossRef CAS PubMed.
- Y. M. You and S. Y. Park, Adv. Mater., 2008, 20, 3820–3826 CrossRef CAS.
- W. Lv, Z. Zhang, K. Y. Zhang, H. R. Yang, S. J. Liu, A. Q. Xu, S. Guo, Q. Zhao and W. Huang, Angew. Chem., Int. Ed., 2016, 55, 9947–9951 CrossRef CAS PubMed.
- P. Y. Zhang, C. K. C. Chiu, H. Y. Huang, Y. P. Y. Lam, A. Habtemariam, T. Malcomson, M. J. Paterson, G. J. Clarkson, P. B. O'Connor, H. Chao and P. J. Sadler, Angew. Chem., Int. Ed., 2017, 56, 14898–14902 CrossRef CAS PubMed.
- K. K. W. Lo and K. K. S. Tso, Inorg. Chem. Front., 2015, 2, 510–524 RSC.
- L. C. C. Lee, J. C. W. Lau, H. W. Liu and K. K. W. Lo, Angew. Chem., Int. Ed., 2016, 55, 1046–1049 CrossRef CAS PubMed.
- X. D. Song, Y. Qian, R. Ben, X. Lu, H. L. Zhu, H. Chao and J. Zhao, J. Med. Chem., 2013, 56, 6531–6535 CrossRef CAS PubMed.
- L. He, Y. Li, C. P. Tan, R. R. Ye, M. H. Chen, J. J. Cao, L. N. Ji and Z. W. Mao, Chem. Sci., 2015, 6, 5409–5418 RSC.
- Y. Li, C. P. Tan, W. Zhang, L. He, L. N. Ji and Z. W. Mao, Biomaterials, 2015, 39, 95–104 CrossRef CAS PubMed.
- L. He, C. P. Tan, R. R. Ye, Y. Z. Zhao, Y. H. Liu, Q. Zhao, L. N. Ji and Z. W. Mao, Angew. Chem., Int. Ed., 2014, 53, 12137–12141 CrossRef CAS PubMed.
- R. Kumar, W. S. Shin, K. Sunwoo, W. Y. Kim, S. Koo, S. Bhuniya and J. S. Kim, Chem. Soc. Rev., 2015, 44, 6670–6683 RSC.
- J. L. Sessler, L. R. Eller, W. S. Cho, S. Nicolaou, A. Aguilar, J. T. Lee, V. M. Lynch and D. J. Magda, Angew. Chem., Int. Ed., 2005, 44, 5989–5992 CrossRef CAS PubMed.
- B. D. de Grenu, P. I. Hernandez, M. Espona, D. Quinonero, M. E. Light, T. Torroba, R. Perez-Tomas and R. Quesada, Chem.–Eur. J., 2011, 17, 14074–14083 CrossRef PubMed.
- V. Soto-Cerrato, P. Manuel-Manresa, E. Hernando, S. Calabuig-Farinas, A. Martinez-Romero, V. Fernandez-Duenas, K. Sahlholm, T. Knopfel, M. Garcia-Valverde, A. M. Rodilla, E. Jantus-Lewintre, R. Farras, F. Ciruela, R. Perez-Tomas and R. Quesada, J. Am. Chem. Soc., 2015, 137, 15892–15898 CrossRef CAS PubMed.
- N. Busschaert, I. L. Kirby, S. Young, S. J. Coles, P. N. Horton, M. E. Light and P. A. Gale, Angew. Chem., Int. Ed., 2012, 51, 4426–4430 CrossRef CAS PubMed.
- R. B. P. Elmes, N. Busschaert, D. D. Czech, P. A. Gale and K. A. Jolliffe, Chem. Commun., 2015, 51, 10107–10110 RSC.
- N. Busschaert, S. H. Park, K. H. Baek, Y. P. Choi, J. Park, E. N. W. Howe, J. R. Hiscock, L. E. Karagiannidis, I. Marques, V. Felix, W. Namkung, J. L. Sessler, P. A. Gale and I. Shin, Nat. Chem., 2017, 9, 667–675 CrossRef CAS PubMed.
- N. Busschaert, M. Wenzel, M. E. Light, P. Iglesias-Hernandez, R. Perez-Tomas and P. A. Gale, J. Am. Chem. Soc., 2011, 133, 14136–14148 CrossRef CAS PubMed.
- N. Busschaert, P. A. Gale, C. J. E. Haynes, M. E. Light, S. J. Moore, C. C. Tong, J. T. Davis and W. A. Harrell, Chem. Commun., 2010, 46, 6252–6254 RSC.
- M. Yano, C. C. Tong, M. E. Light, F. P. Schmidtchen and P. A. Gale, Org. Biomol. Chem., 2010, 8, 4356–4363 RSC.
- P. A. Gale, C. C. Tong, C. J. E. Haynes, O. Adeosun, D. E. Gross, E. Karnas, E. M. Sedenberg, R. Quesada and J. L. Sessler, J. Am. Chem. Soc., 2010, 132, 3240–3241 CrossRef CAS PubMed.
- H. J. Clarke, E. N. W. Howe, X. Wu, F. Sommer, M. Yano, M. E. Light, S. Kubik and P. A. Gale, J. Am. Chem. Soc., 2016, 138, 16515–16522 CrossRef CAS PubMed.
- M. Ouyang, L. Zeng, K. Qiu, Y. Chen, L. Ji and H. Chao, Eur. J. Inorg. Chem., 2017, 1764–1771 CrossRef CAS.
- L. He, J. Qiao, L. Duan, G. Dong, D. Zhang, L. Wang and Y. Qiu, Adv. Funct. Mater., 2009, 19, 2950–2960 CrossRef CAS.
- L. Wang, Y. Xiao, W. M. Tian and L. Z. Deng, J. Am. Chem. Soc., 2013, 135, 2903–2906 CrossRef CAS PubMed.
- Y. Cui, H. J. Mo, J. C. Chen, Y. L. Niu, Y. R. Zhong, K. C. Zheng and B. H. Ye, Inorg. Chem., 2007, 46, 6427–6436 CrossRef CAS PubMed.
- M.-A. Haga, Inorg. Chim. Acta, 1983, 75, 29–35 CrossRef CAS.
- J. R. Casey, S. Grinstein and J. Orlowski, Nat. Rev. Mol. Cell Biol., 2010, 11, 50–61 CrossRef CAS PubMed.
- Z. Li, X. H. Yu, Y. Chen, D. Q. Yuan and W. H. Chen, J. Org. Chem., 2017, 82, 13368–13375 CrossRef CAS PubMed.
- H. J. Cho, H. Y. Gee, K. H. Baek, S. K. Ko, J. M. Park, H. Lee, N. D. Kim, M. G. Lee and I. Shin, J. Am. Chem. Soc., 2011, 133, 20267–20276 CrossRef CAS PubMed.
- A. M. Kaufmann and J. P. Krise, J. Pharm. Sci., 2007, 96, 729–746 CrossRef CAS PubMed.
- L. Galluzzi, I. Vitale, J. M. Abrams, E. S. Alnemri, E. H. Baehrecke, M. V. Blagosklonny, T. M. Dawson, V. L. Dawson, W. S. El-Deiry, S. Fulda, E. Gottlieb, D. R. Green, M. O. Hengartner, O. Kepp, R. A. Knight, S. Kumar, S. A. Lipton, X. Lu, F. Madeo, W. Malorni, P. Mehlen, G. Nunez, M. E. Peter, M. Piacentini, D. C. Rubinsztein, Y. Shi, H. U. Simon, P. Vandenabeele, E. White, J. Yuan, B. Zhivotovsky, G. Melino and G. Kroemer, Cell Death Differ., 2012, 19, 107–120 CrossRef CAS PubMed.
- R. Overbeeke, H. Steffens-Nakken, I. Vermes, C. Reutelingsperger and C. Haanen, Apoptosis, 1998, 3, 115–121 CrossRef CAS PubMed.
- H. Wang and J. A. Joseph, Free Radicals Biol. Med., 1999, 27, 612–616 CrossRef CAS PubMed.
- K. M. Knopf, B. L. Murphy, S. N. MacMillan, J. M. Baskin, M. P. Barr, E. Boros and J. J. Wilson, J. Am. Chem. Soc., 2017, 139, 14302–14314 CrossRef CAS PubMed.
- M. J. Yoon, A. R. Lee, S. A. Jeong, Y. S. Kim, J. Y. Kim, Y. J. Kwon and K. S. Choi, OncoTargets Ther., 2014, 5, 6816–6831 Search PubMed.
- Q. Zhao, C. H. Huang and F. Y. Li, Chem. Soc. Rev., 2011, 40, 2508–2524 RSC.
- L. Ouyang, Z. Shi, S. Zhao, F. T. Wang, T. T. Zhou, B. Liu and J. K. Bao, Cell Proliferation, 2012, 45, 487–498 CrossRef CAS PubMed.
- Y. Kabeya, N. Mizushima, T. Uero, A. Yamamoto, T. Kirisako, T. Noda, E. Kominami, Y. Ohsumi and T. Yoshimori, EMBO J., 2000, 19, 5720–5728 CrossRef CAS PubMed.
- K. H. Baek, J. Park and I. Shin, Chem. Soc. Rev., 2012, 41, 3245–3263 RSC.
- H. Takeuchi, Y. Kondo, K. Fujiwara, T. Kanzawa, H. Aoki, G. B. Mills and S. Kondo, Cancer Res., 2005, 65, 3336–3346 CrossRef CAS PubMed.
- T. Stauber and T. J. Jentsch, Annu. Rev. Physiol., 2013, 75, 453–477 CrossRef CAS PubMed.
- T. Yoshimori, A. Yamamoto, Y. Moriyama, M. Futai and Y. Tashiro, J. Biol. Chem., 1991, 266, 17707–17712 CAS.
- P. C. Almeida, I. L. Nantes, J. R. Chagas, C. C. A. Rizzi, A. Faljoni-Alario, E. Carmona, L. Juliano, H. B. Nader and I. L. S. Tersariol, J. Biol. Chem., 2001, 276, 944–951 CrossRef CAS PubMed.
Footnotes |
| † Electronic supplementary information (ESI) available: Syntheses and characterization data, anion transport assays, cell lines and culture conditions, cell viability assays, transmission electron microscopy, western blotting, flow cytometry analysis. CCDC 1814116 and 1814117. For ESI and crystallographic data in CIF or other electronic format see DOI: 10.1039/c8sc04520h |
| ‡ These authors contributed equally to this work. |
| This journal is © The Royal Society of Chemistry 2019 |

