 Open Access Article
Support morphology-dependent alloying behaviour and interfacial effects of bimetallic Ni–Cu/CeO2 catalysts†
Yanan
Liu
 ab,
Alan J.
McCue
 c,
Pengfei
Yang
 ab,
Yufei
He
 ab,
Lirong
Zheng
 d,
Xingzhong
Cao
 d,
Yi
Man
 e,
Junting
Feng
 *af,
James A.
Anderson
 *c and
Dianqing
Li
 ab
ab
aState Key Laboratory of Chemical Resource Engineering, Beijing University of Chemical Technology, Beijing, China. E-mail: fengjt@mail.buct.edu.cn
bBeijing Engineering Center for Hierarchical Catalysts, Beijing University of Chemical Technology, Beijing 100029, China
cSurface Chemistry and Catalysis Group, Department of Engineering, University of Aberdeen, Aberdeen, UK. E-mail: j.anderson@abdn.ac.uk
dInstitute of High Energy Physics, Chinese Academy of Sciences, Beijing, China
eBeijing Research Institute of Chemical Industry, Sinopec Group, Beijing, China
fBeijing Advanced Innovation Center for Soft Matter Science and Engineering, Beijing University of Chemical Technology, Beijing, China
First published on 8th February 2019
Abstract
The impregnation method is commonly employed to prepare supported multi-metallic catalysts but it is often difficult to achieve homogeneous and stable alloy structures. In this work, we revealed the dependence of alloying behavior on the support morphology by fabricating Ni–Cu over different shaped CeO2. Specifically, nanocube ceria favoured the formation of monometallic Cu and Ni-rich phases whereas polycrystalline and nanorod ceria induced the formation of a mixture of Cu-rich alloys with monometallic Ni. Surprisingly, nanopolyhedron (NP) ceria led to the generation of homogeneous Ni–Cu nanoalloys owing to the equivalent interactions of Ni and Cu species with CeO2 (111) facets which exposed relatively few coordinative unsaturated sites. More importantly, a strong interfacial effect was observed for Ni–Cu/CeO2-NP due to the presence of CeOx adjacent to metal sites at the interface, resulting in excellent stability of the alloy structure. With the aid of CeOx, NiCu nanoalloys showed outstanding catalytic behaviour in acetylene and hexyne hydrogenation reactions. This study provides valuable insights into how fully alloyed and stable catalysts may be prepared by tailoring the support morphology while still employing a universal impregnation method.
Introduction
The growing demand for energy-efficient industrial processes requires next generation catalysts to deliver higher activity and selectivity with long lifetimes. Alloys have been often preferred over single metals in many important applications as they demonstrate distinct properties compared to the parent metals.1,2 Concerning strategies for synthesis, it is well known that conventional impregnation has been historically employed to fabricate catalysts in industry, but there is a continuing challenge to achieve homogeneous alloy structures for multi-component systems.3,4 Recently, Christopher's group5 showed that the Al2O3 support had a more pronounced effect on the construction of alloys than TiO2 in the impregnation methodology, which provided the possibility for us to develop well-controlled structures by precise regulation of support properties even when the traditional preparation process was employed.As one of the most fascinating rare earth oxides, ceria (CeO2) has been extensively employed in a variety of applications, including catalysis,6–8 fuel cells9 and oxygen sensors10 due to its unique properties and remarkable performance. On account of recent developments in the fabrication of nanomaterials, ceria with controllable facets may be successfully achieved, and thus the influence of specific facets of CeO2 in the field of catalysis was recently explored in depth.11,12 Some proposals discovered that in virtue of the different atomic arrangements and the dissimilarity in surface oxygen vacancies, distinct crystal planes of CeO2 present different reactivities for surface oxygen,13,14 and strongly affect the dispersion,15–17 morphology,18–20 and electronic environment21–23 of active metals in single metal systems. However, studies regarding the influence of CeO2 crystal planes on bimetallic structures have not been reported. Generally speaking, the degree of segregation/mixing in bimetallic AmBn/S catalysts primarily relies on the relative strengths between metal–metal and metal–support.1,2 If A–B bonds are strongest with equal strength of A–S and B–S bonds, this favours mixing; otherwise, segregation is preferred. Given the impact of support properties on the bond strength, it prompts us to explore the dependence of alloying behavior on the support morphology and thus establish a novel and universal route to prepare well-alloyed catalysts simply by controlling the support morphology.
Previously, it has been well documented that ceria can stabilize monometallic nanoparticles due to its reducibility that readily generates a strong interfacial anchoring effect.18 Furthermore, this effect could stabilize single atom catalysts allowing for high thermal stability as reported by Jones6 and Liu groups.24 In terms of bimetallic systems, except for the stability of size, maintenance of the distribution of two different metallic elements within a structure is still a challenging task, mainly lying in the prevention of dealloying inherently caused by the reaction temperature25 or reactants.26,27 Given the ability of ceria to improve the stability of single metals at the atomic level, it inspired us to try to utilize the interfacial effect, highly sensitive to the ceria structure, to enhance the stability, especially the arrangement and distribution of the two metallic elements. Considering both previously mentioned historical problems, simultaneously constructing well-defined and highly stable alloys only by regulating the support morphology could be of great significance.
Herein, in this work, we first explore and put forward the support morphology/facet-dependent alloying behaviour as well as interfacial effects. In detail, a series of CeO2 materials with nanopolyhedron (NP), nanorod (NR), nanocube (NC) and conventional polycrystalline (CV) shapes were fabricated and used as supports to achieve environmentally benign non-noble Ni–Cu catalysts by conventional impregnation. As expected, different morphologies over substrates indeed impact significantly the atomic distribution and stability of active components, as confirmed by XPS, XAS and Cs-corrected STEM. CeO2-NP mainly involving (111) facets contributes to the formation of a homogenous and stable NiCu alloy with a strong interfacial effect originating from CeOx species, whereas nanocube ceria with (100) facets induces the formation of mixtures of monometallic Cu and Ni-rich phases. The nature of how ceria morphology influences the metal alloy is revealed. The well-defined and stable NiCu alloy adjacent to the CeOx surface exhibits the best catalytic performance in the selective hydrogenation of acetylene and hexyne, and the structure–performance relationships are elaborated by a combination study based on in situ DRIFT and chemisorption. This study not only supplies an innovative strategy for fabricating stable and highly alloyed catalysts, but also reveals the essence of the support morphology dependent structure–property relationship.
Results and discussion
Characterization of the support morphology and structure
A series of shape-controlled CeO2 nanocrystals and conventional CeO2 were fabricated by hydrothermal treatment. The crystalline structures and shapes were confirmed by XRD (Fig. S1†) and HRTEM (Fig. 1) with good agreement between the observed reflection profiles, lattice parameters (Table S1†) and those reported in ref. 12–23. In detail, CeO2-CV possesses a polycrystalline structure, which is usually described as a sphere-like shape with various exposed facets including (200), (111) and (220). For CeO2-NP, it preferentially exposes (111) facets, while the dominant (200) facets exist in CeO2-NC.11,28 In terms of nanorod ceria, a domain oriented along the [110] direction is observed. However, very recently, it was reported that ceria rods underwent extensive restructuring at certain temperatures, leading to the exposure of (111)-oriented surface regions resulting from faceting of the {110} plane.29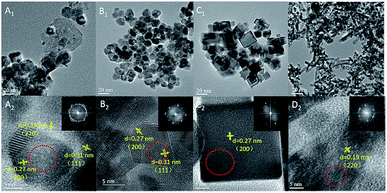 | ||
| Fig. 1 HRTEM of (A) CeO2-CV, (B) CeO2-NP, (C) CeO2-NC, and (D) CeO2-NR. The SAED pattern areas are recorded from the area marked by the red circle. | ||
Likewise, it was also found that CeO2-NC had a contribution from {110} and {111} facets, which increased with calcination temperature. To obtain the proof of nature of facets and the estimated proportion of exposed facets, statistics from Cs-corrected STEM analysis are obtained by counting more than 100 particles for each sample. The ratio of the (111) facet involved in the polyhedron is ca. 90% with 10% of (100) facets, while about 80% of (100) facets with 15% of (110) facets and small amount of (111) facets are observed in CeO2-NC. In terms of nanorod ceria, ca. 50% of (110) facets with 30% of (111) and 20% of (100) facets are involved. For CeO2-CV polycrystalline, it contains ca. 33% of (111), 35% of (100) and 32% of (110) facets.
It is well known that different exposed crystal surfaces could cause different properties such as surface stability, resulting in a different number of low coordination sites, which were recently investigated using methanol adsorption and FTIR. Fig. 2 presents the methanol spectra of CeO2 samples collected after exposure to He from 10 min to 120 min at room temperature. As expected, in the spectrum of each CeO2 sample, the peaks of gas phase/physisorbed methanol at 1054 and 1015 cm−1 assigned to the C–O stretching and at 2978, 2945, and 2919 cm−1 ascribed to the C–H stretching basically disappear after 120 min sweeping.30 However, the peak at 1032 cm−1 still remains, which could be ascribed to the residual physisorbed methanol or chemisorbed bridging methoxy species which is coincidently overlapped with the former one. To further rule out physisorbed methanol species, the samples were heated in He at 120 °C (Fig. S2†). After the treatment at high temperature, the peak at ca. 1032 cm−1 has not disappeared, demonstrating that it should be attributed to chemisorbed methoxy species. In the absence of gas phase/physisorbed methanol, obvious distinctions in the chemisorption of methanol including on-top methoxy (1109 cm−1), bridging methoxy and three-coordinate methoxy (1054–1015 cm−1) are noticed in these samples. The ratio of linear to multi-coordinate methoxy species increases in this order: CeO2-NC < CeO2-NR < CeO2-NP < CeO2-CV, reflecting a few unsaturated sites existing in the truncated polyhedron, while more coordinatively unsaturated sites exist in the rod and cube ceria, which is in agreement with the literature.11 To further confirm this above conclusion, in situ Raman spectroscopy was employed. As shown in Fig. S3,† the feature band ascribed to the 2LO mode of ceria is observed at 1174 cm−1.31
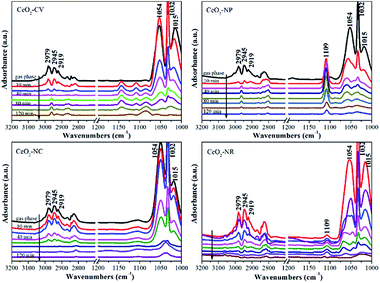 | ||
| Fig. 2 Methanol-IR spectra on different shaped ceria materials after exposure to He at room temperature for 10 min, 20 min, 40 min, 60 min, 80 min, 100 min and 120 min, respectively. | ||
Once exposed in the environment with methanol, additional peaks appear, in which the ones at 1106, 2815, and 2922 cm−1 are owing to on-top methoxy, the peak at 1037 cm−1 is ascribed to bridging methoxy, and the peaks at 2844 and 2952 cm−1 are assigned to physisorbed methanol. As expected, in the process of desorption, the bands of physisorbed methanol obviously decrease, while the peaks of chemisorbed methanol still remain. Relative to the CeO2-CV and CeO2-NP mainly with on-top methoxy species, a higher ratio of multi-coordinate to linear methoxy species is observed in the CeO2-NR and CeO2-NC, which is in agreement with IR results.
Characterization of the catalyst structure
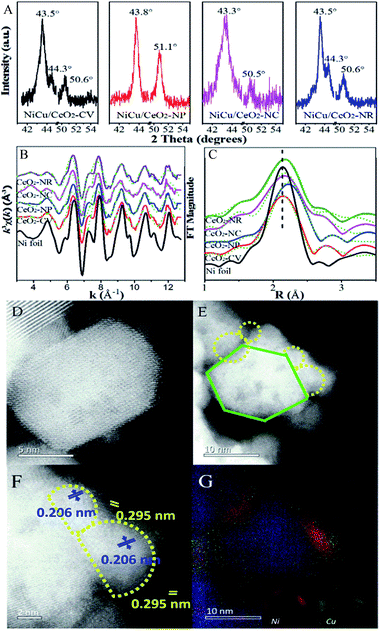
Surface termination of ceria with specific exposed planes plays a key role in the nature of single metal nanoparticles, as it shows the distinct redox capability and concentration of defects. However, the unambiguous identification of this type of function in a bimetallic system is unheard of, and thus support morphology-dependent properties of the active components are first explored. As shown in HRTEM (Fig. S4†) and CO-chemisorption (Table S2†),32,33 the Ni–Cu particle size clearly displays slight differences in the sequence of CeO2-NP (2.6 nm) < CeO2-NC (3.4 nm) ≈ CeO2-NR (3.5 nm) < CeO2-CV (4.3 nm), while the metal dispersion follows the opposite trend. Fig. 3 exhibits the XRD patterns of all four catalysts. The errors of determination are also derived from five measurements (Fig. S5†), indicating that the data are accurate and effective. It is found (Fig. 3A) that a strong diffraction peak at 43.5° with a weak feature at 50.6° is located between the diffraction of monometallic Ni (JCPDS 04-0850) and Cu (JCPDS 04-0836) but close to Cu. Notably, a small shoulder appears at 44.3° indexed to diffraction from the Ni (111) facet. This suggests the formation of Cu rich nanoalloys with monometallic Ni in Ni–Cu/CeO2-CV and Ni–Cu/CeO2-NR. For the CeO2-NP supported catalyst, two peaks at 2θ of 43.8° and 51.1° are observed without any other peaks, illustrating the existence of homogeneous NiCu nanoalloys, while the characteristics of the Cu phase are found at 43.3° and 50.5° along with some small peaks in the cubic CeO2 system, implying the coexistence of monometallic copper and additional components including bimetallic NiCu nanoparticles as well as copper oxide. Considering that the mean particle size of Ni–Cu catalysts in our systems is close to the detection limitation of sampling, the XRD results could be only considered as the auxiliary proof. Thus, the local structure of NiCu nanoparticles is further discussed from the k3-weighted Ni K-edge EXAFS oscillations and the corresponding Fourier transforms (Fig. 3). The fitting parameters including the bond lengths were summarized (Table S2†). Given the disparity between Ni foil (2.49 Å) and Cu foil (2.55 Å), the change of atomic distances in this work is not negligible. In detail, the atomic distances of bimetallic NiCu systems increase ca. 0.2–0.5 Å, compared with the Ni foil (2.49 Å). The only explanation for the increase in Ni–Ni bond distance is that the Cu atoms effectively dilute continuous Ni sites.34 Notably, Ni–Cu/CeO2-NP exhibits the largest Ni–Ni bond distance of 2.54 Å, meaning that Ni sites in NiCu/CeO2-NP are better isolated by Cu than the other three catalysts.To further corroborate this structural analysis of active phases more conclusively and unambiguously, Cs-corrected HAADF-STEM was used to characterize the configuration of Ni–Cu/CeO2-NP and Ni–Cu/CeO2-NC given the obvious structural differences. Due to the much higher atomic number (Z) of Ce in comparison to Ni and Cu, the contrast of the latter in small size could not be effectively distinguished from the thickness effect of CeO2 in the HAADF-STEM mode (Fig. 3D–F). By closely magnifying the TEM images (Fig. 3F), lattice fringes throughout the determined Ni–Cu particle are observed, with a distance of 0.206 nm, which is between that of Ni and Cu. However, considering the accuracy of lattice fringe measurements in STEM images, this may not be convincing evidence to certify the formation of nanoalloys. Additionally, a continuous crystalline lattice with a lattice spacing of 0.295 nm was also found which is assigned to reducible Ce species (PDF 44-1086). To further obtain more convincing evidence, EDX elemental mapping was performed in several zones to ensure analyses were representative. The corresponding results (Fig. 3G and S6†) confirm that Cu and Ni elements are homogeneously distributed at the nanometer scale over the polyhedron CeO2 with Ni/Cu ratios of 48![[thin space (1/6-em)]](https://www.rsc.org/images/entities/char_2009.gif) :
:![[thin space (1/6-em)]](https://www.rsc.org/images/entities/char_2009.gif) 52. For the Ni–Cu/CeO2-NC, the distribution of Ni and Cu atoms exhibits several different trends with monometallic Cu and Ni-rich bimetallic nanoparticles (Fig. S6†), while polycrystalline and nanorod CeO2 induced a mixture of Cu-rich alloys with monometallic Ni nanoparticles.
52. For the Ni–Cu/CeO2-NC, the distribution of Ni and Cu atoms exhibits several different trends with monometallic Cu and Ni-rich bimetallic nanoparticles (Fig. S6†), while polycrystalline and nanorod CeO2 induced a mixture of Cu-rich alloys with monometallic Ni nanoparticles.
Insight into support facet-dependent alloying behaviour and interfacial effects
As expected, the properties of bimetallic components, in particular alloying behaviour were dependent on the support morphology; that is, Ni and Cu atom arrangements on the ceria with distinct crystal facets are noticeably different. This inspired us to focus on the exploration and understanding of the substrate morphology which induced alloying behaviour. According to the literature,35,36 the degree of segregation/mixing and atomic order in AmBn/S bimetallic catalysts depend mainly on the relative strengths between metal–metal and metal–support, which are therefore explored by XRD measurement primarily. The measured lattice parameters of NiCu precursors are listed in Table S3,† with the estimated relative errors (Fig. S7†). Small error of the measurement confirms that the differences are significant. After calcination of the precursors, the decrease in various degrees of lattice parameters is seen in the nanocube and nanorod supported metal systems, but without any change noted in the Ni–Cu/CeO2-NP-C500 and Ni–Cu/CeO2-CV-C500 relative to the pristine ceria. This phenomenon is driven by the similarity in the radius of the Ni2+ cation (r = 0.85 Å) and Cu2+ cation (0.92 Å), which is more likely to form NiCuOx as the alloy precursor in the process of calcination without any effect on the lattice parameters.35,36 However, due to the large number of oxygen vacancies in the CeO2-NR and CeO2-NC, Ni2+ and Cu2+ ions enter more easily the lattice of CeO2 in the process of calcination, leading to the formation of a NiCuCeOx solid solution in the bulk including (–Ni2+–O2−–Ce4+–) or (–Cu2+–O2−–Ce4+–) linkages, which are responsible for the decrease in the lattice parameters of ceria. Noticeably, combined with the well-known stronger interactions between Ni and CeO2 compared to Cu2+ linked Ce4+,5 it is speculated that the (–Ni2+–O2−–Ce4+–) linkage is more likely preferentially produced in our situation. Here, Ni K-edge EXAFS of the polyhedron and cube ceria which exhibit marked parametric variation is displayed to confirm the formation of the Ni–O–Ce structure. From the R space plot for Ni–Cu/CeO2-NC-C500 (Fig. 4A and B), the first Ni–O shell possesses a distance of 2.15 Å, larger than that of Ni–Cu/CeO2-NP-C500 (2.11 Å) and 2.08 Å observed for NiO (Table S3†), indicating Ni interaction with Ce in addition to Cu.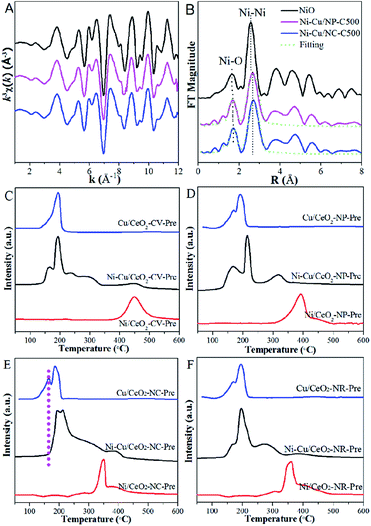 | ||
| Fig. 4 (A) k3-weighted Ni K-edge EXAFS oscillations, (B) Fourier transform spectra and (C–F) TPR of precursors. | ||
To provide evidence to support this proposal, TPR analysis of the precursors was performed. For the H2-TPR profiles (Fig. 4C) of monometallic catalysts, Cu/CeO2-CV-Pre exhibits a single reduction peak at 191 °C, while two peaks are observed for Cu/CeO2-NP-Pre, Cu/CeO2-NC-Pre and Cu/CeO2-NR-Pre at 127 and 192 °C. The former is attributed to the reduction of CuO interacting with CeO2, whereas the latter is ascribed to the reduction of CuO.5 However, no obvious peak due to the reduction of surface CeO2 appears (at 480 °C for CeO2). For the monometallic Ni system, a similar observation is obtained in CV, which shows only one reduction peak observed at 450 °C, associated with NiO reduction. TPR profiles over the precursors of different shaped CeO2 supported Ni in Fig. 4D–F display two peaks at ca. 350 and 420 °C. The one at 350 °C originating from NiO strongly interacts with CeO2, and the peak at 420 °C is due to the surface oxygen reduction of CeO2. Compared with pure CeO2, the shift in the temperature of reduction over different shaped CeO2, particularly nanocube and nanorod (Fig. 4E and F), offers convincing evidence for significant interactions between CeO2 and Ni. More importantly, the interaction of the support with Ni is stronger than that with Cu as judged by comparison of the shift in temperatures in the monometallic systems. With regard to bimetallic samples, the reduction peaks corresponding to Cu and Ni in polyhedron catalysts both move to lower temperatures (relative to the monometallic catalysts), which may be interpreted as the combination of Ni and Cu interactions as well as those between the metal and support. In terms of the other three substrate supported Cu–Ni species, the dominant signatures are assigned to the reduction of CuO (at ca. 190 °C) and NiO directly interacting with CeO2 (at 210–290 °C). However, the reduction of CuO interacting with the support (at ca. 130 °C) in Ni–Cu/CeO2-NR-Pre and Ni–Cu/CeO2-CV-Pre is weak, and even absent in Ni–Cu/CeO2-NC-Pre, clearly indicating stronger Ni–CeO2 interactions than those of Cu, especially in Ni–Cu/CeO2-NC-Pre. To better understand the reduction process, the corresponding quantitative information of TPR was provided. Calculation of H2 uptake indicates the consumption of 1547–1862 μmol H2/g over four samples, higher than 1497 μmol H2/g expected for the reduction of NiO and CuO to the corresponding metal state. The difference of H2 consumption can be accounted for by the reduction occurring not only on the metals but also on the support. Additionally, the TPR profiles are divided into several regions to confirm the reliability of the assignment for reduction peaks (Fig. S8 and Table S4†). The moles of consumed H2 derived from zones 1 and 2 closely match with that for complete reduction of CuO and NiO, respectively, indicating that the assignment of the reduction peaks is reasonable. Moreover, relative to the CeO2-CV, CeO2-NC and CeO2-NR systems, the CeO2-NP supported NiCu system exhibits the highest H2 consumption for the reduction of CeO2 (zone 3), indicating that CeO2 is easier to reduce with the aid of the NiCu alloy in the polyhedron.
Fig. 5, S9 and S10† show Cu 2p, Ni 2p and Ce 3d XP spectra of mono- and bimetallic catalysts. Since these catalysts were measured ex situ, contact with air in the process of transfer could cause the oxidation of metal. First, by analysing the Ni and Cu XPS spectra of monometallic catalysts (Fig. S9A†), it is noted that the change of the Ni0 2p3/2 peak over monometallic Ni samples on CeO2-NR (0.4 eV), CeO2-CV (0.3 eV), and particularly CeO2-NC (0.5 eV) is more pronounced relative to that of Cu0 in the corresponding monometallic Cu catalysts (ca. 0.2 eV), indicative of a stronger electronic interaction at the Ni–CeO2 interface. Interestingly, the extent of the shift in the BE of the Ni 2p peaks is very similar to that observed for the Cu 2p signals in the case of the CeO2-NP supported monometallic catalysts, revealing the close interplay of the substrate to Ni and Cu. Furthermore, with the introduction of Ni into the Cu samples, more metallic copper is obtained (Fig. S10†), suggesting that interaction between Ni and Cu species exists. However, no obvious change in the BE of copper within the bimetallic materials is detected, although the effect of Ce3+ and Ni on the nature of the Cu species is evident from the XPS data in Fig. S9 and S10.† This apparent contradiction can be rationalized on the basis of the electronic shifts arising from the electronegativity of all three components. In Ni XP spectra, Ni–Cu/CeO2-NP with the lowest BE reflects the maximum electron density over Ni species under the combined effect of Cu and Ce3+ species (Fig. 5A). The combined study of XAS, TPR and XPS suggests homogeneous alloying over Cu–Ni/CeO2-NP, while Cu atoms are readily separated and exposed at the surface of the other catalysts. Note that the spectra of Ce 3d (Fig. 5B) are fairly complex since a mixture of both Ce4+ and Ce3+ oxidation states exists, which is expected due to the formation of Ce3+ species with oxygen vacancies on the surfaces of the reduced catalysts, affirming the preliminary conclusion from STEM analysis. The six peaks denoted as v (882.8 eV), v′′ (889.0 eV), v′′′ (898.4 eV), u (901.2 eV), u′′ (907.6 eV) and u′′′ (917.0 eV) belong to CeO2, while another four peaks labelled as v0 (880.8 eV), v′ (885.6 eV), u0 (898.9 eV) and u′ (904.0 eV) are characteristic of Ce2O3.33,37 For Ni–Cu/CeO2-NP, the abundance of Ce3+ (39.6%) is higher than that of the other three materials, indicating that the reduction of ceria is promoted by the presence of the metal, and the existence of a strong interaction between the active metal and ceria.
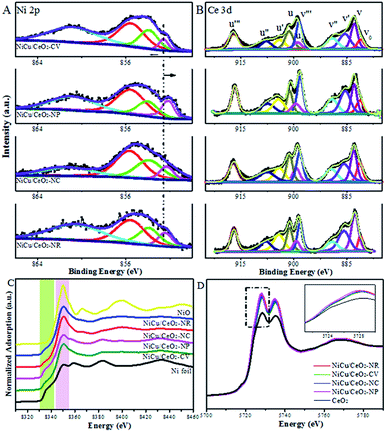 | ||
| Fig. 5 XPS spectra of (A) Ni 2p and (B) Ce 3d. (C) Ni K-edge and (D) Ce L3-edge XANES spectra of all catalysts. | ||
The normalized Ce L3-edge XANES profiles for Ni–Cu/CeO2 materials in Fig. 5D present a double absorption feature at 5730 and 5737 eV. In comparison with the reference CeO2, shifts are observed in the absorption edges towards lower energies for Ni–Cu samples but these are still close to the edge position of the standard CeO2, implying the transformation from Ce4+ to Ce3+ but with Ce4+ species dominating in all samples.
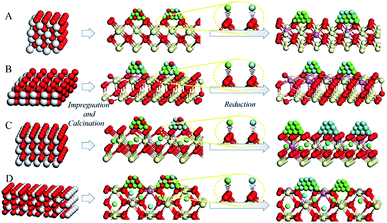
The percentage of Ce3+ in Ni–Cu/CeO2 in all four cases is significantly different, of which the polyhedron supported NiCu nanoalloy possesses the highest at 35%, based on the linear combination fit (LCF) using the Athena software.38 Combined with the Raman and positron annihilation spectroscopy (PAS) analysis of reduced catalysts in Fig. S11B, Tables S5 and S6,† these results reveal the assistance of the NiCu alloy (hydrogen dissociation) for the generation of oxygen vacancies, which contributes to the strong interfacial effect. As shown in the normalized Ni K-edge XANES spectra (Fig. 5C), Ni–Cu/CeO2-NC and Ni–Cu/CeO2-NR present a stronger white line, whereas that in the polyhedron supported Ni–Cu is close to the Ni foil; however, a significant pre-edge feature similar to the Ni foil is clearly present in the spectra of these four catalysts. The above results suggest the existence of a NiO phase in these catalysts but the metallic state Ni is still predominant. This kind of Ni–O interaction may be caused by re-oxidation or Ni atoms strongly interacting with the support. Notably, a shift in the absorption edge toward lower photon energies compared to the Ni foil is observed, revealing that the Ni electronic density increases. This could be associated with the electron transfer from Ce3+ to metal atoms at the interface given no prominent change is noticed in Cu spectra (Fig. S12†). The spectroscopic results give a deeper understanding of the strong interfacial effect between the interfacial metal atoms and Ce3+–Ov sites. According to the above analysis, a possible mechanism of substrate morphology inducing the structure of the active metal is given in Scheme 1. To obtain universal information on the CeO2 morphology-dependence, other metal alloys such as CeO2-NP supported Ni–Co, Cu–Co, Ni–Ga and Cu–Ga catalysts were prepared. XRD results (Fig. S13†) preliminarily confirm that Ni–Ga/CeO2-NP possesses an alloy structure, indicating that the control of the CeO2 shape might be extended to prepare other metal systems. Further research will be performed in the future work.
Catalytic behaviour
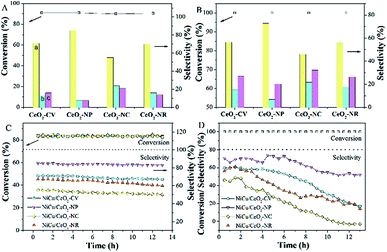
The hydrogenation of alkyne follows a consecutive reaction pathway with many parallel reactions that can drive the formation of undesired products,39 and thus achieving a high selectivity at full conversion is still a challenge. The Ni–Cu/CeO2 catalysts with the different morphologies were tested in the gas phase hydrogenation of acetylene using 4 equivalents of H2 relative to acetylene. The lack of conversion of acetylene over pristine CeO2 (Fig. S14B†) rules out any contribution of supports to the catalytic behavior under our testing conditions. Surprisingly, complete consumption of acetylene (Fig. S14A†) is observed for Ni–Cu/CeO2-NP at 100 °C, while the conversion of the other three catalysts is only <70%, showing that these nanopolyhedron supported Ni–Cu materials are highly active. Turnover frequency (TOF) is a vital metric to assess the intrinsic activity. In this study, TOF is defined as the rate of converted acetylene per number of active sites which are assumed as exposed Ni atoms at low conversion (<15%) since Cu atoms are inactive at low temperature. Mass or heat transfer effects are ruled out by analysis of Weisz–Prater and Mears criteria (Table S7†). As for the intrinsic activity (Table S2†), a TOF of 0.0070 s−1 is achieved over Ni–Cu/CeO2-NP, higher than the values for the other three catalysts, demonstrating that the structure of Ni–Cu/CeO2-NP can effectively enhance catalytic activity. In terms of selectivity, the four catalysts exhibit similar product distribution with ethene being always the predominant product (Fig. 6A). When the conversion is 90%, the ethene selectivity improves dramatically from 55% (Ni–Cu/CeO2-NC) to 70% (Ni–Cu/CeO2-CV and Ni–Cu/CeO2-NR) and then to the maximum 85% (Ni–Cu/CeO2-NP). As is well known for the hydrogenation of acetylene, the selectivity at >99.5% conversion is a greater challenge and more relevant to the industrial process. Therefore, we further evaluate the selectivity at 100% conversion. The maximum selectivity to ethene (73.0%) is still achieved over Ni–Cu/CeO2-NP, and is superior to those of the reported Ni-based materials and only slightly lower than those of state of the art materials such as ceria (81% sel. at 86% conv. −250 °C),40 indium oxide (≈90% sel. at 30% conv. −350 °C),41 and Pd4S catalysts (94% sel. at 100% conv.-250 °C)42 obtained at higher space velocity and hydrogen/acetylene ratios (Table S8†).Interestingly, when Ni–Cu/CeO2-NP-C500 was treated at 320 °C based on TPR (even though Ni–Cu/CeO2-NP is also reduced at 250 °C but without good alloy structure in Fig. S15 and S16†), Ni–Cu/CeO2-NP-R320 possesses a similar structure to Ni–Cu/CeO2-NP-R500 as confirmed by XRD, but exhibits poor selectivity. Linking this performance and structure of Ni–Cu/CeO2-NP-R500, a reasonable conclusion can be reached that the sites of the NiCu nanoalloy adjacent to CeOx at the interface are beneficial to the formation of ethylene. Furthermore, time-on-stream analysis was performed after 13 h (Fig. 6). The selectivity of all the catalysts keeps stable at low conversion. However at high conversion, the selectivity of these four catalysts changes. Ni–Cu/CeO2-NP retains 52.1% selectivity, while apparent decreases in selectivity are found for Ni–Cu/CeO2-CV (from 60.5% to 17.4%), Ni–Cu/CeO2-NC (from 46.2% to 13.9%) and Ni–Cu/CeO2-NR (from 56.7% to −2.6%), revealing better stability of Ni–Cu/CeO2-NP.
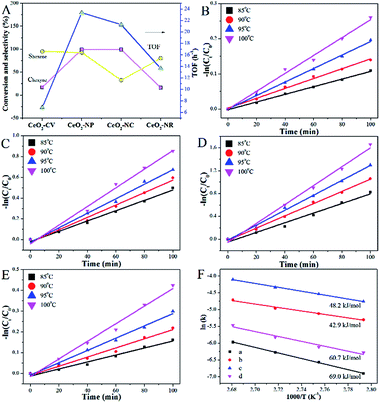
To extend the application of this series of catalysts, the catalytic properties were tested in liquid phase hexyne hydrogenation (Fig. 7). For Ni–Cu/CeO2-CV and Ni–Cu/CeO2-NR, the reactant is not fully converted after 7 h reaction, whereas the polyhedron and cube supported Ni–Cu bimetallic catalysts exhibit almost full conversion. The TOF of Ni–Cu/CeO2-NP is 23.35 h−1, two-fold higher than those of the other materials, indicating remarkable catalytic activity. A much smaller Ea value of 42.9 kJ mol−1 for Ni–Cu/CeO2-NP based on the Arrhenius equation (Fig. 7F) demonstrates the key role of the different structures in determining the activity. It is worth noting that Ni–Cu/CeO2-NC facilitates over-hydrogenation at the full conversion, leading to lower selectivity (32.6%). However, as expected, hexene is the dominant product over the CeO2-NP supported NiCu alloy even at high conversion. The above results basically reflect that Ni–Cu/CeO2-NP positively contributes to both activity and selectivity, regardless of the phase in which the reactant is present.
Insight into the activity, selectivity and stability of NiCu/CeO2-NP
As the vital rate-determining step for semi-hydrogenation of alkynes,43 the adsorption and activation of hydrogen should be considered. By analyzing the results of H2 chemisorption (Fig. S17 and Table S9†), the maximum adsorption capacity over Ni–Cu/CeO2-NP is estimated to be 33 cm3 g−1, more than 1.5-fold higher in comparison to the others, illustrating the superior adsorption ability. Interestingly, relative to the close metal dispersions in the different samples, the large differences in hydrogen chemisorption may suggest the existence of hydrogen spillover. To further confirm the speculation, we calculated the ratio of H/metal (Ni and Cu, both of which are considered to be reasonable adsorbed sites for H2 under these test conditions) according to the H2 adsorption capacity. The results in Table S9† show that the ratios of H atoms to total metal atoms of all the samples exceed 1, but the degree of this suggests the different ability of hydrogen spillover over the four catalysts. Specifically, the H/metal ratio of NiCu/CeO2-NP is 2.6, much higher than those of NiCu/CeO2-CV (1.1), NiCu/CeO2-NC (1.9) and NiCu/CeO2-NR (1.3), indicating that this sample exhibits the most significant hydrogen spillover effect. Additionally, since CeO2 could be regarded as an active support due to the spillover effect, the total active surface areas were also determined based on the hydrogen chemisorption, and the calculated equation is as:where VH is the H2 adsorption capacity, Vm is the molar volume of gas, NA is Avogadro's constant, and SH is the surface area occupied by one hydrogen atom (0.065 nm2). As expected, the results in Table S9† indicate that NiCu/CeO2-NP also exhibits the highest active surface area due to the obvious hydrogen spillover. In terms of TPD profiles (Fig. S18†), the peak at above 100 °C ascribed to the chemisorbed hydrogen desorption in Ni–Cu/CeO2-NP remarkably moves to lower temperature relative to that of Ni–Cu/CeO2-NC, Ni–Cu/CeO2-NR and Ni–Cu/CeO2-CV, indirectly reflecting that more easier H2 activation/dissociation occurs on the NiCu nanoalloy. By combination of chemisorption with TPD, the improvement of activity is clearly understood.
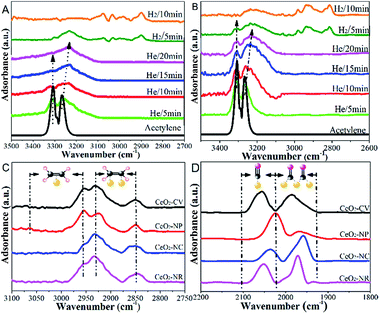
Fig. 8 presents IR spectra during hydrogenation of acetylene over NiCu catalysts. The range of 3500–2700 cm−1 is chosen to focus on the C–H modes given the absence of ν(C![[double bond, length as m-dash]](https://www.rsc.org/images/entities/char_e001.gif) C) vibrational features due to the surface selection rule.44 Besides, considering the clear distinction between Ni–Cu/CeO2-NP and Ni–Cu/CeO2-NC (the structure, electronic perturbation or catalytic behaviour), these two materials were selected as targets. As a comparison, the same experiment was executed on the pristine ceria, in which no obvious peak originating from chemically adsorbed species can be observed (Fig. S19†). Therefore, the peak at ca. 3236 cm−1 in the spectra of NiCu catalysts should be ascribed to the weak adsorption of acetylene in the π- or di-σ-complex.45
C) vibrational features due to the surface selection rule.44 Besides, considering the clear distinction between Ni–Cu/CeO2-NP and Ni–Cu/CeO2-NC (the structure, electronic perturbation or catalytic behaviour), these two materials were selected as targets. As a comparison, the same experiment was executed on the pristine ceria, in which no obvious peak originating from chemically adsorbed species can be observed (Fig. S19†). Therefore, the peak at ca. 3236 cm−1 in the spectra of NiCu catalysts should be ascribed to the weak adsorption of acetylene in the π- or di-σ-complex.45
However, the unambiguous identification of the relative coverages of π- and di-σ-bonded acetylene could not be executed due to the wide peak caused by overlap. When hydrogen is introduced, the peaks in the range of 3100–2900 cm−1 assigned to CH2 symmetric stretching become visible, demonstrating that selective hydrogenation of acetylene mainly produces ethene over Ni–Cu/CeO2-NP.46 However, in the case of Ni–Cu/CeO2-NC (Fig. 8B), the peaks arising at 2962 cm−1, 2812 cm−1, 2835 cm−1 and 2881 cm−1 correspond to CH3 and CH2 asymmetric stretching, illustrating deep hydrogenation to ethane. This is correlated exactly with π-bonded acetylene as weaker adsorption, which is generally beneficial to inhibit over-hydrogenation compared with the di-σ-bonded acetylene. Accordingly, to achieve the proportion of the π- and di-σ-bonded mode, C2H4-IR is performed due to the overlap in the spectra of acetylene. The IR spectra of ethene on the target materials exhibit four peaks assigned to v (C–H) and vs (C–H) of π-bonded and di-σ-bonded ethene, respectively (Fig. 8C). The higher ratio of π- to di-σ-bonded ethene in the catalyst with the nanopolyhedron indicates that C2H4 prefers to adsorb on the active atoms in the π configuration with a low adsorption energy. Moreover, the reducible CeOx adjacent to metal sites at the interface results in the relative increase of electron density of Ni as affirmed by EXAFS, XPS (Fig. 5) and in situ CO-IR experiments (Fig. 8D). The electron-rich Ni promotes ethene desorption from the catalyst surface. This is confirmed by the heat of C2H4 adsorption over Ni–Cu/CeO2-NP (62 kJ mol−1), lower than that of Ni–Cu/CeO2-CV (73 kJ mol−1), Ni–Cu/CeO2-NR (79 kJ mol−1) and Ni–Cu/CeO2-NC (90 kJ mol−1) in Fig. S20,† and hence enhances the selectivity of the desired product. Additionally, the presence of CeOx adjacent to the metal sites strongly anchors the metal nanoparticles, and thus hinders the aggregation of alloy nanoparticles, which remain with unchanged sizes in the range of 2–3 nm (Fig. S21†).
More importantly, no noticeable change is observed in bulk structures and surface composition of the polyhedron supported NiCu alloy catalyst, as confirmed by STEM, XRD and XPS analysis; that is, the nanoalloy structure is very stable (Fig. 9). This is due to the fact that the interface of metal–ceria is formed in the process of reduction which acts equally on the Ni and Cu in the alloy, and is responsible for the preferable stability.
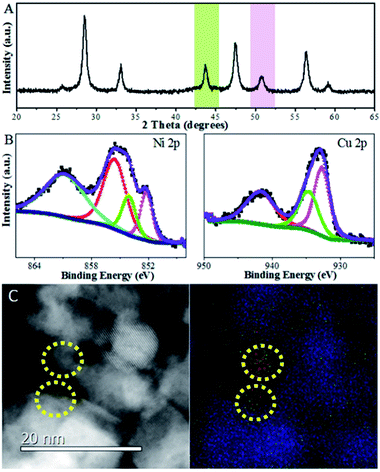 | ||
| Fig. 9 (A) XRD profiles, (B) XPS spectra, and (C) STEM images of spent Ni–Cu/CeO2-NP after 13 h of usage (red: Ni; green: Cu). | ||
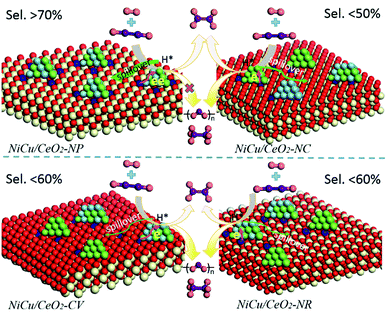
Based on the above results, a possible mechanism considering the alloying and interfacial effect of Ni–Cu/CeO2 catalysts for the selective hydrogenation of alkynes is proposed (Scheme 2). Relative to CeO2-NC and CeO2-NR, nanopolyhedron (NP) ceria leads to the generation of homogeneous Ni–Cu nanoalloys, owing to the equivalent interactions of Ni and Cu species with CeO2 (111) facets. Although the (111) facet is also observed in CeO2-CV, the relative proportion is lower than that of CeO2-NP, and thus the corresponding catalyst exhibits a low alloying degree. In the process of reaction, the NiCu/CeO2-NP catalyst with homogenous NiCu alloy structure exhibits a significant hydrogen spillover effect, which leads to the increase of active surface area, and thus contributes to enhanced activity. More importantly, the presence of CeOx adjacent to metal sites at the interface in the NiCu/CeO2-NP not only favors the generation of electron-rich Ni atoms which facilitate the desorption of ethene, but also results in excellent stability of the alloy structure. However, this kind of CeOx adjacent to the NiCu alloy structure is difficult to observe in CeO2-CV, CeO2-NC and CeO2-NR systems.
Conclusions
In summary, we first explore and put forward the support morphology/facet-dependent alloying behaviour as well as interfacial effects. In detail, a series of CeO2 materials with nanopolyhedron (NP), nanorod (NR), nanocube (NC) and conventional polycrystalline (CV) shapes were fabricated and used as supports to achieve environmentally benign non-noble Ni–Cu catalysts by conventional impregnation. As confirmed by the XRD and Cs-corrected STEM, the ceria with a polyhedron structure mainly involving (111) facets contributed to the formation of a homogenous and stable NiCu alloy which exists in intimate contact with CeOx at the interface, whereas Ni–Cu/CeO2-NR and Ni–Cu/CeO2-CV, particularly Ni–Cu/CeO2-NC induced a low extent of alloying with partial monometallic Ni and Cu being present. The nature of substrate morphology inducing the structure of active metal was attributed to the comparative interaction of Ni and Cu species with CeO2 (111) facets which expose relatively few low coordination sites, as confirmed by XRD, PAS, XAS, methanol-IR and XPS. Moreover, excellent catalytic behaviour for selective hydrogenation of acetylene and hexyne was obtained over the homogeneous NiCu alloy on the nanopolyhedron ceria. The improved activity was attributed to the promotion of hydrogen activation/dissociation. A consequence of favorable adsorption mode for acetylene and weak adsorption of the resulting ethene product originating from the isolated electron-rich Ni atoms in the NiCu alloy contributed to the excellent selectivity. More importantly, the preferable stability is due to the suitable interfacial effect; that is, the reconstructed interfaces with the presence of CeOx species adjacent to the metal sites in the interface act equally on the Ni and Cu in the alloy, anchoring the alloy nanoparticles, and meanwhile inhibiting the separation of Cu from Ni atoms.Experimental section
Materials
All chemical reagents, including Ni(NO3)2·6H2O, Ce(NO3)3·6H2O, Na(OH)2 and Cu(NO3)2·3H2O were bought from Aladdin. Deionized water was employed in the experiment.Synthesis of supports and the corresponding catalysts
The fabrication of CeO2 with different morphologies was similar to a previous paper.15 For CeO2-NP, CeO2-NC and CeO2-NR, 0.3300 g, 16.8000 g and 0.3300 g NaOH was dropped into 40 mL Ce(NO3)3 solution (1.9621 g) with stirring at 25 °C for 30 min, followed by aging at 180 °C, 180 °C and 100 °C for 24 h in a 100 mL stainless steel autoclave, respectively. The white precipitate was washed and dried at 60 °C overnight. And then a calcination process using a muffle was carried out at 500 °C for 4 h to obtain the final products. The conventional polycrystalline CeO2 was only derived by calcination of Ce(NO3)3·6H2O under the above conditions in the oven. All the NiCu catalysts with a Ni and Cu loading of 5.00 wt% were synthesized by impregnation. In detail, 0.60 g of support was suspended in 10 mL aqueous solution containing Ni(NO3)2·6H2O and Cu(NO3)2·3H2O solution with a mole ratio of 1![[thin space (1/6-em)]](https://www.rsc.org/images/entities/char_2009.gif) :
:![[thin space (1/6-em)]](https://www.rsc.org/images/entities/char_2009.gif) 1 for 4 h with stirring, followed by drying at 60 °C for 12 h and calcination at 500 °C for 4 h, and were denoted as Ni–Cu/CeO2-NP-Pre, Ni–Cu/CeO2-NR-Pre, Ni–Cu/CeO2-NC-Pre and Ni–Cu/CeO2-CV-Pre. All calcined precursors were reduced in H2/Ar at 500 °C for 4 h and cooled down slowly to room temperature. Notably, when the temperature decreases to 100 °C, the samples are treated using a mixture of diluted oxygen with nitrogen (3% O2/N2) in case re-oxidation results in the change of structure. The catalysts were named as Ni–Cu/CeO2-NP, Ni–Cu/CeO2-NR, Ni–Cu/CeO2-NC and Ni–Cu/CeO2-CV, respectively.
1 for 4 h with stirring, followed by drying at 60 °C for 12 h and calcination at 500 °C for 4 h, and were denoted as Ni–Cu/CeO2-NP-Pre, Ni–Cu/CeO2-NR-Pre, Ni–Cu/CeO2-NC-Pre and Ni–Cu/CeO2-CV-Pre. All calcined precursors were reduced in H2/Ar at 500 °C for 4 h and cooled down slowly to room temperature. Notably, when the temperature decreases to 100 °C, the samples are treated using a mixture of diluted oxygen with nitrogen (3% O2/N2) in case re-oxidation results in the change of structure. The catalysts were named as Ni–Cu/CeO2-NP, Ni–Cu/CeO2-NR, Ni–Cu/CeO2-NC and Ni–Cu/CeO2-CV, respectively.
Characterization of samples
X-ray diffraction (XRD) patterns were recorded using a Shimadzu XRD-6000 diffractometer using copper radiation (Kα1 = 0.154 nm) with a rate of 0.5° min−1. To investigate the concentration/type of oxygen vacancies, PAS using a fast–slow coincidence ORTEC system (a time resolution of 187 ps for the full width at half maximum) and Raman measurements using a 532 nm laser were conducted. X-ray photoelectron spectra (XPS) were collected using a Thermo VG ESCALAB 250 spectrometer equipped with an Al Kα anode, and the calibration peak is the C 1s peak at 284.6 eV. Metal dispersion was estimated by CO chemisorption based on a Ni/CO ratio of 1 using a Micromeritics ChemiSorb 2720. A temperature-programmed process (TPx) was also carried out on this instrument. 0.1 g of sample was degassed in Ar at 200 °C for 1 h and reduced under H2/Ar at 30–500 °C. Cs-corrected STEM images were obtained on a JEOL ARM200F microscope equipped with a probe-forming spherical-aberration corrector. The extended X-ray Absorption Fine Structure (EXAFS) was analysed at the 1W1B beamline of Beijing Synchrotron Radiation Facility (BSRF). The typical energy of the storage ring was 2.5 GeV with a maximum current of 250 mA. In situ diffuse reflectance infrared Fourier transform (DRIFT) spectroscopy of C2H2 and C2H4 was performed on a Bruker Tensor 27 instrument. The samples were pre-treated in H2/Ar at 500 °C for 30 min, followed by recording a background with a resolution of 4 cm−1. Then, the catalysts were exposed to C2H2 or C2H4 for 30 min, and purged with He before the collection of spectra. CH3OH-IR was performed on a Bruker Tensor 27 instrument. The samples were pre-treated in He at 300 °C for 30 min, followed by recording a background with a resolution of 4 cm−1. Then, CeO2 was exposed to CH3OH vapor through He bubbling for 30 min, and purged with He before collection of spectra.Catalytic testing
The gas-phase reaction was performed in a quartz-bed reactor using 100 mg of catalyst diluted with SiC. The catalysts were reduced in 10% H2/N2 at 300 °C for 2 h prior to catalytic testing, and then determined in a mixture of 0.6% C2H2/5.4% C2H4/balance N2. Gas compositions were analysed using a gas chromatograph (PE Clarus 580) connected to a flame ionization detector (GC-FID) using an elite alumina capillary column. Conversion was denoted as the amount of reacted acetylene divided by the amount introduced. Selectivity to the product was calculated as the amount formed divided by the amount of acetylene reacted. Oligomers were evaluated based on carbon balance. Liquid-phase hydrogenation of hexyne was performed in a 25 mL reactor of a semi-batch stainless steel reactor with a quartz tank inside. Each reactor was charged with samples (50 mg), 1-hexyne (0.005 mol) and toluene as solvent (10 mL). Reaction products were monitored off-line through a GC-FID with a DB-Wax column (df = 0.250 μm, 30 m × 0.320 mm). The carbon balance was within ±5%.Conflicts of interest
There are no conflicts to declare.Acknowledgements
This work was supported by the National Key Research and Development Program of China (2016YFB0301601), the National Natural Science Foundation and the Fundamental Research Funds for the Central Universities (BHYC1701B, JD1916).Notes and references
- R. Ferrando, J. Jellinek and R. L. Johnston, Chem. Rev., 2008, 108, 846–904 CrossRef PubMed.
- D. S. Wang and Y. D. Li, Adv. Mater., 2011, 23, 1044–1060 CrossRef CAS PubMed.
- W. G. Menezesa, L. Altmann, V. Zielasek, K. Thiel and M. Bäumer, J. Catal., 2013, 300, 125–135 CrossRef.
- D. L. Li, M. M. Lu, K. Aragaki, M. Koike, Y. Nakagawab and K. Tomishige, Appl. Catal., B, 2016, 192, 171–181 CrossRef CAS.
- B. Seemala, C. M. Cai, C. E. Wyman and P. Christopher, ACS Catal., 2017, 7, 4070–4082 CrossRef CAS.
- J. Jones, H. F. Xiong, A. T. DeLaRiva, E. J. Peterson, H. Pham, S. R. Challa, G. S. Qi, S. Oh, M. H. Wiebenga, X. I. P. Hernández, Y. Wang and A. K. Datye, Science, 2016, 353, 150–154 CrossRef CAS PubMed.
- G. Vilé, S. Colussi, F. Krumeich, A. Trovarelli and J. Pérez-Ramírez, Angew. Chem., 2014, 126, 12265–12268 CrossRef.
- F. Dvorak, M. Farnesi Camellone, A. Tovt, N. D. Tran, F. R. Negreiros, M. Vorokhta, T. Skala, I. Matolinova, J. Myslivecek, V. Matolin and S. Fabris, Nat. Commun., 2016, 7, 10801 CrossRef CAS PubMed.
- S. Mclntosh and R. J. Gorte, Chem. Rev., 2004, 104, 4845–4866 CrossRef.
- J. W. Yoon, J. S. Kim, T. H. Kim, Y. J. Hong, Y. C. Kang and J. H. Lee, Small, 2016, 12, 4229–4240 CrossRef CAS PubMed.
- A. Trovarelli and J. Llorca, ACS Catal., 2017, 7, 4716–4735 CrossRef CAS.
- J. A. Rodriguez, D. C. Grinter, Z. Liu, R. M. Palomino and S. D. Senanayake, Chem. Soc. Rev., 2017, 46, 1824–1841 RSC.
- N. J. Lawrence, J. R. Brewer, L. Wang, T. S. Wu, J. Wells-Kingsbury, M. M. Ihrig, G. H. Wang, Y. L. Soo, W. N. Mei and C. L. Cheung, Nano Lett., 2011, 11, 2666–2671 CrossRef CAS PubMed.
- J. Carrasco, G. Vilé, D. Fernández-Torre, R. Pérez, J. Pérez-Ramírez and M. V. Ganduglia-Pirovano, J. Phys. Chem. C, 2014, 118, 5352–5360 CrossRef CAS.
- R. Si and M. Flytzani-Stephanopoulos, Angew. Chem., Int. Ed., 2018, 47, 2884–2887 CrossRef PubMed.
- L. Soler, A. Casanovas, A. Urrich, I. Angurell and J. Llorca, Appl. Catal., B, 2016, 197, 47–55 CrossRef CAS.
- Y. Lin, Z. NWu, J. Wen, K. Ding, X. Yang, K. R. Poeppelmeier and L. D. Marks, Nano Lett., 2015, 15, 5375–5381 CrossRef CAS PubMed.
- N. Ta, J. J. Liu, S. Chenna, P. A. Crozier, Y. Li, A. Chen and W. Shen, J. Am. Chem. Soc., 2012, 134, 20585–20588 CrossRef CAS PubMed.
- J. C. Gonzalez, J. C. Hernandez, M. Lopez-Haro, E. del Rio, J. J. Delgado, A. B. Hungria, S. Trasobares, S. Bernal, P. A. Midgley and J. J. Calvino, Angew. Chem., Int. Ed., 2009, 48, 5313–5315 CrossRef CAS PubMed.
- M. Tinoco, S. Fernandez-Garcia, M. Lopez-Haro, A. B. Hungria, X. Chen, G. Blanco, J. A. Perez-Omil, S. E. Collins, H. Okuno and J. J. Calvino, ACS Catal., 2015, 5, 3504–3513 CrossRef CAS.
- F. Esch, S. Fabris, L. Zhou, T. Montini, C. Africh, P. Fornasiero, G. Comelli and R. Rosei, Science, 2005, 309, 752–755 CrossRef CAS PubMed.
- S. Chang, M. Li, Q. Hua, L. Zhang, Y. Ma, B. Ye and W. Huang, J. Catal., 2012, 293, 195–204 CrossRef CAS.
- M. Zabilskiy, P. Djinovic, E. Tchernychova, O. P. Tkachenko, L. M. Kustov and A. Pintar, ACS Catal., 2015, 5, 5357–5365 CrossRef CAS.
- J. Liu, ACS Catal., 2017, 7, 34–59 CrossRef CAS.
- H. B. Liao, A. Fisher and Z. C. J. Xu, Small, 2015, 11, 3221–3246 CrossRef CAS PubMed.
- Y. Z. Xiang, R. Barbosa and N. Kruse, ACS Catal., 2014, 4, 2792–2800 CrossRef CAS.
- S. Y. Lee, N. Jung, J. Cho, H. Y. Park, J. Ryu, I. Jang, H. J. Kim, E. Cho, Y. H. Park, H. C. Ham, J. H. Jang and S. J. Yoo, ACS Catal., 2014, 4, 2402–2408 CrossRef CAS.
- C. Herring, Phys. Rev., 1951, 82, 87–93 CrossRef CAS.
- C. W. Yang, X. J. Yu, S. Heißler, A. Nefedov, S. Colussi, J. Llorca, A. Trovarelli, Y. M. Wang and C. Wöll, Angew. Chem., Int. Ed., 2017, 56, 375–379 CrossRef CAS PubMed.
- A. Badri, C. Binet and J. C. Lavalley, J. Chem. Soc., Faraday Trans., 1997, 93, 1159–1168 RSC.
- Z. L. Wu, M. J. Li, D. R. Mullins and S. H. Overbury, ACS Catal., 2012, 2, 2224–2234 CrossRef CAS.
- L. D. Rogatis, T. Montini, B. Lorenzut and P. Fornasiero, Energy Environ. Sci., 2008, 1, 501–509 Search PubMed.
- Z. L. Yuan, L. Wang, J. H. Wang, S. X. Xia, P. Chen, Z. Y. Hou and X. M. Zheng, Appl. Catal., B, 2011, 101, 431–440 CrossRef CAS.
- E. T. Saw, U. Oemar, X. R. Tan, Y. Du, A. Borgna, K. Hidajat and S. Kawi, J. Catal., 2014, 314, 32–46 CrossRef CAS.
- Z. Hu, X. F. Liu, D. M. Meng, Y. Guo, Y. L. Guo and G. Z. Lu, ACS Catal., 2016, 6, 2265–2279 CrossRef CAS.
- A. Hornésa, M. Fernández-García, A. Guerrero-Ruizb and A. Martínez-Arias, Appl. Catal., B, 2012, 111–112, 96–105 CrossRef.
- C. Yang, X. Yu, S. Heissler, A. Nefedov, S. Colussi, J. Llorca, A. Trovarelli, Y. Wang and C. Woll, Angew. Chem., Int. Ed., 2017, 56, 375–379 CrossRef CAS PubMed.
- F. Wang, S. He, H. Chen, B. Wang, L. R. Zheng, M. Wei, D. G. Evans and X. Duan, J. Am. Chem. Soc., 2016, 138, 6298–6305 CrossRef CAS PubMed.
- A. J. McCue, C. J. McRitchie, A. M. Shepherd and J. A. Anderson, J. Catal., 2014, 319, 127–135 CrossRef CAS.
- G. Vilé, B. Bridier, J. Wichert and J. Pérez-Ramírez, Angew. Chem., Int. Ed., 2012, 51, 8620–8623 CrossRef PubMed.
- D. Albani, M. Capdevilla-Cortada, G. Vilé, S. Mitchell, O. Martin, N. López and J. Pérez-Ramírez, Angew. Chem., 2017, 56, 10755–10760 CrossRef CAS PubMed.
- A. J. McCue, A. Guerrero-Ruiz, C. Ramirez-Barria, I. Rodríguez-Ramos and J. A. Anderson, J. Catal., 2017, 355, 40–52 CrossRef CAS.
- Y. N. Liu, J. Zhao, J. T. Feng, Y. F. He, Y. Y. Du and D. Q. Li, J. Catal., 2018, 359, 251–260 CrossRef CAS.
- Y. D. Chen, C. M. Li, J. Y. Zhou, S. T. Zhang, S. He, M. Wei, D. G. Evans and X. Duan, ACS Catal., 2015, 5, 5756–5765 CrossRef CAS.
- M. A. Albiter and F. Zaera, Langmuir, 2010, 26, 16204–16210 CrossRef CAS PubMed.
- J. Wood, M. J. Alldrick, J. M. Winterbottom, E. H. Stitt and S. Bailey, Catal. Today, 2007, 128, 52–62 CrossRef CAS.
Footnote |
| † Electronic supplementary information (ESI) available: Fig. S1–S21, Tables S1–S9. See DOI: 10.1039/c8sc05423a |
| This journal is © The Royal Society of Chemistry 2019 |

