 Open Access Article
Fluorescence lifetime imaging of upper gastrointestinal pH in vivo with a lanthanide based near-infrared τ probe†
Yingying
Ning
a,
Shengming
Cheng
b,
Jing-Xiang
Wang
a,
Yi-Wei
Liu
a,
Wei
Feng
 b,
Fuyou
Li
 *b and
Jun-Long
Zhang
 *a
*a
aBeijing National Laboratory for Molecular Sciences, State Key Laboratory of Rare Earth Materials Chemistry and Applications, College of Chemistry and Molecular Engineering, Peking University, Beijing 100871, P. R. China. E-mail: zhangjunlong@pku.edu.cn
bDepartment of Chemistry, State Key Laboratory of Molecular Engineering of Polymers, Institutes of Biomedical Sciences, Fudan University, Shanghai 200433, P. R. China
First published on 27th February 2019
Abstract
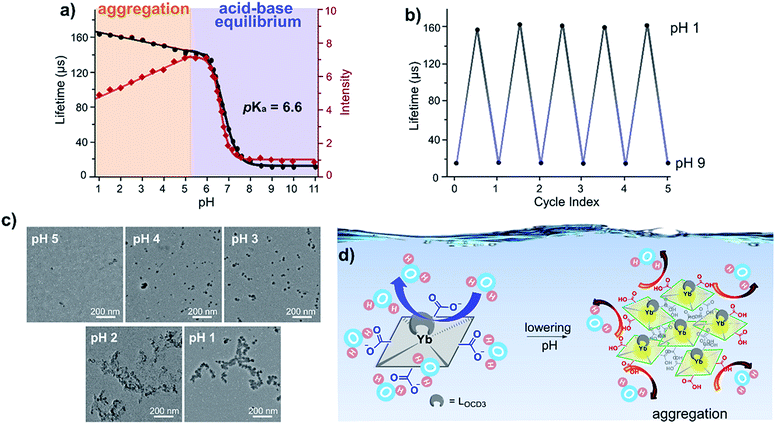
Time-resolved fluorescence lifetime imaging (FLIM) in the near-infrared region of 900–1700 nm not only allows a deep tissue penetration depth but also offers the unique benefit of the quantitative visualization of molecular events in vivo and is independent of local luminescence intensity and fluorophore concentration. Herein, we report the design of a wide-range pH sensitive molecular probe based on Yb3+ porphyrinate. The Yb3+ probe shows increasing NIR emission and lifetime with pKa values of ca. 6.6 from pH 9.0 and 5.0 and also displays an elongated lifetime from ca. 135 to 170 μs at lower pH values (5.0–1.0) due to aggregation and reduced exposure to water at low pH values. Importantly, the probe is able to monitor a wide range of in vivo gastrointestinal pH values in mice models and the potential applications in imaging-guided gastrointestinal diagnostics and therapeutics were revealed. This study shows that lifetime contrast is important for preclinical imaging; lanthanide complexes could be successfully used in the design of stimuli-responsive NIR τ probes for advanced in vivo imaging.
Introduction
Determining gastric juice acidity in vivo is the primary step for the accurate diagnosis and treatment of upper gastrointestinal diseases,1–3 and helps the development of pH-triggered stomach medicines.4,5 Traditionally, the standard clinical method to assess stomach pH values relies on invasive endoscopic tests, however these are uncomfortable for patients and are not suitable for long-term monitoring.6 Given such limitations, several approaches have been explored to measure stomach pH in vivo, for instance ingestible electronic capsules such as “Heidelberg” and “Bravo” have been developed,7 but the sizes8 and functions9 still need to be technically modified. Fluorescence imaging is no doubt a promising non-invasive method for upper gastrointestinal pH detection. Since 1965, organic dyes including “Congo red” have been introduced,10,11 but endoscopy or ex vivo experiments are still required to assist the optical measurements due to the limited tissue penetration depth. Thus, the development of a non-invasive method that is more convenient, safer and faster for accurately assessing in vivo upper gastrointestinal pH is of importance.Fluorescence imaging in the near-infrared (NIR) region of 900–1700 nm, as an advanced non-invasive technique with an enhanced penetration depth, has attracted increasing attention due to its reduced tissue absorption, autofluorescence and photon scattering.12,13 However, quantitative monitoring of physicochemical environments such as temperature, pH and viscosity in this region still remains a challenge in vivo, as fluorescence intensity is dependent on concentration gradient, the heterogeneity of tissues, excitation power etc. In contrast to intensity, lifetime τ is an intrinsic characteristic of fluorophores and is largely independent on concentration and thus fluorescence lifetime imaging microscopy (FLIM) has recently emerged as an intrinsically quantitative technique for detecting lifetime as marker.14,15 Therefore, exploring a lifetime-based NIR probe, in terms of an NIR τ probe, being able to report local physicochemical parameters allows the establishment of FLIM as a quantitative non-invasive approach in the NIR region.
Thanks to the recent advances in NIR imaging, there are an increasing number of NIR fluorophores available.12,13 However, designing NIR τ probes (900–1700 nm) with pH-induced distinct lifetime changes is a synthetic challenge. Moreover, in vivo pH variation in the upper gastrointestinal tract is wide-ranging, for example stomach pH (1–3) and intestine pH (6–7), and most pH probes possess sensitive luminescence with a narrow pKa ± 1 range (ΔpH = 2). Furthermore, environmental responsive lifetime contrast is important for designing τ probes. NIR organic fluorophores are not preferable as τ probes due to their low lifetime contrast compared with autofluorescence background. Despite the fact that quantum dots16,17 and lanthanide-doped nanoparticles18,19 can achieve long lifetimes, they still suffer from decomposition and unknown toxicity concerns under strong acidic environments like stomach.20 To address these issues, we herein introduce a new strategy for constructing NIR τ probes based on lanthanide (Ln) coordination complexes by combining the features of organic molecules (small sizes and low cytotoxicity) and metal ions (metal characteristic luminescence and long decay lifetimes up to microseconds).21–23
The microsecond scaled lifetime of lanthanides allows for effective discrimination from the noise of autofluorescence (nanosecond scale) and thus achieves a high signal to noise ratio.24–26 Due to the forbidden f–f transition, the emission of lanthanide complexes, especially europium(III) and terbium(III), has been extensively used for τ probes in bioanalysis and cell imaging.27,28 In contrast to visible emissive Ln, NIR Ln has not been widely considered for τ probes,29–32 although they have been employed as luminescent biosensors for two decades.33–35 One possible reason is their low quantum yields,29–32 making it difficult to collect enough photons to obtain FLIM images with good quality. Recently, we reported highly luminescent ytterbium (Yb3+) porphyrinates with long lifetimes up to ca. 700 μs,36 which were applicable in living cell imaging dependent on either emission intensity or lifetime.37 This enables the Yb3+ complexes as a promising molecular platform for constructing NIR τ probes (900–1100 nm), but further precise modification of the porphyrin structure is required to design stimuli-responsive Yb3+τ probes for in vivo pH detection.
To demonstrate the perspective in a preclinical study, in this work, we designed a pH-sensitive Yb3+ porphyrinate (F-Yb) as an NIR τ probe by introducing a carboxylate group to the meso-position of porphyrin. F-Yb showed increasing NIR emission as well as lifetime within a physiologically relevant pH range from 9.0 and 5.0, with a pKa of ca. 6.6. Serendipitously, this NIR τ probe tends to aggregate when the pH is lower than 5.0. A decrease in solubility arising from aggregation reduces the exposure of the Yb3+ complex to water and elongates the lifetime (from ca. 135 to 170 μs), which renders F-Yb a low pH (5.0 to 1.0) NIR τ probe. Using oral gavage experiments in nude mice, F-Yb was able to detect real-time pH changes during the normal metabolic process, fasting experiments, and treatment with hydrotalcite drugs, with significant lifetime contrast and quantitative pH measurements in vivo. These results clearly demonstrate the effectiveness of lanthanide NIR τ probes for quantitatively visualizing local physicochemical parameters in vivo, with the potential for preclinical diagnostic and therapeutic studies.
Results and discussion
Synthesis and characterization
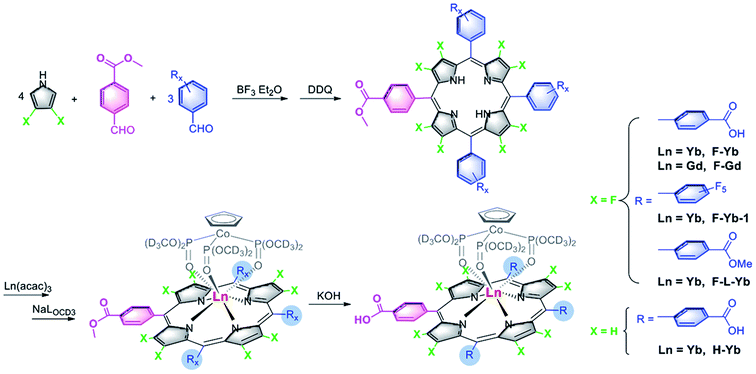
A judicious choice of meso-aryl group is critical for designing wide-range pH-sensitive Yb3+τ probes, as β-fluorination is a prerequisite for high NIR luminescence as well as a long lifetime and thus β-periphery should be kept intact.36 In this work, we introduced a 4-carboxyphenyl group to the meso-position to synthesize 2,3,7,8,12,13,17,18-octafluoro-5,10,15,20-tetra(4-carboxyphenyl)porphyrin-ytterbium(III)-LOCD3 (F-Yb, LOCD3 = (cyclopentadienyl)tris(di(methyl-d3)phosphito)cobaltate). F-Yb was obtained in an overall yield of 58% starting from 4-methyl formylbenzoate and 3,4-difluoropyrrole (Scheme 1). As controls, F-Yb-1, which contains only one 4-carboxyphenyl group, and the β-periphery hydrogenated complex H-Yb were synthesized. To investigate the possibility of energy transfer from the ligand to Yb3+, we prepared the corresponding Gd3+ complex F-Gd to estimate the energy level of the lowest triplet state of the ligand by phosphorescence, because the excited state of Gd3+ is high-lying compared to the lowest triplet state of porphyrinates.38 Their structures were characterized by 1H, 19F-NMR, UV-vis and IR spectroscopy and high resolution ESI mass spectrometry. Detailed synthetic procedures and characterizations are presented in the Experimental section and the ESI.†In vitro pH sensitivity (from pH 9.0–1.0)
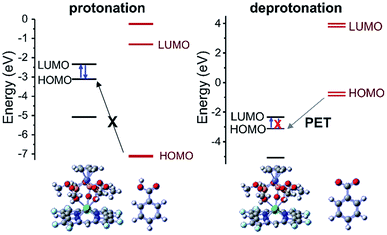
To verify this, we chose F-Gd as the example and measured the phosphorescence of F-Gd to estimate the lowest triplet excited state upon the protonation/deprotonation of 4-carboxylate. When the carboxylates were protonated, F-Gd exhibited intense vibrationally structured emission bands at 700–900 nm (Fig. S2†). When deprotonated, no phosphorescence was observed. Moreover, the nanosecond transient absorption (Fig. S3†) showed that deprotonated F-Gd exhibits a much shorter lifetime (0.2 μs) and a smaller ΔOD compared to protonated F-Gd (1.6 μs), suggesting that the deprotonation of 4-carboxylate strongly quenches the triplet state of porphyrinate. In addition, TD-DFT calculations further support that deprotonation leads to photoinduced electron transfer (PET); while the protonation of carboxylate suppresses the PET process, this allows energy transfer from the lowest triplet state to the excited state of Yb3+ and switches on NIR luminescence, as shown in Fig. 2.
Transmission electron microscopy (Fig. 3c) and dynamic light scattering (Fig. S6†) studies revealed that F-Yb aggregates in aqueous media and the mean diameters increase gradually from pH 5.0 (<5 nm) to 1.0 (ca. 200–300 nm). We tentatively correlated the decreasing fluorescence intensity to the “decreasing solubility” arising from the aggregation, as revealed by TEM and DLS studies. However, the lifetime is less affected by lumiphore concentration and the aggregation is likely to reduce the exposure of the Yb3+ complex to water (Fig. 3d), which has high energy O–H vibration and heavily quenches the NIR emission. Thus, we proposed that aggregation can enhance the rigidity of the complex and reduce the solvation effect on the NIR lifetimes.
Therefore, F-Yb displays a prolonged lifetime with decreasing pH from 9.0 to 1.0, showing that it is a wide-range pH τ probe. In addition, F-Yb displays almost a constant lifetime in aqueous solution with different viscosities (0–200 cP) and temperatures (0–50 °C), even in the presence of essential metal ions or oxidative-stress associated chemicals (glutathione, cysteine and H2O2) (Fig. S7†). It is worth noting that the aggregation elongated lifetime observed in this work is an interesting phenomenon for NIR Ln complexes, although intermolecular interaction is well-known to modulate the photophysical properties of fluorophores known as aggregation induced emission (AIE) and aggregation-caused quenching (ACQ).40 This might form a chemical basis to further design stimuli-responsive lanthanide τ probes.
Intracellular pH sensitivity
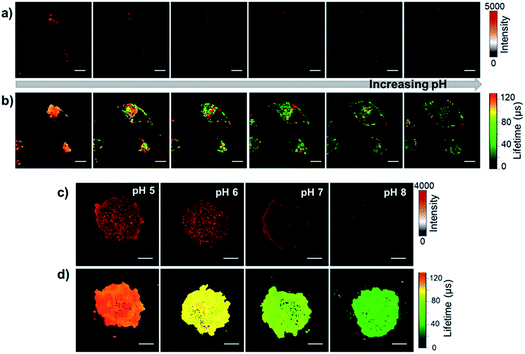
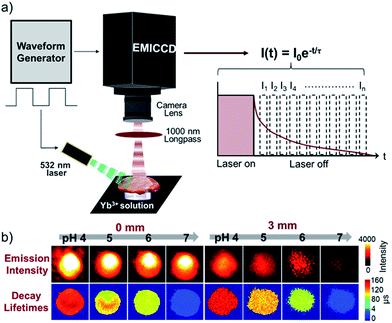
To study the pH-sensitivity of F-Yb in living cells, we performed NIR confocal imaging to monitor endogenous pH changes using chloroquine as an apoptosis inducer. Chloroquine is a well-known lysosomotropic agent that increases lysosomal pH by accumulating as a deprotonated weak base.41 The intracellular NIR luminescence was initially found to localize in lysosomes (Fig. S8†). Upon the addition of 0.5 μM chloroquine, the NIR luminescence intensity decreased (ca. 60%), as shown in Fig. 4a. After 10 min, from the lysosomal luminescence intensity change, it is difficult to distinguish pH variation intracellularly. Interestingly, the parallel experiment using FLIM showed that the average lifetime of Yb3+ decreased from ca. 130 to 20 μs over a period of 30 min (Fig. 4b), indicating that the lysosomal pH increased from ca. 5.5 to 7.5 during the apoptosis process, similar to the previously reported results.41 For the exogenous pH changes, we used the antibiotic nigericin as an H+/K+ ionophore to induce H+ efflux.42 By increasing the pH from 5.0 to 8.0 (Fig. S9†), F-Yb showed a shortened average lifetime from ca. 120 to 30 μs as well as decreased intracellular NIR luminescence (ca. 50%). We further examined the pH-sensitivity of F-Yb in HeLa spheroids with diameters of 100–200 μm using a nigericin inducer. As shown in Fig. 4c and d, the increasing pH from 5.0 to 8.0 lowers the NIR luminescence lifetime from ca. 120 to 35 μs. These results indicate that F-Yb provides not only higher sensitivity in terms of lifetime other than intensity but also quantitative readouts of both the endogenous and exogenous pH changes, suggesting its unique advantages as an NIR τ probe.Prior to in vivo bio-imaging, we estimated the penetration depths with different modes: luminescence intensity and τ signals, by covering pork with a known thickness (0 and 3 mm) on the PBS buffer of F-Yb with various pH values. As shown in Fig. 5a, the EMICCD is triggered with a delay on the falling edge of the excitation laser, which ensures the exclusion of any extraneous excitation light. The fluorescence lifetime was then determined by a time-domain method and calculated from the slope of a plot of log![[thin space (1/6-em)]](https://www.rsc.org/images/entities/char_2009.gif) I(t) versus t (I(t) = I0
I(t) versus t (I(t) = I0![[thin space (1/6-em)]](https://www.rsc.org/images/entities/char_2009.gif) e−t/τ).43 As expected, with an increase in penetration depth from 0 to 3 mm, the emission intensity significantly decreased upon excitation at 532 nm and varied in different pixels (Fig. 5b), indicating that it is not favorable to quantitatively measure pH values in vivo. In contrast, the lifetime of F-Yb remained constant at certain pH values, and was much less dependent on the penetration depth. By increasing the pH from 4.0 to 7.0, the lifetime decreased from ca. 150 to 30 μs. These results demonstrated the reliability and accuracy of F-Yb as an NIR pH τ probe. Although the excitation wavelength lies at the visible region, we herein demonstrated the effectiveness of pH detection under a penetration depth of ca. 3 mm using FLIM, and extending the excitation to deep red or the NIR region can be achieved by further modification of porphyrin structures.29,44
e−t/τ).43 As expected, with an increase in penetration depth from 0 to 3 mm, the emission intensity significantly decreased upon excitation at 532 nm and varied in different pixels (Fig. 5b), indicating that it is not favorable to quantitatively measure pH values in vivo. In contrast, the lifetime of F-Yb remained constant at certain pH values, and was much less dependent on the penetration depth. By increasing the pH from 4.0 to 7.0, the lifetime decreased from ca. 150 to 30 μs. These results demonstrated the reliability and accuracy of F-Yb as an NIR pH τ probe. Although the excitation wavelength lies at the visible region, we herein demonstrated the effectiveness of pH detection under a penetration depth of ca. 3 mm using FLIM, and extending the excitation to deep red or the NIR region can be achieved by further modification of porphyrin structures.29,44
In vivo pH τ probe
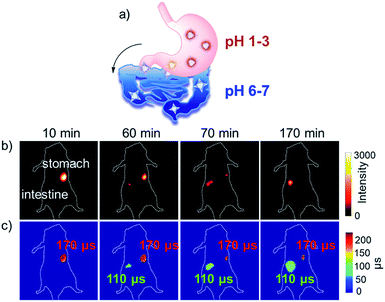
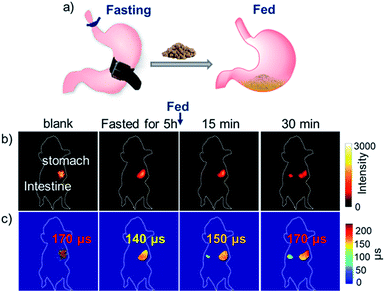
Then, we applied the NIR τ probe F-Yb to in vivo pH detection. As the acidity (pH 1–3) of gastric fluid is usually lower than that of intestinal fluid (pH 6–7), the oral gavage experiments in nude mice were optional for monitoring the changes of both the fluorescence intensity and the lifetime of F-Ybin vivo from the stomach to the intestine (Fig. 6a). Mice were gavaged with 100 μL of 7 mg mL−1F-Yb and anesthetized after the gavage. As shown in Fig. 6b, the NIR luminescence originally appeared in the stomach in the initial 10 minutes. With the emptying of F-Yb into the intestine, the fluorescence intensity in the stomach region gradually weakened, accompanied with an increase in fluorescence in the intestine. Until 170 min, the luminescence signal almost disappeared in the stomach and only existed in the intestine. By switching to FLIM mode, the F-Ybτ probe showed distinct lifetimes between the stomach (ca. 170 μs) and the intestine (ca. 110 μs), as shown in Fig. 6c. According to the pH curve shown in Fig. 3a, the pH values in the stomach and intestine were estimated as ca. 1.5 and ca. 6.0, respectively, which were consistent with the reported gastrointestinal pH values in mice.45 Thus, using the NIR τ probe F-Yb, FLIM clearly provides the quantitative readouts to distinguish different organs according to the lifetimes under in vivo pH values.To apply F-Yb as a non-invasive τ probe to monitor the dynamic pH variation in the metabolic process, we performed a fasting experiment which was a gastric related diagnostic and the stomach pH was used as a key parameter (Fig. 7a).45 Previously, as it was difficult to monitor stomach pH in the absence/presence of food, the fasting process was always performed by ex vivo experiments, where the mice were killed and the pH values were measured by a pH meter.45 In this work, after fasting for 5 h, the mice were given a gavage of 100 μL F-Yb water solution (7 mg mL−1) and the fitted average luminescence lifetime was calculated to be ca. 130 μs, indicating that the pH value increased to ca. 5.5 due to the inhibition of gastric acid secretion. Then, the mice were fed and the lifetime increased to ca. 170 μs, suggesting that the pH value was gradually recovered to ca. 1.5. However, as shown in Fig. 7b and c, fluorescence intensity imaging cannot distinguish the in vivo pH changes during the fasting experiments. Thus, compared to the ex vivo method, NIR FLIM mode using the NIR τ probe is suitable for non-invasive, real-time and quantitative measurements, enabling the visualization of the dynamic process that is related to in vivo pH changes.
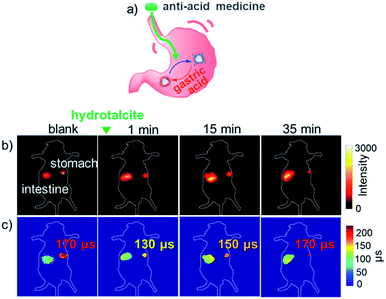
The pH values in the gastrointestinal tract are crucial for clinical theranostics, as they affect the stability, solubility and potency of drugs.46,47 To extend the application of the Yb3+τ probe for in vivo NIR imaging-guided gastrointestinal therapeutics, we carried out a proof-of-concept study by giving the fed mouse 100 μL aqueous suspension containing hydrotalcite (2.6 mg) by gavage. Hydrotalcite chewable tablets have an obvious anti-acid effect48 and the mouse dose was calculated based on the human dose and the specific surface area of both (Fig. 8a). 10 minutes after the gavage of the anti-acid medicine, the mice were fed with 100 μL F-Yb solution (7 mg mL−1). As shown in Fig. 8b, the NIR luminescence intensity in the stomach decreased, accompanied with an increase in florescence in the intestine after 35 min. As expected, it is difficult to monitor the pH variation in the stomach after the treatment of hydrotalcite chewable tablets from the luminescence intensity alone. Using FLIM (Fig. 8c), the fluorescence lifetime of F-Yb in the stomach became much shorter after hydrotalcite treatment (ca. 120 μs) compared to that of the control group (ca. 170 μs), indicating the increased pH value. After 25 min, F-Yb gradually recovered to a lifetime of ca. 170 μs due to the hydrotalcite consumption and gastric acid secretion. Accordingly, we estimated the reversible stomach pH changes as ca. “1.5 (blank) → 6.5 (1 min) → 1.5 (35 min)” during the hydrotalcite treatment, referring to the pH calibration curve in vitro (Fig. 3a). Thus, the results demonstrate the ability of the F-Ybτ probe to monitor, real-time and reversibly, the pH changes, thus potentially aiding gastrointestinal treatment and the related drug design. As described above, a shortcoming of F-Yb is the visible excitation wavelength (500–600 nm), which limits the penetration length. In this work, we demonstrated in vivo pH detection under a penetration depth of ca. 3 mm using FLIM.
Conclusions
Taken together, we report the design and synthesis of a wide-range NIR pH-responsive Yb τ probe for in vivo non-invasive diagnostics and therapeutics. Due to the long lifetime (μs scale) of lanthanide, the Yb3+ probe is able to quantitatively, dynamically and in situ monitor real-time pH changes in cells and in vivo, with deep penetration, good reversibility and high spatiotemporal resolution. The successful application of F-Yb in imaging-guided gastric related diagnostics and therapeutics demonstrates the superiority of NIR emissive Ln for in vivo molecular event visualization. This study paves the way for the design of lanthanide τ probes as “smart” materials in the NIR region.Experimental section
Synthesis and characterization of the lanthanide complexes
For all synthesis and characterization details, please see the ESI.†Photophysical properties
For the optical measurements, H2O was obtained from a Milli-Q integral. UV-vis spectra were recorded on an Agilent 8453 UV-vis spectrometer equipped with an Agilent 89090A thermostat (±0.1 °C) at 25 °C. The emission, excitation spectra and lifetime were measured on an Edinburgh Analytical Instruments FLS980 lifetime and steady state spectrometer equipped with a 450 W Xe lamp, a 60 W microsecond flash lamp, a PMT R928 for the visible emission spectrum, and a HAMAMATSU R5509-73 PMT with a C9940-02 cooler for the NIR emission spectrum and luminescence lifetime measurements (850 nm longpass). Excitation and emission spectra were corrected for instrumental functions (including correction for the detector, gratings etc.). All luminescence decays were tail-fitted bi-exponentially with two components of ca. 170 and 15 μs as they gave small residuals and without deconvolution for the negligible instrumental reference function in the NIR region. The different pH solutions of F-Yb were prepared by diluting 2 mM concentrated F-Yb solution in Milli-Q water with Britton–Robinson buffer with different pH values. The final concentration was controlled at 10−6 M. The stabilities were determined by spiking F-Yb into KCl/HCl buffer (pH 1.5), and exposing it in a 1 mm-path-length cuvette with or without continuous 405 nm excitation (0.2 W cm−2). The stability was determined by comparing the fluorescence intensity or lifetimes against the starting fluorescence intensity or lifetime values.Transmission electron microscopy
3 μL 10−6 M of the well-dispersed F-Yb suspension in different pH values of Britton–Robinson buffer were dried on a copper grid. Then the copper grid was soaked in water for 12 h to dissolve the salt from the buffer and was then dried for 4 h before the test.Cell cultures
HeLa cells were obtained from the Peking University Health Science Center. All of the HeLa cells were incubated in complete medium (Dulbecco’s modified Eagle’s Medium, supplemented with 10% fetal bovine serum (FBS) and 1% penicillin–streptomycin) at 37 °C in an atmosphere containing 5% CO2. The dark cytotoxicity and photocytotoxicity of F-Yb towards the HeLa cells were measured by the standard Cell Counting Kit-8 (CCK-8) method and the complex showed low cytotoxicity (Fig. S10†). 3-D tumor spheroids were formed by seeding 5 × 10³ to 1 × 10⁴ HeLa cells per well in a volume of 200 μL per well of culture medium in 96-well plates coated with 1% agarose in complete DMEM medium. Tumor spheroids were allowed to grow for 2–3 days after the initial seeding and the growth was monitored by microscopy.NIR confocal images
An ISS Alba5 FLIM/FFS confocal system (ISS Inc.) was used to acquire the confocal images. The system was attached a Nikon TE2000 inverted microscope, equipped with a Nikon 60X/1.2 NA water immersion objective lens. Both steady-state and time-resolved (lifetime) confocal images were acquired by the ISS VistaVision software and an ISS FastFLIM data acquisition unit. A 408 nm diode laser or YSL supercontinuum laser source (for excitation at the Q band) was used for the excitation of Yb3+ dye; the laser was operated in CW mode for steady-state imaging and was modulated on/off by a FastFLIM for lifetime imaging; the average power on the specimen plane was about 4 μW cm−2. For lifetime imaging, the on/off repetition rate and the duty cycle were 1 kHz and 1%, respectively. A stock solution of the Yb3+ complex in H2O was prepared at 2 mM. The solution was diluted to a final concentration of 10 μM by the complete growth medium. After incubation for 4 h, the cells were washed with PBS buffer twice before the confocal experiments. For the intracellular pH experiments induced by chloroquine, a stock solution of chloroquine was prepared at 1 mM, and the stock solution was added in situ to the PBS buffer to achieve a final concentration of 0.5 μM. For those induced by nigericin, the cells were incubated with a high K+ buffer (30 mM NaCl, 120 mM KCl, 1 mM CaCl2, 0.5 mM MgSO4, 1 mM NaH2PO4, 5 mM glucose, 20 mM HEPES, and 20 mM NaOAc) at various pH values (5–8) in the presence of 10 μM of nigericin. Then the cells were incubated for 30 min at 37 °C before the fluorescence imaging measurements. The Yb3+ confocal images were acquired in Channel 1, using a Semrock 935/170 nm bandpass filter (EM1) and a single photon avalanche photodiode detector (SPAD) by Excelitas (model SPCM-AQRH-15, quantum efficiency >25% at 950 nm). For the co-localization studies, a 470 nm diode laser operated in CW mode was used for the excitation of LysoTracker Green. Stock solutions of LysoTracker Green DND-26 were prepared at 1 mM, and the stock solution was diluted to the working concentrations in the complete medium (Lyso Tracker: 75 nM). After incubation of the 10 μM Yb3+ complex for 4 h followed by 30 min incubation with the 75 nM solution of Lysotracker Green, the cells were washed with PBS buffer twice before the confocal experiments. The LysoTracker Green confocal images were collected in Channel 2, using a Semrock 530/43 nm bandpass filter (EM2) and a GaAsP photomultiplier tube detector by Hamamatsu (Model H7422p-40). A 405/470/561/685 nm multi-edge dichroic beamsplitter (D2) by Chroma was used to separate the two excitation wavelengths (samples and lysosome tracker) from the corresponding emission wavelengths. A 650 nm longpass dichroic beamsplitter (D3) by Chroma was used to separate the emission light between Channel 1 and Channel 2. A variable pinhole (VP) was used for each imaging channel and was set to 1 Airy Unit for the confocal imaging. All of the fluorescence images were processed and analyzed using ImageJ.In vivo NIR imaging
Four-week-old node female mice were obtained from the Second Military Medical University (Shanghai, China) and were housed under standard environmental conditions. All animal procedures were performed in accordance with the Guidelines for Care and Use of Laboratory Animals of Fudan University and were approved by the Animal Ethics Committee of School of Pharmacy, Fudan University. Mice were randomly selected from cages for all of the experiments. NIR imaging was performed with a home-made imaging system. A waveform generator was used to modulate the frequency, duty cycle and initial phase of a 532 nm pulse laser. An emICCD (Princeton Instruments) and a 1000 nm longpass filter were used to collect NIR luminescence signals. To ensure the survival and health of the mice, the gavage dose of water solution (7 mg mL−1F-Yb) or aqueous suspension (containing hydrotalcite) was 100 μL per mouse and the dose of anti-acid medicine was 2.6 mg per mouse, which was calculated based on the size and weight of the mouse. After gavage, the mice were anesthetized with chloral hydrate. The power density on the surface of the nude mouse was 100 mW cm−2. The images of the luminescence signals were analyzed with Matlab.Conflicts of interest
There are no conflicts to declare.Acknowledgements
We acknowledge financial support from the National Key Basic Research Support Foundation of China (2015CB856301) and the National Scientific Foundation of China (Grants No. 21778002, 21571007, 21621061 and 21527801). We also thank Prof. Dayong Jin from the University of Technology Sydney (Australia) for the help in the setup of the imaging system.Notes and references
- J. D. Gray and M. Shiner, Gut, 1967, 8, 574–581 CrossRef CAS PubMed.
- P. R. Hastings, J. J. Skillman, L. S. Bushnell and W. Silen, N. Engl. J. Med, 1978, 298, 1041–1045 CrossRef CAS PubMed.
- I. M. Modlin, K. D. Lye and M. Kidd, Cancer, 2003, 97, 934–959 CrossRef PubMed.
- H. Du, M. Liu, X. Yang and G. Zhai, Drug Discovery Today, 2015, 20, 1004–1011 CrossRef CAS PubMed.
- R. Wang, L. Zhou, W. Wang, X. Li and F. Zhang, Nat. Commun., 2017, 8, 14702 CrossRef PubMed.
- P. E. Marik and A. Lorenzana, Crit. Care Med., 1996, 24, 1498–1500 CrossRef CAS PubMed.
- K. Arshak, E. Jafer, G. Lyons, D. Morris and O. Korostynska, Microelectron. Int., 2004, 21, 8–19 CrossRef.
- S. Zhang, A. M. Bellinger, D. L. Glettig, R. Barman, Y. A. Lee, J. Zhu, C. Cleveland, V. A. Montgomery, L. Gu, L. D. Nash, D. J. Maitland, R. Langer and G. Traverso, Nat. Mater., 2015, 14, 1065–1071 CrossRef CAS PubMed.
- C. Caparello, I. Bravi, P. Cantu, A. Grigolon, A. Tenca, A. Mauro and R. Penagini, Neurogastroenterol. Motil., 2012, 24, 951 CrossRef CAS PubMed.
- S. Okuda, T. Saegusa and T. Itoh, An Endoscopic Method to Investigate Gastric Acid Secretion, Hitachi Printing, Tokyo, 1966 Search PubMed.
- H. J. Park, C. S. Lim, E. S. Kim, J. H. Han, T. H. Lee, H. J. Chun and B. R. Cho, Angew. Chem., Int. Ed., 2012, 51, 2673–2676 CrossRef CAS PubMed.
- G. Hong, A. L. Antaris and H. Dai, Nat. Biomed. Eng., 2017, 1, 0010 CrossRef.
- S. He, J. Song, J. Qu and Z. Cheng, Chem. Soc. Rev., 2018, 47, 4258–4278 RSC.
- M. Y. Berezin and S. Achilefu, Chem. Rev., 2010, 110, 2641–2684 CrossRef CAS PubMed.
- K. Y. Zhang, Q. Yu, H. Wei, S. Liu, Q. Zhao and W. Huang, Chem. Rev., 2018, 118, 1770–1839 CrossRef CAS PubMed.
- M. Dahan, T. Laurence, F. Pinaud, D. S. Chemla, A. P. Alivisatos, M. Sauer and S. Weiss, Opt. Lett., 2001, 26, 825–827 CrossRef CAS PubMed.
- C. Chen, P. Zhang, G. Gao, D. Gao, Y. Yang, H. Liu, Y. Wang, P. Gong and L. Cai, Adv. Mater., 2014, 26, 6313–6317 CrossRef CAS PubMed.
- Y. I. Park, K. T. Lee, Y. D. Suh and T. Hyeon, Chem. Soc. Rev., 2015, 44, 1302–1317 RSC.
- Y. Fan, P. Wang, Y. Lu, R. Wang, L. Zhou, X. Zheng, X. Li, J. A. Piper and F. Zhang, Nat. Nanotechnol., 2018, 13, 941–946 CrossRef CAS PubMed.
- I. Martinić, S. V. Eliseeva and S. Petoud, J. Lumin., 2017, 189, 19–43 CrossRef.
- Y. Li, X. Li, Z. Xue, M. Jiang, S. Zeng and J. Hao, Biomaterials, 2018, 169, 35–44 CrossRef CAS PubMed.
- A. J. Amoroso and S. J. Pope, Chem. Soc. Rev., 2015, 44, 4723–4742 RSC.
- Y. Yang, P. Wang, L. Lu, Y. Fan, C. Sun, L. Fan, C. Xu, A. M. El-Toni, M. Alhoshan and F. Zhang, Anal. Chem., 2018, 90, 7946–7952 CrossRef CAS PubMed.
- H. E. Rajapakse, N. Gahlaut, S. Mohandessi, D. Yu, J. R. Turner and L. W. Miller, Proc. Natl. Acad. Sci. U. S. A., 2010, 107, 13582–13587 CrossRef CAS PubMed.
- M. Delbianco, V. Sadovnikova, E. Bourrier, G. Mathis, L. Lamarque, J. M. Zwier and D. Parker, Angew. Chem., Int. Ed., 2014, 53, 10718–10722 CrossRef CAS PubMed.
- U. Cho, D. P. Riordan, P. Ciepla, K. S. Kocherlakota, J. K. Chen and P. B. Harbury, Nat. Chem. Biol., 2018, 14, 15–21 CrossRef CAS PubMed.
- Y. Lu, J. Lu, J. Zhao, J. Cusido, F. M. Raymo, J. Yuan, S. Yang, R. C. Leif, Y. Huo, J. A. Piper, J. Paul Robinson, E. M. Goldys and D. Jin, Nat. Commun., 2014, 5, 3741 CrossRef CAS PubMed.
- A. T. Bui, A. Grichine, A. Duperray, P. Lidon, F. Riobe, C. Andraud and O. Maury, J. Am. Chem. Soc., 2017, 139, 7693–7696 CrossRef CAS PubMed.
- T. Zhang, X. Zhu, C. C. Cheng, W. M. Kwok, H. L. Tam, J. Hao, D. W. Kwong, W. K. Wong and K. L. Wong, J. Am. Chem. Soc., 2011, 133, 20120–20122 CrossRef CAS PubMed.
- A. D’Aleo, A. Bourdolle, S. Brustlein, T. Fauquier, A. Grichine, A. Duperray, P. L. Baldeck, C. Andraud, S. Brasselet and O. Maury, Angew. Chem., Int. Ed., 2012, 51, 6622–6625 CrossRef PubMed.
- A. Foucault-Collet, K. A. Gogick, K. A. White, S. Villette, A. Pallier, G. Collet, C. Kieda, T. Li, S. J. Geib, N. L. Rosi and S. Petoud, Proc. Natl. Acad. Sci. U. S. A., 2013, 110, 17199–17204 CrossRef CAS PubMed.
- I. Martinic, S. V. Eliseeva, T. N. Nguyen, V. L. Pecoraro and S. Petoud, J. Am. Chem. Soc., 2017, 139, 8388–8391 CrossRef CAS PubMed.
- S. Comby and J. C. G. Bünzli, Lanthanide near-infrared luminescence in molecular probes and devices, Elsevier, Amsterdam, 2007 Search PubMed.
- S. J. Bradberry, A. J. Savyasachi, M. Martinez-Calvo and T. Gunnlaugsson, Coord. Chem. Rev., 2014, 273–274, 226–241 CrossRef CAS.
- M. Sy, A. Nonat, N. Hildebrandt and L. J. Charbonniere, Chem. Commun., 2016, 52, 5080–5095 RSC.
- J. Y. Hu, Y. Ning, Y. S. Meng, J. Zhang, Z. Y. Wu, S. Gao and J. L. Zhang, Chem. Sci., 2017, 8, 2702–2709 RSC.
- Y. Ning, J. Tang, Y. W. Liu, J. Jing, Y. Sun and J. L. Zhang, Chem. Sci., 2018, 9, 3742–3753 RSC.
- T. Zhang, R. F. Lan, C. F. Chan, G. L. Law, W. K. Wong and K. L. Wong, Proc. Natl. Acad. Sci. U. S. A., 2014, 111, E5492–E5497 CrossRef CAS PubMed.
- L. K. Truman, S. Comby and T. Gunnlaugsson, Angew. Chem., Int. Ed., 2012, 51, 9624–9627 CrossRef CAS PubMed.
- J. Mei, N. L. Leung, R. T. Kwok, J. W. Lam and B. Z. Tang, Chem. Rev., 2015, 115, 11718–11940 CrossRef CAS PubMed.
- B. Poole and S. Ohkuma, J. Cell Biol., 1981, 90, 665–669 CrossRef CAS PubMed.
- J. R. Casey, S. Grinstein and J. Orlowski, Nat. Rev. Mol. Cell Biol., 2010, 11, 50–61 CrossRef CAS PubMed.
- J. R. Lakowicz, Principles of Fluorescence Spectroscopy, Springer, 2006 Search PubMed.
- R. Xiong, D. Mara, J. Liu, R. Van Deun and K. E. Borbas, J. Am. Chem. Soc., 2018, 140, 10975–10979 CrossRef CAS PubMed.
- E. L. McConnell, A. W. Basit and S. Murdan, J. Pharm. Pharmacol., 2008, 60, 63–70 CrossRef CAS PubMed.
- L. S. Schanker, P. A. Shore, B. B. Brodie and C. M. Hogben, J. Pharmacol. Exp. Ther., 1957, 120, 528–539 CAS.
- W. N. Charman, C. J. H. Porter, S. Mithani and J. B. Dressman, J. Pharm. Sci., 1997, 86, 269–282 CrossRef CAS PubMed.
- V. Rives, Layered double hydroxides: present and future, Nova Science Publishers, New York, 2001 Search PubMed.
Footnote |
| † Electronic supplementary information (ESI) available: Detailed synthesis and characterization data; 1H and 19F NMR spectra, IR spectra and MS spectra. See DOI: 10.1039/c9sc00220k |
| This journal is © The Royal Society of Chemistry 2019 |

