 Open Access Article
Revisiting a classical redox process on a gold electrode by operando ToF-SIMS: where does the gold go?†
Xin
Hua‡
 ,
Hai-Lun
Xia‡
 and
Yi-Tao
Long
 *
*
Key Laboratory for Advanced Materials & School of Chemistry and Molecular Engineering, East China University of Science and Technology, Shanghai 200237, P. R. China. E-mail: ytlong@ecust.edu.cn
First published on 8th May 2019
Abstract
Electrochemical redox conversion between ferricyanide and ferrocyanide on a gold electrode is one of the most classical reactions in electrochemistry. In textbooks, the gold electrode is seen as chemically inert, on which only the adsorption/desorption of [Fe(CN)6]3/4− and electron transfer take place. Here, the electrochemical process of [Fe(CN)6]3/4− on a gold electrode was revisited using a vacuum-compatible microfluidic electrochemical cell in combination with operando liquid ToF-SIMS. An intermediate, Au(CN)2−, was observed in the cyclic voltammetry of ferricyanide with an interesting periodic potential-dependent variation trend. It was demonstrated that the gold electrode participated in the redox reaction of [Fe(CN)6]3/4− by competing with it to form Au(CN)2−, since the formation constant was Fe(CN)63− > Au(CN)2− > Fe(CN)64−. The formation and evolution of Au(CN)2− depends on the ratio of Fe(III) and Fe(II) on the surface of the gold electrode, which was determined by the redox conversion between Fe(III) and Fe(II) as well as the electric field force-based attraction or repulsion between the gold electrode and [Fe(CN)6]3/4−. Both of these factors were potential-dependent, resulting in the periodic change of Au(CN)2− in the dynamic potential scan of [Fe(CN)6]3/4−. These results provided solid molecular evidence for the participation of the gold electrode in the [Fe(CN)6]3/4− redox system, which will deepen mechanistic understandings of related electrochemical applications.
Introduction
Tracking electron transfer processes at electrode–electrolyte interfaces is of great significance for a wide range of applications, from bioanalytical chemistry to material science. [Fe(CN)6]3/4−, one of the most classical redox couples, has long been used as a standard electroactive probe in the investigation of the electron transfer capabilities of various electrode materials. Owing to its facile modification, gold has become one of the most frequently used electrode materials. Lots of studies have employed a modified gold electrode and the [Fe(CN)6]3/4− redox system for quantitative measurement of electron transfer processes.1,2 Thus, the fundamental understanding of the interaction between gold electrodes and [Fe(CN)6]3/4− is crucial. Most previous studies focused on the measurement of adsorbed intermediate species and other byproducts, such as Prussian blue-type compounds.3,4 The gold electrode was generally seen as a chemically inert electrode in the redox reaction of [Fe(CN)6]3/4−, on which electron transfer, adsorption/desorption and redox reactions of electroactive species take place. However, it was observed that the surface of gold electrodes becomes rough and the repeatability of electrochemical impedance spectroscopy (EIS) tends to decrease after reacting with [Fe(CN)6]3/4− for a period of time.5,6 The possible mechanism was proposed to be the etching effect of CN− on the gold substrate.7,8 However, owing to the limited chemical specificity of electrochemical techniques, direct molecular evidence was lacking to show the detailed mechanism of the reaction between gold electrodes and CN− in the dynamic redox process of [Fe(CN)6]3/4−.To better understand the electrochemical processes, techniques for real-time monitoring of the electrode–electrolyte interface (EEI) are essential. The dynamic nature of EEI requires in situ analysis techniques with high time resolution and high surface sensitivity. The combination of electrochemical (EC) measurement with complementary techniques, including optical spectroscopy,9 X-ray techniques,10 nuclear magnetic resonance (NMR),11 scanning probe microscopy,12 electron microscopy13 and mass spectroscopy (MS),14 has greatly advanced our understanding of how a molecular structure relates to its electrochemical behavior. The coupling of EC measurement with MS, including differential electrochemical mass spectrometry (DEMS),15,16 electrospray ionization mass spectrometry (ESI-MS)17 and desorption electrospray ionization mass spectrometry (DESI-MS), has enabled mass-resolved monitoring of chemical species in EC reactions.18,19 However, these techniques focus on the measurement of bulk solution rather than specifically EEI. Recent research realized the combination of EC measurement with operando liquid time-of-flight secondary ion mass spectrometry (ToF-SIMS) detection, providing molecular information on the EEI under dynamic conditions.20 In addition, owing to the short sampling distance and fast mass transfer rate of operando liquid ToF-SIMS, the detection of unstable intermediate species at the EEI is possible.21 Thus, the interactions between electrodes and electrolytes could be potentially investigated using this method.
In this work, we used a micro-EC cell to couple with operando liquid ToF-SIMS for the study of the [Fe(CN)6]3/4− redox system on a gold electrode. Chemical species on the electrode surface, especially gold-related species, were investigated as a function of potential. A new pathway for the interaction between [Fe(CN)6]3/4− and the gold electrode was proposed, for an enhanced understanding of the electron transfer and mass transport processes of related EC applications.
Results and discussion
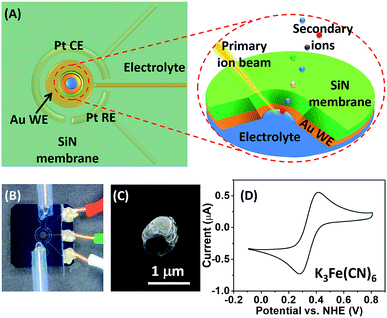
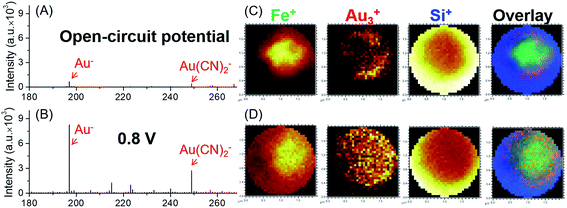
A schematic illustration of the micro-EC cell and in situ ToF-SIMS measurement is shown in Fig. 1A. Three electrodes were sputter-coated on a 100 ± 3 nm thick SiN membrane before being assembled in a PDMS micro-cell. A 45 nm thick gold layer was used as the working electrode. Two 45 nm thick Pt layers acted as the counter electrode and quasi-reference electrode, respectively. After being filled with electrolyte solution, the whole cell was sealed and mounted onto a customized sample holder before being placed in the ToF-SIMS vacuum chamber. During EC reactions, a 1 μm micropore was drilled through the gold-coated SiN membrane using a focused Bi3+ primary ion beam.22 Surface tension would hold the liquid within the micropore, preventing fast evaporation or splashing of the liquid.20 Thus, the micropore served as the detection window, allowing in situ analysis of the EEI under dynamic conditions by ToF-SIMS. A microscopic photo of the micro-EC cell is displayed in Fig. 1B. Three sputter-coated electrodes were connected to the sample holder via three copper wires, and were subsequently controlled by an electrochemical workstation outside of the vacuum. The inlet and outlet PTFE tubes were sealed with a PEEK union before being placed into the ToF-SIMS vacuum chamber. After ToF-SIMS measurement, the micropore was imaged by SEM (Fig. 1C). It was observed that the size of the pore was around 1 μm. Some salt crystals were formed around the frame of the pore during the transfer process from ToF-SIMS to SEM measurement. To test the EC performance of the micro-EC cell, cyclic voltammetry of K3Fe(CN)6 in the cell was measured in the main chamber of the ToF-SIMS. As shown in Fig. 1D, the ratio of peak current ipa/ipc was 1.1, and the separation of peak potentials Epa − Epc was 98 mV, demonstrating the relatively good electron transfer capability of the micro-EC cell even with a low concentration of supporting electrolyte (Fig. S-1†).Here we used the micro-EC cell coupled operando liquid ToF-SIMS to study the interaction between the gold electrode and the [Fe(CN)6]3/4− redox couple. Negative mass spectra of the electrode–electrolyte interface under different potentials are displayed in Fig. 2A and B. Gold-related species, such as Au−, Au(H2O)−, Au(CN)− and Au(CN)2−, were observed at +0.8 V (vs. NHE). Under open-circuit potential, Au− and Au(CN)2− were also detected. However, the intensities were much lower, showing a slight background signal. To further verify that most of the Au(CN)2− was formed in the EC reaction rather than the ToF-SIMS ionization process, mass spectra of the electrolyte taken out of the micro-EC cell before and after CV measurement (100 scans) were compared (Fig. S-2†). The results clearly indicated that a significant amount of Au(CN)2− was formed during the EC reaction, demonstrating the major contribution of the EC reactions in the formation of Au(CN)2−. Chemical mapping images of Au3+ under open-circuit potential or at +0.8 V are displayed in Fig. 2C and D, respectively (also see Fig. S-3† for Au−, CN− and Si−). The results showed that under open-circuit potential, the signals of Au3+ and Au− were mainly originated from the sidewall of the micropore. This was owing to the crater shape of the micropore, with a larger diameter on the upside compared with the bottom side. Thus, signals of Au3+ and Au− were detected from the sidewall of the gold electrode. After +0.8 V potential was applied on the gold electrode, the signals of Au3+ and Au− were detected both inside and at the wall of the micropore. These results demonstrated that the redox reaction of [Fe(CN)6]3/4− caused the dissolution of Au from the electrode surface into the electrolyte, indicating the participation of the gold electrode in the electrochemical conversion between [Fe(CN)6]3− and [Fe(CN)6]4−.
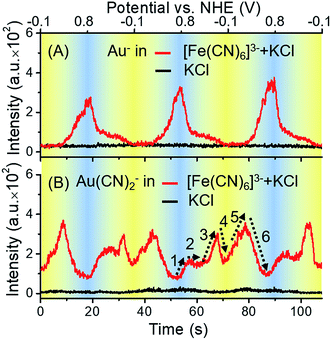
To determine whether the ToF-SIMS ionization process was affected by the potential applied on the gold electrode, a control experiment was conducted without the presence of [Fe(CN)6]3/4−. Potential-resolved variations of Au− are shown in Fig. 3A. Periodic changes of Au− were observed in the presence of [Fe(CN)6]3/4− and the supporting electrolyte (KCl), while the results for the supporting electrolyte only did not show such changes. These results excluded the effect of the electrode potential on the ionization process, further indicating that the gold electrode participated in the redox reactions of [Fe(CN)6]3/4−. As can be seen from the red curve in Fig. 3A, with the increase of potential, the signal of Au− increased. It is worth noting that, owing to the large electronegativity of Au element, Au− was typically detected representative of all valence states of Au in ToF-SIMS. The ionization yield of Au+ was too low to be detected in this case. Thus, the signal of Au− was measured throughout this report to monitor the changes of all valence states of Au.
Previous studies demonstrated that in the presence of free CN−, metallic Au(0) could be oxidized into Au+ to form a soluble Au(CN)2− complex through the following Elsner reaction:23
| 4Au + 8CN− + 2H2O + O2 → 4Au(CN)2− + 4OH− |
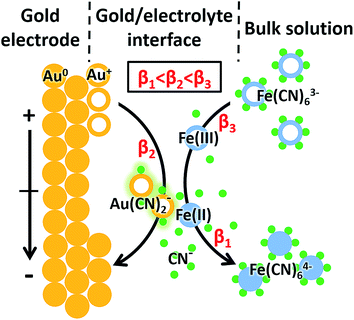
In the case of [Fe(CN)6]3− solution, the complexation of Au+ and CN− was potential-dependent. We investigated the potential-resolved changes of Au(CN)2− in the redox reaction of [Fe(CN)6]3/4− (Fig. 3B). The cumulative formation constant is frequently used to describe the stability of a complex. The cumulative formation constants of Fe(CN)63−, Au(CN)2− and Fe(CN)64− are displayed in Table 1. For comparison, the stability of each complex is in the order Fe(CN)63− > Au(CN)2− > Fe(CN)64−. Thus, the competition of the three complexes depends largely on the variations of Fe3+, Fe2+ and Au+ at the electrode–electrolyte interface. According to the periodic change of Au(CN)2− shown in Fig. 3B, a redox cycle was divided into 6 regions, as marked with the dashed arrows. The first region was from +0.80 to +0.55 V. An increase of Au(CN)2− was observed, which was due to the slowdown of Fe(CN)63− formation. In this region, lots of Au+ turned into Au(CN)2−, leading to a sharp decrease of Au−. In region 2 (+0.55 to +0.40 V), the competition between Fe3+ and Au+ reached a balance. Thus, a flat curve was obtained. In region 3 (+0.40 to +0.05 V), Fe3+ started to be reduced into Fe2+. Since Au(CN)2− was more stable than Fe(CN)64−, the signal of Au(CN)2− continued to rise. In region 4 (+0.05 to −0.10 V), a large amount of Fe(CN)64− was formed. Since Fe(CN)64− is more negative than Fe(CN)63−, Fe(CN)64− is more likely to be repelled from the negatively charged working electrode than Fe(CN)63−. Thus, despite the consecutive formation of Fe(CN)64−, these anions tended to migrate to the bulk solution immediately, resulting in the decrease of Au(CN)2−. In the oxidation segment, an increase of Au(CN)2− was first observed (region 5, −0.10 to +0.30 V), followed by a decrease (region 6, +0.30 to +0.80 V). These changes were attributed to the slowdown of Fe(CN)64− migration (region 5), as well as the decrease of Fe(CN)64− and the formation of Fe(CN)63− (region 6). In addition, potential-resolved variations of CN− and Fe(CN)3− are shown in Fig. S-4.† Under relatively high potential, the intensities of CN− and Fe(CN)3− are higher than under relatively low potential. The results demonstrated the main contribution of electrostatic interactions between the electrode and the negatively charged ions (CN− and Fe(CN)3−). The proposed mechanism is shown in Fig. 4. As an intermediate species in the redox conversion between [Fe(CN)6]3− and [Fe(CN)6]4−, the change of the Au(CN)2− was determined by two factors: the competition between Au+ and Fe3+/Fe2+ for complexation with CN− and the electric field force-caused attraction or repulsion between the gold electrode and [Fe(CN)6]3/4−. Both of these factors were controlled by the potential applied on the electrode surface. Under high potential, abundant Fe3+ hampered the complexation between Au+ and CN−. With the decrease of potential, the transformation from Fe3+ to Fe2+ resulted in an increase of Au(CN)2−, until the electrostatic repulsion of [Fe(CN)6]4− became a dominant factor. The interaction between the gold electrode and [Fe(CN)6]3/4− could be a possible explanation for the passivation and surface roughening of gold electrodes in long-term measurement of the [Fe(CN)6]3/4− system.5
| Ligand | Metal ion | Complex | lg![[thin space (1/6-em)]](https://www.rsc.org/images/entities/char_2009.gif) βn βn |
|---|---|---|---|
| CN− | Fe2+ | Fe(CN)64− | 35.0 |
| Fe3+ | Fe(CN)63− | 42.0 | |
| Au+ | Au(CN)2− | 38.3 |
Conclusions
In conclusion, a micro-EC reactor was coupled with ToF-SIMS for real-time and in situ monitoring of an electrode–electrolyte interface. Detailed molecular information regarding the transition processes occurring at the electrode–electrolyte interface was obtained. Our results indicated that [Fe(CN)6]3/4− caused the dissolution of the gold electrode, while the gold electrode participated in the redox reaction of [Fe(CN)6]3/4− by competing with it to form Au(CN)2−. Such findings could provide new insights into understanding [Fe(CN)6]3/4−-related electron transfer processes, which are vital in mechanistic studies of related electrochemical processes.Conflicts of interest
There are no conflicts to declare.Acknowledgements
This research was supported by the National Natural Science Foundation of China (21705046, 21421004), the Innovation Program of Shanghai Municipal Education Commission (2017-01-07-00-02-E00023), the Fundamental Research Funds for the Central Universities (222201718001, 222201717003), the Shanghai Sailing Program (17YF1403000) and the Shanghai Natural Science Foundation (17ZR1407700).Notes and references
- A. L. Furst, M. G. Hill and J. K. Barton, Langmuir, 2015, 31, 6554–6562 CrossRef CAS
.
- E. M. Boon, D. M. Ceres, T. G. Drummond, M. G. Hill and J. K. Barton, Nat. Biotechnol., 2000, 18, 1096–1100 CrossRef CAS
.
- C. M. Pharr and P. R. Griffiths, Anal. Chem., 1997, 69, 4673–4679 CrossRef CAS
.
- C. M. Pharr and P. R. Griffiths, Anal. Chem., 1997, 69, 4665–4672 CrossRef CAS
.
- J. Lazar, C. Schnelting, E. Slavcheva and U. Schnakenberg, Anal. Chem., 2016, 88, 682–687 CrossRef CAS PubMed
.
- S. Vogt, Q. Su, C. Gutiérrez-Sánchez and G. Nöll, Anal. Chem., 2016, 88, 4383–4390 CrossRef CAS
.
- M. Dijksma, B. A. Boukamp, B. Kamp and W. P. van Bennekom, Langmuir, 2002, 18, 3105–3112 CrossRef CAS
.
- W. D. Chen, S.-K. Kang, W. J. Stark, J. A. Rogers and R. N. Grass, Sens. Actuators, B, 2019, 282, 52–59 CrossRef CAS
.
- Y.-F. Huang, P. J. Kooyman and M. T. Koper, Nat. Commun., 2016, 7, 12440 CrossRef CAS PubMed
.
- H. G. Sanchez Casalongue, M. L. Ng, S. Kaya, D. Friebel, H. Ogasawara and A. Nilsson, Angew. Chem., Int. Ed., 2014, 53, 7169–7172 CrossRef CAS PubMed
.
- F. Blanc, M. Leskes and C. P. Grey, Acc. Chem. Res., 2013, 46, 1952–1963 CrossRef CAS PubMed
.
- A. V. Cresce, S. M. Russell, D. R. Baker, K. J. Gaskell and K. Xu, Nano Lett., 2014, 14, 1405–1412 CrossRef CAS PubMed
.
- Z. Zeng, W.-I. Liang, H.-G. Liao, H. L. Xin, Y.-H. Chu and H. Zheng, Nano Lett., 2014, 14, 1745–1750 CrossRef CAS
.
- J. Lu, X. Hua and Y.-T. Long, Analyst, 2017, 142, 691–699 RSC
.
- S. Bruckenstein and R. R. Gadde, J. Am. Chem. Soc., 1971, 93, 793–794 CrossRef CAS
.
- B. B. Berkes, A. Jozwiuk, M. Vračar, H. Sommer, T. Brezesinski and J. Janek, Anal. Chem., 2015, 87, 5878–5883 CrossRef CAS PubMed
.
- R. Qiu, X. Zhang, H. Luo and Y. Shao, Chem. Sci., 2016, 7, 6684–6688 RSC
.
- T. A. Brown, N. Hosseini-Nassab, H. Chen and R. N. Zare, Chem. Sci., 2016, 7, 329–332 RSC
.
- T. A. Brown, H. Chen and R. N. Zare, Angew. Chem., Int. Ed., 2015, 127, 11335–11337 CrossRef
.
- B. Liu, X.-Y. Yu, Z. Zhu, X. Hua, L. Yang and Z. Wang, Lab Chip, 2014, 14, 855–859 RSC
.
- Z. Wang, Y. Zhang, B. Liu, K. Wu, S. Thevuthasan, D. R. Baer, Z. Zhu, X.-Y. Yu and F. Wang, Anal. Chem., 2017, 89, 960–965 CrossRef CAS PubMed
.
- Y. Zhou, J. Yao, Y. Ding, J. Yu, X. Hua, J. E. Evans, X. Yu, D. B. Lao, D. J. Heldebrant and S. K. Nune, J. Am. Soc. Mass Spectrom., 2016, 27, 2006–2013 CrossRef CAS PubMed
.
- G. Zhang, Y. Qiao, T. Xu, C. Zhang, Y. Zhang, L. Shi, S. Shuang and C. Dong, Nanoscale, 2015, 7, 12666–12672 RSC
.
-
J. G. Speight, Lange's handbook of chemistry, McGraw-Hill, New York, 2005 Search PubMed
.
Footnotes |
| † Electronic supplementary information (ESI) available: Experimental details and supplementary figures. See DOI: 10.1039/c9sc00956f |
| ‡ Equal contribution. |
| This journal is © The Royal Society of Chemistry 2019 |


