 Open Access Article
Achieving high performance poly(vinylidene fluoride) dielectric composites via in situ polymerization of polypyrrole nanoparticles on hydroxylated BaTiO3 particles†
Xu
Xie
a,
Zhen-zhen
He
a,
Xiao-dong
Qi
a,
Jing-hui
Yang
a,
Yan-zhou
Lei
b and
Yong
Wang
 *a
*a
aSchool of Materials Science & Engineering, Key Laboratory of Advanced Technologies of Materials (Ministry of Education), Southwest Jiaotong University, Chengdu, 610031, China. E-mail: yongwang1976@163.com; Tel: +86 28 87603042
bAnalytical and Testing Center, Southwest Jiaotong University, Chengdu, 610031, China
First published on 24th July 2019
Abstract
Polymer dielectric composites have widespread applications in many fields ranging from energy storage, microelectronic devices, and sensors to power driven systems, etc. and attract much attention of researchers. However, it is still challenging to prepare advanced polymer dielectric composites with a high dielectric constant (ε′), low dielectric loss (tan![[thin space (1/6-em)]](https://www.rsc.org/images/entities/char_2009.gif) δ) and simultaneously high breakdown strength (Ebd). In this work, conductive polypyrrole (PPy) nanoparticles were in situ synthesized in a reaction system containing the common barium titanate (BaTiO3, BT) or hydroxylated BaTiO3 (BTOH) particles, and then the PPy@BT and PPy@BTOH composite particles were incorporated into poly(vinylidene fluoride) (PVDF) to prepare the composites. The morphologies and microstructures of the PPy@BT and PPy@BTOH composite particles and the corresponding PVDF composites were comparatively investigated. The results showed that the PPy@BTOH composite particles had a ‘mulberry’-like morphology with a rough surface and the self-assembled structure could be maintained in the PVDF composites, which was apparently different from the PVDF/PPy@BT composites, in which most of the PPy nanoparticles dissociatively dispersed in the PVDF matrix. Electrical conductivity measurements showed that at high particle content (≥20 wt%), the PPy@BTOH composite particles endowed the composites with lower electrical conductivity compared with the PPy@BT composite particles. Dielectric property measurements showed that the ‘mulberry’-like PPy@BTOH composite particles endowed the PVDF composites with extremely high ε′, ultralow tan
δ) and simultaneously high breakdown strength (Ebd). In this work, conductive polypyrrole (PPy) nanoparticles were in situ synthesized in a reaction system containing the common barium titanate (BaTiO3, BT) or hydroxylated BaTiO3 (BTOH) particles, and then the PPy@BT and PPy@BTOH composite particles were incorporated into poly(vinylidene fluoride) (PVDF) to prepare the composites. The morphologies and microstructures of the PPy@BT and PPy@BTOH composite particles and the corresponding PVDF composites were comparatively investigated. The results showed that the PPy@BTOH composite particles had a ‘mulberry’-like morphology with a rough surface and the self-assembled structure could be maintained in the PVDF composites, which was apparently different from the PVDF/PPy@BT composites, in which most of the PPy nanoparticles dissociatively dispersed in the PVDF matrix. Electrical conductivity measurements showed that at high particle content (≥20 wt%), the PPy@BTOH composite particles endowed the composites with lower electrical conductivity compared with the PPy@BT composite particles. Dielectric property measurements showed that the ‘mulberry’-like PPy@BTOH composite particles endowed the PVDF composites with extremely high ε′, ultralow tan![[thin space (1/6-em)]](https://www.rsc.org/images/entities/char_2009.gif) δ and high Ebd compared with the PVDF/PPy@BT composites with dissociatively dispersed PPy nanoparticles and BaTiO3 particles. The polarization and loss mechanisms of the composites were then proposed based on the morphologies and the microstructures of the composites. This work provides an alternative way to fabricate functional dielectric particles through trace functional groups inducing in situ polymerization of conductive polymers, and these particles can be used to fabricate advanced dielectric composites.
δ and high Ebd compared with the PVDF/PPy@BT composites with dissociatively dispersed PPy nanoparticles and BaTiO3 particles. The polarization and loss mechanisms of the composites were then proposed based on the morphologies and the microstructures of the composites. This work provides an alternative way to fabricate functional dielectric particles through trace functional groups inducing in situ polymerization of conductive polymers, and these particles can be used to fabricate advanced dielectric composites.
1. Introduction
With the rapid development of microelectronic devices, polymer dielectric composites that have a high dielectric constant (ε′), low dielectric loss (tan![[thin space (1/6-em)]](https://www.rsc.org/images/entities/char_2009.gif) δ) and high dielectric breakdown strength (Ebd) have become one of the most important materials used to prepare device components, because most of the polymer dielectric composites have various advantages, such as easy processing, easily tailored microstructure, high chemical resistance, good insulating properties, high flexibility, etc. Incorporating ceramics with high ε′ into polymers through appropriate compounding methods is an alternative way to enhance ε′ of polymer dielectric composites and simultaneously maintain high electrical insulating properties. To date, various ceramics such as barium titanate (BaTiO3),1 (BaSr)TiO3,2 boron nitride (BN),3 potassium tantalite-niobate (KTN),4 α-carborundum (α-SiC),5 lead zirconate titanate (PZT),6etc. have been used to prepare polymer dielectric composites. Among these dielectric ceramic particles, BaTiO3 exhibits the most widespread applications. BaTiO3 exhibits high ε′ (up to 6000).7–10 However, due to the weak interfacial polarization in polymer/BaTiO3 composites, a high content of BaTiO3 is usually required to achieve high ε′ in the composites, which usually results in the deterioration of the processing flowability and mechanical properties.11
δ) and high dielectric breakdown strength (Ebd) have become one of the most important materials used to prepare device components, because most of the polymer dielectric composites have various advantages, such as easy processing, easily tailored microstructure, high chemical resistance, good insulating properties, high flexibility, etc. Incorporating ceramics with high ε′ into polymers through appropriate compounding methods is an alternative way to enhance ε′ of polymer dielectric composites and simultaneously maintain high electrical insulating properties. To date, various ceramics such as barium titanate (BaTiO3),1 (BaSr)TiO3,2 boron nitride (BN),3 potassium tantalite-niobate (KTN),4 α-carborundum (α-SiC),5 lead zirconate titanate (PZT),6etc. have been used to prepare polymer dielectric composites. Among these dielectric ceramic particles, BaTiO3 exhibits the most widespread applications. BaTiO3 exhibits high ε′ (up to 6000).7–10 However, due to the weak interfacial polarization in polymer/BaTiO3 composites, a high content of BaTiO3 is usually required to achieve high ε′ in the composites, which usually results in the deterioration of the processing flowability and mechanical properties.11
Generally speaking, ε′ of polymer dielectric composites is mainly determined by the degree of interfacial polarization. This indicates that the presence of more interfaces will induce a higher degree of interfacial polarization. Therefore, many research studies have been carried out to increase the number of interfaces and/or construct multiple interfaces in polymer/BaTiO3 composites. These methods are mainly related to tailoring the particle size of BaTiO3,12 improving the dispersion of BaTiO3 nanoparticles,13 fabricating composite BaTiO3 particles with ‘core–shell’-like structures,14etc. ‘Core–shell’-like BaTiO3 particles can be fabricated through different methods, such as depositing other nanoparticles15 or coating the surface of BaTiO3 with polymer layers, and the dielectric properties of the composites can be well tailored by tailoring the microstructure and thickness of the ‘shell’.16 From the viewpoint of interfacial interaction and/or compatibility, coating the BaTiO3 surface with a polymer ‘shell’ may be a promising method to achieve high ε′ and simultaneously improve the dispersion of particles in the composites.14
According to the classical Maxwell–Wagner theory,17 increasing the differences in dielectric constant and electrical conductivity at the interface region is favorable for the enhancement of interfacial polarization in an alternating electric field. This indicates that coating the insulating BaTiO3 with a conductive polymer layer may promote interfacial polarization.18 On the one hand, the conjugated structure in the molecular chains facilitates the migration of carriers, which is favorable for the enhancement of interfacial polarization, leading to high ε′. On the other hand, the migration of carriers throughout the whole sample also results in the occurrence of leakage current, which not only leads to the enhancement of tan![[thin space (1/6-em)]](https://www.rsc.org/images/entities/char_2009.gif) δ but also results in lower Ebd. Therefore, the dispersion of the ‘core–shell’-like BaTiO3 particles in the composites should be carefully controlled so that the conductive path can be obstructed. Incorporating other insulating fillers19 or polymers14 has been demonstrated to be an efficient strategy to tailor the dispersion of the ‘core–shell’-like BaTiO3 particles in polymer composites.
δ but also results in lower Ebd. Therefore, the dispersion of the ‘core–shell’-like BaTiO3 particles in the composites should be carefully controlled so that the conductive path can be obstructed. Incorporating other insulating fillers19 or polymers14 has been demonstrated to be an efficient strategy to tailor the dispersion of the ‘core–shell’-like BaTiO3 particles in polymer composites.
Owing to the effect of metal nanoparticle-decorated BaTiO3 particles on the dielectric properties of the composites, which show high ε′ and Ebd but low tan![[thin space (1/6-em)]](https://www.rsc.org/images/entities/char_2009.gif) δ,15,20 in this work, polypyrrole (PPy) nanoparticles are coated on the surface of BaTiO3 particles that have an average size in the micrometer scale. Here, the micro-scale BaTiO3 particles are used based on the following considerations. First, the micro-scale BaTiO3 particles may provide a large substrate for the deposition of PPy nanoparticles. Second, different from the nano-scale BaTiO3 particles that usually induce the common ‘core–shell’-like structure of PPy@BaTiO3, since the PPy layer is easily coated on the surface of nano-scale BaTiO3 particles,19 it is relatively difficult to form a homogeneous PPy layer on the micro-scale BaTiO3 particles, which possibly facilitates the deposition of PPy nanoparticles on the surface of the micro-scale BaTiO3 particles. Furthermore, it is well known to all that BaTiO3 particles usually exhibit an inert surface due to the lack of functional groups.21 Therefore, to ensure the successful deposition of PPy nanoparticles, hydroxylation modification is firstly introduced to tailor the surface feature of the BaTiO3 particles.22 After that, the PPy-decorated BaTiO3 particles are incorporated into poly(vinylidene fluoride) (PVDF) to prepare the composites. The results show that hydroxylation modification of BaTiO3 is necessary, which facilitates the in situ polymerization and deposition of PPy nanoparticles on the surface of the hydroxylated BaTiO3 (BTOH), and the composites show largely enhanced ε′ and Ebd while tan
δ,15,20 in this work, polypyrrole (PPy) nanoparticles are coated on the surface of BaTiO3 particles that have an average size in the micrometer scale. Here, the micro-scale BaTiO3 particles are used based on the following considerations. First, the micro-scale BaTiO3 particles may provide a large substrate for the deposition of PPy nanoparticles. Second, different from the nano-scale BaTiO3 particles that usually induce the common ‘core–shell’-like structure of PPy@BaTiO3, since the PPy layer is easily coated on the surface of nano-scale BaTiO3 particles,19 it is relatively difficult to form a homogeneous PPy layer on the micro-scale BaTiO3 particles, which possibly facilitates the deposition of PPy nanoparticles on the surface of the micro-scale BaTiO3 particles. Furthermore, it is well known to all that BaTiO3 particles usually exhibit an inert surface due to the lack of functional groups.21 Therefore, to ensure the successful deposition of PPy nanoparticles, hydroxylation modification is firstly introduced to tailor the surface feature of the BaTiO3 particles.22 After that, the PPy-decorated BaTiO3 particles are incorporated into poly(vinylidene fluoride) (PVDF) to prepare the composites. The results show that hydroxylation modification of BaTiO3 is necessary, which facilitates the in situ polymerization and deposition of PPy nanoparticles on the surface of the hydroxylated BaTiO3 (BTOH), and the composites show largely enhanced ε′ and Ebd while tan![[thin space (1/6-em)]](https://www.rsc.org/images/entities/char_2009.gif) δ is still maintained at a relatively low level. This work provides an alternative way to prepare polymer dielectric composites with promising dielectric properties.
δ is still maintained at a relatively low level. This work provides an alternative way to prepare polymer dielectric composites with promising dielectric properties.
2. Experimental section
2.1 Materials
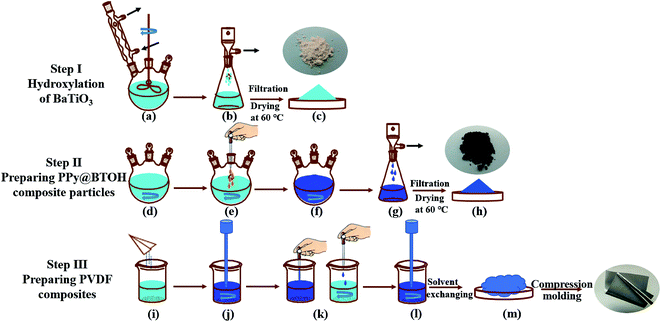
All the materials and reagents were commercially available. PVDF (Kynar 720) was obtained from Arkema (France) and it had a weight average molecular weight of 1.05 × 10⁵ g mol−1 and a density of 1.78 g cm−3. BaTiO3 (BT) particles were obtained from Aladdin Reagent Co. (Shanghai, China). The average diameter was smaller than 3 μm and the purity was higher than 99.5%. Hydrogen peroxide (H2O2, analytical purity), pyrrole (purity higher than 99.5%), and ferric trichloride (FeCl3, analytical purity) were obtained from Kelong Chemical Reagent Co. Ltd. (Chengdu, China).2.2 Sample preparation
2.3 Microstructure characterization
The chemical features of the particles, the interactions between components in the composites, and the crystalline structures of the PVDF matrix were characterized using a Fourier transform infrared (FTIR) spectrometer, TENSOR II (BRUKER, Germany). To characterize the particles, a transmission mode was selected, while a total reflection mode was used when characterizing the composites. During the measurements, the wavenumber range was set at 400–4000 cm−1 with a resolution of 4 cm−1.The crystalline structures of the particles as well as the PVDF matrix were characterized using a wide-angle X-ray diffraction (WAXD) DX-100 (Panalytical, the Netherlands). The scanning angle range was set at 5°–80°.
The dispersion of the composite particles in the liquid was also characterized using a UV-vis spectrometer, UV-2600 (SHIMADZU, Japan). The concentration of particles in the DMF solution was set at 0.01 mg mL−1 and the measurements were carried out in the wavelength range of 200–800 nm. The mixture was firstly ultrasonically treated at a power of 600 W for 10 min; then it was statically placed for 24 h. And then, the suspension was measured. To provide a good visual effect, the concentration of particles was increased to 0.1 mg mL−1 and the mixture was also treated through the same procedures; then photos of the dispersion state of the particles in DMF were taken.
The morphologies of the as-obtained particles and the dispersion states of particles in the composites were characterized using a scanning electron microscope (SEM), Fei Inspect (FEI, the Netherlands). The characterization was carried out at an accelerating voltage of 5 kV. To characterize the morphologies of the composites, the composite sample was cryogenically fractured in liquid nitrogen, and then the fractured surface was characterized. Before SEM characterization, all the samples were sputter-coated with a thin layer of gold.
The morphologies of the composites were further characterized using a transmission electron microscope (TEM), JEM-2100F (JEOL, Japan), which was operated at an operating voltage of 200 kV. A microtome (Leica EM UC7, Germany) was used to prepare the sample slice with a thickness of about 100 nm.
2.4 Performance measurements
The electrical conductivity and the dielectric property measurements were conducted on a broad frequency dielectric spectrometer, Concept 50 (Novocontrol, Germany), and were carried out at 23 °C and 220 V in the frequency range of 10–107 Hz. A square sample was prepared through the compression-molding process as mentioned above and it had a side length of 10 mm and a thickness of 0.2 mm. The top and bottom surfaces of the sample were coated with a thin layer of gold, which showed the role of electrodes during the measurements.The dielectric breakdown strength of the sample was measured using a breakdown voltage tester, BDJC-50 kV (Beiguang Jingyi Instrument, PR China). The sample slice that was prepared through the compression-molding method had a diameter of 40 mm and a thickness of 0.1 mm. The voltage was increased at a rate of 1.5 kV s−1 using an alternating current and the highest measured voltage was 30 kV.
3. Results and discussion
3.1 Microstructure of the PPy@BTOH composite particles
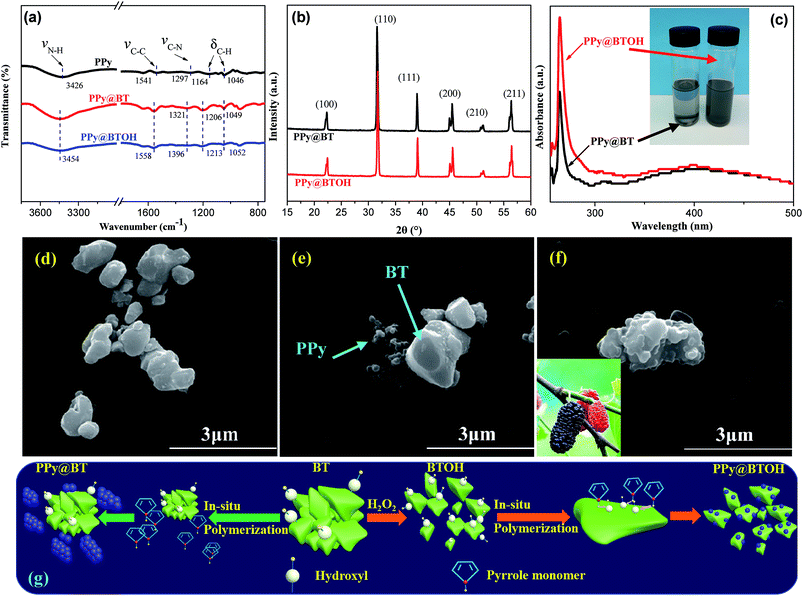
First, the degree of hydroxylation of BTOH in H2O2 was evaluated through different characterization methods including thermal gravimetric analysis (TGA), FTIR and WAXD, and the results are shown in Fig. S1–S3,† respectively. From Fig. S1† it is clearly seen that the BTOH particles show larger weight loss (0.54 wt%) at 800 °C compared with the as-obtained common BT (0.14 wt%). From the FTIR spectra shown in Fig. S2† one can see that the BTOH particles show largely enhanced characteristic absorption bands at 3430 and 1630 cm−1 attributed to the stretching vibrations of O–H and C–OH groups compared with the common BT particles, which further confirms that more hydroxyl groups have been introduced on the surface of BT particles during the hydroxylation reaction process. Furthermore, the WAXD profiles shown in Fig. S3† confirm that the hydroxylation reaction in H2O2 does not apparently influence the crystalline structure of BT particles.Fig. 2a shows the FTIR spectra of pure PPy, and PPy@BT and PPy@BTOH composite particles. Pure PPy nanoparticles show the characteristic absorption bands at 3426, 1541, 1297, and 1164 and 1046 cm−1, which can be attributed to the stretching vibration of N–H, stretching vibration of C–C in the pyrrole ring, stretching vibration of C–N and deformation vibrations of C–H,23 respectively. Both the PPy@BT and PPy@BTOH composite particles show apparent changes of the absorption bands, indicating interfacial interaction between BT (or BTOH) and PPy. Similarly, the WAXD profiles shown in Fig. 2b indicate that the in situ polymerization of PPy does not influence the crystalline structure of BT particles, and all the characteristic diffraction peaks relating to (100), (110), (111), (200), (210) and (211) can be detected at the corresponding 2θ values. The dispersion states of the PPy@BT and PPy@BTOH composite particles in DMF solution were detected via UV-vis spectral measurements, and the corresponding UV-vis spectra are illustrated in Fig. 2c. It can be seen that at the same particle concentration, the PPy@BTOH composite particles show higher absorption intensity compared with the PPy@BT composite particles, indicating that more PPy@BTOH composite particle are dispersed in the suspension. The inserted photo further confirms that after being statically placed for 24 h, some PPy@BT particles sink to the bottom of the bottle and the suspension becomes transparent, while the PPy@BTOH particles still show good dispersion in DMF.
The morphologies of the three kinds of particles, BT, PPy@BT and PPy@BTOH, can be seen in Fig. 2d–f, respectively. In the PPy@BT composite particles, it is clearly seen that most of the PPy nanoparticles aggregate and form agglomerates, while BT still shows a similar smooth surface to that of the pure BT particles as shown in Fig. 2d. However, due to the relatively strong interfacial interaction between PPy and BT as confirmed by FTIR and UV-vis characterizations, the PPy agglomerates still locate near BT particles. Interestingly, in the PPy@BTOH composite particles (Fig. 2f), most of the PPy particles aggregate on the surface of BT and form a ‘mulberry’-like morphology and consequently, the PPy@BTOH composite particles exhibit a rough surface.
Tailoring the dispersion and/or aggregation of polymeric nanoparticles through functionalized particles has also been observed elsewhere. For example, He ZZ et al. introduced graphene oxide (GO) nanosheets in a polymerization system of PPy and found that most of the PPy nanoparticles homogeneously deposited on the sheet surface of GO24 due to the presence of a large number of oxygen-containing groups on the GO surface. In this work, the completely different morphology of the PPy@BTOH composite particles from the PPy@BT composite particles is also mainly attributed to the presence of hydroxyl groups on the BTOH surface. To better understand the effect of hydroxyl groups on the polymerization of PPy, schematic representations are proposed in Fig. 2g. If the common BT particles are present in the reaction system, the number of hydroxyl groups is relatively low and, under these conditions, most of the pyrrole monomers dissociatively disperse in the system. When the polymerization of pyrrole is induced, the formation of PPy nanoparticles is random and not influenced by the common BT particles. However, if the BTOH particles are present in the system, the presence of hydroxyl groups attracts most of the pyrrole monomers on the surface of BT. Once the polymerization of pyrrole is induced, PPy nanoparticles spontaneously deposit on the surface of BTOH. Obviously, the morphology characterization clearly shows that the surface modification of BT is necessary to achieve the successful deposition of conductive PPy nanoparticles on the BT surface. However, there is still another interesting issue, namely, it is still not clear whether the pyrrole monomers are firstly adsorbed on the surface of BTOH or the PPy molecular chains are adsorbed on the surface of BTOH. Considering the different mobilities of pyrrole and PPy molecular chains in the reaction system, it is suggested that pyrrole monomers are firstly adsorbed on the surface of BTOH as mentioned above. More work should be done to confirm the deposition process of PPy nanoparticles on BTOH in the future. Whatever the case may be, the above results clearly show that the PPy@BTOH composite particles with a ‘mulberry’-like structural feature are successfully fabricated in this work.
3.2 Microstructure of the PVDF composites
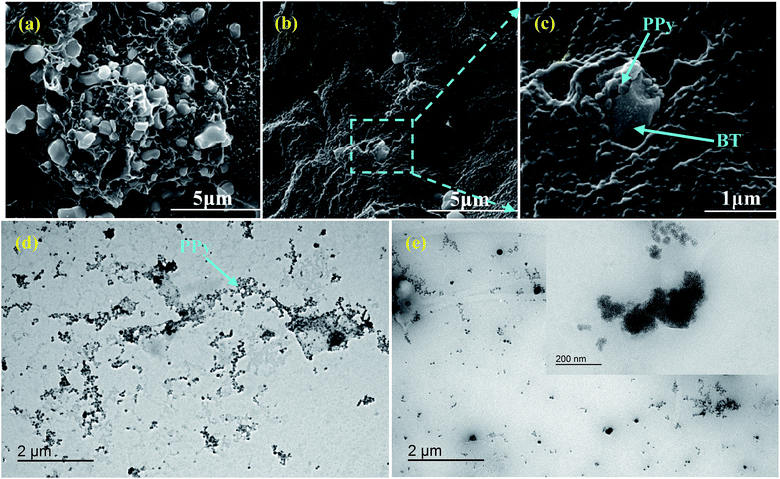
The dispersion states of the two kinds of composite particles, PPy@BT and PPy@BTOH, in the representative PVDF composites, in which the content of composite particles was maintained at 5 wt%, were characterized using SEM, and the results are shown in Fig. 3. In the PVDF/5PPy@BT composite (Fig. 3a), BT particles aggregate together on the one hand. On the other hand, the surface of BT particles is relatively smooth, which indicates poor interfacial interaction between BT and the PVDF matrix. However, largely improved dispersion of BTOH particles is achieved in the PVDF/5PPy@BTOH composite (Fig. 3b). At higher magnifications (Fig. 3c), it is clearly deduced that PPy nanoparticles still adhere to the surface of the BTOH particles. This confirms the strong interfacial adhesion between PPy and BTOH that ensures the maintaining of the ‘mulberry’-like structure in the PVDF composites.To further understand the dispersion states of PPy nanoparticles in the composites, TEM characterization was also carried out and the results are shown in Fig. 3d and e. It is worth noting that there are significant differences between the densities of BT (or BTOH) particles and the PVDF matrix and between the average sizes of BT particles and PPy nanoparticles, which lead to great difficulty in simultaneously characterizing the dispersion of BT and PPy clearly and therefore, the main attention is focused on characterizing the dispersion of PPy nanoparticles in the PVDF matrix. In the PVDF/5PPy@BT composite (Fig. 3d), a large number of PPy nanoparticles can be clearly seen and most of these PPy nanoparticles establish contact with each other and produce a network-like morphology in the composite. However, in the PVDF/5PPy@BTOH composite (Fig. 3e), fewer PPy nanoparticles are observed in the TEM image. This indicates that the dissociative PPy nanoparticles that do not deposit on the BTOH surface are fewer compared with those in the PVDF/5PPy@BT composite. Here, we selected BTOH particles with relatively small size and then characterized the morphology at higher magnifications. As shown in the inserted image in Fig. 3e, PPy nanoparticles tightly adhere to the BTOH particles, which further confirms the strong interfacial interaction between PPy and BTOH.
PVDF is a well-known semicrystalline polymer and it has several polymorphs, including α, β, γ, δ, and ε.25 Among these polymorphs, the polar β and γ-forms exhibit piezoelectric/ferroelectric characteristics and therefore, tailoring the amount of β and γ-forms in the PVDF composites is confirmed to be an efficient way to tailor the dielectric properties of the composites.26 Here, the crystalline structures of the PVDF matrix in the representative composite samples were comparatively investigated through using WAXD and FTIR, and the results are shown in Fig. 4. As shown in Fig. 4a, all the composite samples show the characteristic diffraction peaks at 2θ of 17.6°, 18.4°, 19.9° and 26.6°, attributed to the diffractions of the (100), (020), (110) and (021) crystal planes of α-form PVDF.26 Furthermore, it is also seen that the PVDF/PPy@BT composites show a shoulder peak at 2θ of about 20.6°, which indicates the presence of some β-form PVDF.26 The crystalline structure of the PVDF matrix can be further confirmed through FTIR characterization. As shown in Fig. 4b, the characteristic absorption bands at wavenumbers of 1381 and 764 cm−1 that are usually used to confirm the presence of α-form PVDF are clearly observed in all the PVDF composites, while the characteristic absorption bands relating to β-form PVDF are hardly detected at 1276 and 840 cm−1,26 especially in the PVDF/PPy@BTOH composites. Obviously, WAXD and FTIR characterizations give the same conclusion, namely, the crystalline structure of the PVDF matrix is not apparently influenced by the composite particles and the thermodynamically stable α-form PVDF is the main crystalline structure in both PVDF/PPy@BT and PVDF/PPy@BTOH composites. This indicates that the possible effects of crystalline structure on the dielectric properties of the PVDF composites can be neglected. The crystallization and melting behaviors of the composite samples were also measured through using a differential scanning calorimeter (DSC), and the results are shown in Fig. S4.† It can be seen that although the crystalline structure of the PVDF matrix is not influenced by composite particles, both PPy@BT and PPy@BTOH composite particles exhibit the nucleation effect on the crystallization of the PVDF matrix, which causes a slight enhancement in the crystallization temperature.
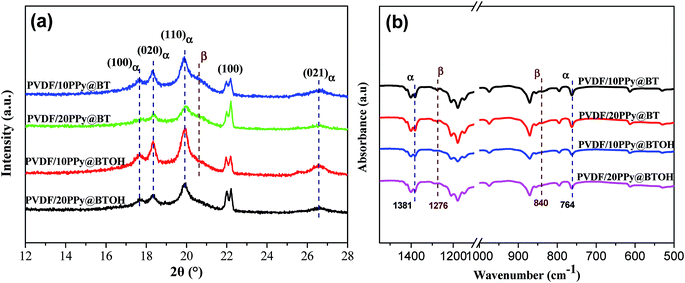 | ||
| Fig. 4 (a) WAXD profiles and (b) FTIR spectra of the representative PVDF composites as indicated in the graphs. | ||
3.3 Electrical conductivity of the composites
PPy is a conductive polymer and the conductivity of the composites incorporating PPy depends not only on the amount of PPy nanoparticles but also on the dispersion states of PPy nanoparticles in the composites.27 Generally, the formation of the PPy network-like structure endows the composites with better electrical conductivity. The above morphological characterization clearly shows that a large number of dissociative PPy nanoparticles form the network-like structure in the PVDF/PPy@BT composites at high filler content while PPy nanoparticles tightly adhere to the BTOH surface in the PVDF/PPy@BTOH composites. The different dispersion states of the conductive PPy nanoparticles may lead to different electrical conductivities of the composites. The electrical conductivities of the composites were measured and the results are shown in Fig. 5. For comparison, the electrical conductivity of the pure PVDF sample is also provided in these graphs. The variation of electrical conductivity of the PVDF/BT composites with increasing BT content is illustrated in Fig. S5.† It is clearly seen that incorporating PPy@BT or PPy@BTOH composite particles leads to the enhancement of the electrical conductivity. At relatively low filler content (≤15 wt%), the two kinds of composite samples show similar electrical conductivities. However, at a filler content of 20 wt%, the PVDF/20PPy@BT composite sample shows much higher electrical conductivity compared with the PVDF/20PPy@BTOH composite sample, which indicates that the percolated PPy network structure is formed in the whole PVDF/20PPy@BT composite. The electrical measurements also indicate that the percolation threshold of electrical conductivity in the PVDF/PPy@BT is smaller than 20 wt%, while it is higher than 20 wt% in the PVDF/PPy@BTOH composites. The AC conductivity of the PVDF/PPy@BTOH composites with more PPy@BTOH (30 and 40 wt%) was also measured, and the results are shown in Fig. S6.† It is clearly seen that the percolation threshold of the PVDF/PPy@BTOH composites is in the range of 30–40 wt%. The electrical conductivity measurements show that through constructing the ‘mulberry’-like structure of the composite particles, PPy nanoparticles are tightly attached to the surface of the hydroxylated BaTiO3 particles, which is favorable for suppressing the percolated network structure of PPy nanoparticles in the composites and finally, suppressing the dielectric loss of the composite.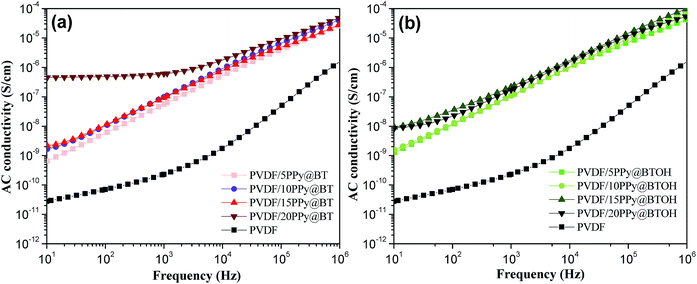 | ||
| Fig. 5 Variations of AC conductivity of the (a) PVDF/PPy@BT and (b) PVDF/PPy@BTOH composites with increasing particle content. | ||
3.4 Dielectric properties of the composites
The dielectric properties of the PVDF/PPy@BT and PVDF/PPy@BTOH composites were comparatively investigated. For comparison, the dielectric properties of the pure PVDF and PVDF/BT composite without PPy nanoparticles were also measured, and the results are shown in Fig. S7.† As expected, incorporating BT particles promotes the enhancement of ε′, but the degree of enhancement is relatively small. For example, at a BT content of 20 wt%, ε′ is slightly increased to 21.4, which is only 33.8% higher than that of the pure PVDF sample (with ε′ of 16 at a frequency of 1000 Hz). Fig. 6 shows the variations of ε′ and tan![[thin space (1/6-em)]](https://www.rsc.org/images/entities/char_2009.gif) δ of the PVDF/PPy@BT and PVDF/PPy@BTOH composites with increasing measurement frequencies, and the data obtained at a frequency of 1000 Hz are illustrated in Fig. 7. First, all the composite samples show a high dependence of dielectric properties on frequency, especially at higher filler content. Second, ε′ and tan
δ of the PVDF/PPy@BT and PVDF/PPy@BTOH composites with increasing measurement frequencies, and the data obtained at a frequency of 1000 Hz are illustrated in Fig. 7. First, all the composite samples show a high dependence of dielectric properties on frequency, especially at higher filler content. Second, ε′ and tan![[thin space (1/6-em)]](https://www.rsc.org/images/entities/char_2009.gif) δ gradually increase with increasing filler content. Furthermore, one can see that the percolation threshold of PPy@BT composite particles in the PVDF/PPy@BT composite samples is higher than 15 wt% but smaller than 20 wt%, because ε′ and tan
δ gradually increase with increasing filler content. Furthermore, one can see that the percolation threshold of PPy@BT composite particles in the PVDF/PPy@BT composite samples is higher than 15 wt% but smaller than 20 wt%, because ε′ and tan![[thin space (1/6-em)]](https://www.rsc.org/images/entities/char_2009.gif) δ show a dramatic increase at filler content higher than 15 wt%. However, it is difficult to determine the percolation threshold of PPy@BTOH composite particles in the PVDF/PPy@BTOH composite samples. The PVDF/20PPy@BTOH composite sample shows a large enhancement in ε′ and tan
δ show a dramatic increase at filler content higher than 15 wt%. However, it is difficult to determine the percolation threshold of PPy@BTOH composite particles in the PVDF/PPy@BTOH composite samples. The PVDF/20PPy@BTOH composite sample shows a large enhancement in ε′ and tan![[thin space (1/6-em)]](https://www.rsc.org/images/entities/char_2009.gif) δ, but in the PVDF/15PPy@BTOH composite sample, ε′ is also greatly enhanced while tan
δ, but in the PVDF/15PPy@BTOH composite sample, ε′ is also greatly enhanced while tan![[thin space (1/6-em)]](https://www.rsc.org/images/entities/char_2009.gif) δ still remains at a relatively low level. The differences in percolation threshold between the PVDF/PPy@BT and PVDF/PPy@BTOH composite samples are suggested to be mainly related to the dispersion states of dissociative PPy nanoparticles in the PVDF matrix. In the former composites, most of the PPy nanoparticles are dissociatively dispersed in the PVDF matrix. Once the amount of PPy nanoparticles is increased up to the percolation threshold, PPy nanoparticles may form the percolated network structure in the PVDF composites, which provides the conductive path for the migration of carriers and consequently, both ε′ and tan
δ still remains at a relatively low level. The differences in percolation threshold between the PVDF/PPy@BT and PVDF/PPy@BTOH composite samples are suggested to be mainly related to the dispersion states of dissociative PPy nanoparticles in the PVDF matrix. In the former composites, most of the PPy nanoparticles are dissociatively dispersed in the PVDF matrix. Once the amount of PPy nanoparticles is increased up to the percolation threshold, PPy nanoparticles may form the percolated network structure in the PVDF composites, which provides the conductive path for the migration of carriers and consequently, both ε′ and tan![[thin space (1/6-em)]](https://www.rsc.org/images/entities/char_2009.gif) δ are greatly enhanced. However, in the latter composites, most of the PPy nanoparticles adhere to the surface of BTOH particles. Under these conditions, the amount of dissociative PPy nanoparticles in the PVDF matrix is relatively small, which results in a low dependence of electrical conductivity on the filler content as shown in Fig. 5.
δ are greatly enhanced. However, in the latter composites, most of the PPy nanoparticles adhere to the surface of BTOH particles. Under these conditions, the amount of dissociative PPy nanoparticles in the PVDF matrix is relatively small, which results in a low dependence of electrical conductivity on the filler content as shown in Fig. 5.
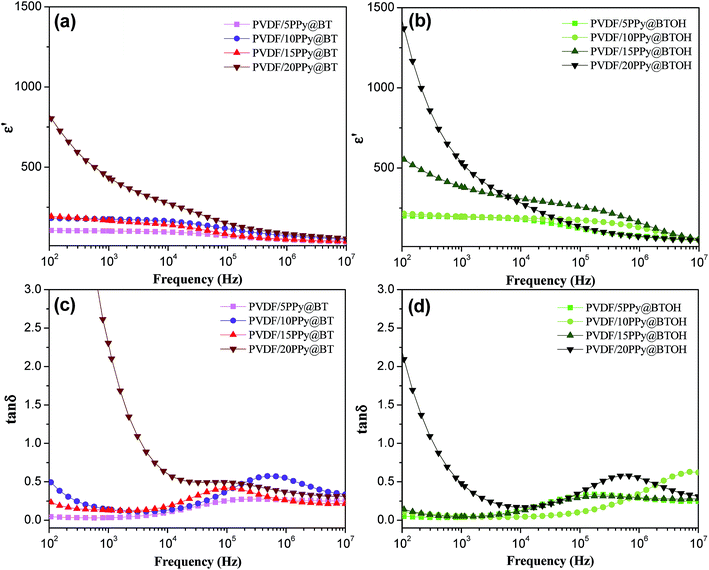 | ||
| Fig. 6 (a and b) Dielectric constant and (c and d) dielectric loss of the PVDF/PPy@BT (a and c) and PVDF/PPy@BTOH (b and d) composites as indicated in the graphs. | ||
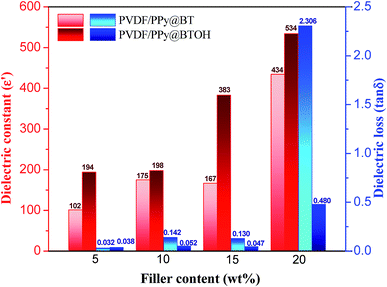 | ||
| Fig. 7 Comparison of the dielectric constant and dielectric loss between the PVDF/PPy@BT and PVDF/PPy@BTOH composites. Data were obtained at a frequency of 1000 Hz. | ||
As shown in Fig. 7, the effects of the PPy@BT and PPy@BTOH composite particles on the dielectric properties are very apparent on the one hand. On the other hand, PPy@BTOH composite particles endow the composites with higher ε′ in all the compositions. For example, incorporating 5 wt% PPy@BT composite particles leads to a great enhancement of ε′ from 16 for the pure PVDF sample (seen in Fig. S7†) to 102. However, incorporating 5 wt% PPy@BTOH composite particles leads to the enhancement of ε′ to 194, which is 90.2% higher than that of the PVDF/5PPy@BT composite sample and even 1113% higher than that of the pure PVDF sample. Higher filler content results in higher ε′. At a filler content of 20 wt%, the PVDF/20PPy@BT and PVDF/20PPy@BTOH composite samples show ε′ of 434 and 534, respectively. The most important observation is that the PPy@BTOH composite particles endow the PVDF composite samples with lower tan![[thin space (1/6-em)]](https://www.rsc.org/images/entities/char_2009.gif) δ compared with the PPy@BT composite particles, especially at high filler content. For example, the PVDF/15PPy@BTOH composite sample shows a tan
δ compared with the PPy@BT composite particles, especially at high filler content. For example, the PVDF/15PPy@BTOH composite sample shows a tan![[thin space (1/6-em)]](https://www.rsc.org/images/entities/char_2009.gif) δ of 0.047, which is 63.8% lower than that of the PVDF/15PPy@BT composite sample (0.13), while in the PVDF/20PPy@BTOH composite sample, although tan
δ of 0.047, which is 63.8% lower than that of the PVDF/15PPy@BT composite sample (0.13), while in the PVDF/20PPy@BTOH composite sample, although tan![[thin space (1/6-em)]](https://www.rsc.org/images/entities/char_2009.gif) δ is also enhanced up to 0.48, a more apparent enhancement of tan
δ is also enhanced up to 0.48, a more apparent enhancement of tan![[thin space (1/6-em)]](https://www.rsc.org/images/entities/char_2009.gif) δ is achieved for the PVDF/20PPy@BT composite sample (2.306). Under these conditions, tan
δ is achieved for the PVDF/20PPy@BT composite sample (2.306). Under these conditions, tan![[thin space (1/6-em)]](https://www.rsc.org/images/entities/char_2009.gif) δ of the former composite sample is 79.2% lower than that of the latter composite sample. Obviously, the self-assembled PPy@BTOH composite particles with a ‘mulberry’-like structure endow the composite samples with high ε′ but low tan
δ of the former composite sample is 79.2% lower than that of the latter composite sample. Obviously, the self-assembled PPy@BTOH composite particles with a ‘mulberry’-like structure endow the composite samples with high ε′ but low tan![[thin space (1/6-em)]](https://www.rsc.org/images/entities/char_2009.gif) δ.
δ.
To better understand the role of PPy@BTOH composite particles in enhancing the dielectric properties of the PVDF-based composites, a simple comparison has been carried out between the composites prepared in our work and the other composites reported in the literature,14,19,20,28–33 and the results are listed in Table 1. The results further confirm that constructing the PPy@BTOH composite particles with a ‘mulberry’-like structure is a highly efficient way to enhance ε′ of the composites.
| Type of BaTiO3 | Modification method | Filler content | ε′ | tan![[thin space (1/6-em)]](https://www.rsc.org/images/entities/char_2009.gif) δ δ |
Ref. |
|---|---|---|---|---|---|
| Nano-BT | BTOH | 20 vol% | 23 | 0.002 | 20 |
| Nano-BT | Core–satellite Ag@BT | 20 vol% | 25 | 0.05 | 14 |
| Nano-BT | Ag-deposited-BT | 20 wt% | 13.6 | 0.03 | 19 |
| Nano-BT | CNT-deposited BT | 9.5 vol% | 200 | 0.25 | 28 |
| Nano-BT | Core–shell SiO2@BT | 10 vol% | 14.7 | 0.04 | 29 |
| Nano-BT | Core–shell Al2O3@BT | 20 vol% | 17.5 | 0.02 | 30 |
| Nano-BT | Core–satellite Fe3O4@BT | 25.4 vol% | >103 | <1 | 31 |
| Nano-BT | Dopamine-functionalized BT | 20 wt% | 30 | 0.04 | 32 |
| Micro-BT | Core–shell polydopamine@BT | 20 vol% | 25 | 0.025 | 33 |
| Micro-BT | PPy@BTOH | 20 wt% | 534 | 0.48 | This work |
The breakdown strength of the composite samples was measured, and the results are shown in Fig. 8. The data obtained during the measurements were analyzed through the classical Weibull distribution function as shown in the following:34
 | (1) |
 | (2) |
![[thin space (1/6-em)]](https://www.rsc.org/images/entities/char_2009.gif) E.
E.
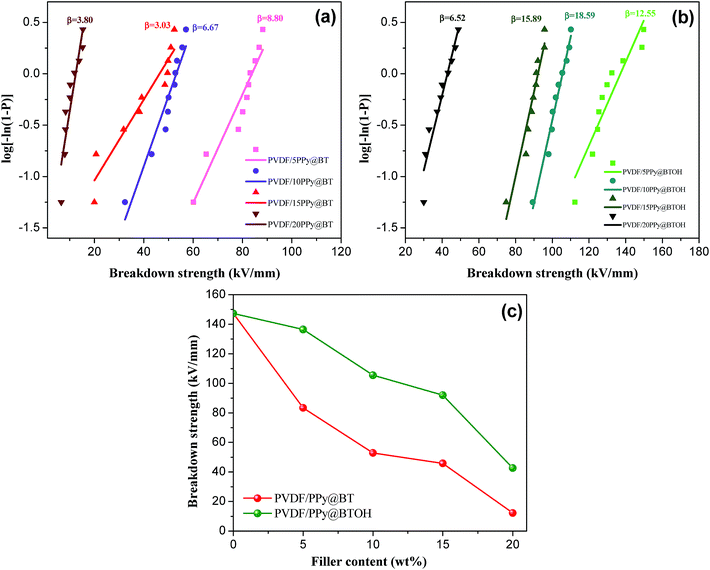
As shown in Fig. 8a and b, at the same filler contents, the PVDF/PPy@BTOH composite samples show higher β values compared with the PVDF/PPy@BT composites. This indicates that the former composites have better reliability. As expected, the incorporation of particles leads to the reduction of Ebd. The more the particles in the composites, the lower the Ebd is. On the other hand, the PVDF/PPy@BTOH composites also show higher Ebd compared with the PVDF/PPy@BT composites at the same filler content, indicating that the former composites can sustain higher operating electric field. It is well known that Ebd of the composites is influenced by many factors, such as the dispersion of particles, the formation of the conductive path, the interfacial adhesion between the fillers and polymer matrix, etc.35 In the PVDF/PPy@BT composites, most of the PPy nanoparticles are dissociatively dispersed in the PVDF matrix and form the network-like structure at relatively high content, which may lead to the occurrence of leakage current in the electric field and consequently, result in the reduction of Ebd. On the other hand, the interfacial interaction between BT particles and the PVDF matrix is relatively poor and consequently, the poor interfacial adhesion results in many defects in the composites, which is unfavorable for the maintenance of Ebd. However, in the PVDF/PPy@BTOH composites, most of the PPy nanoparticles tightly adhere to the surface of BTOH particles, which possibly reduces the defects in the composites. On the other hand, the dissociative PPy nanoparticles in the PVDF matrix are few and the conductive path is difficult to form and therefore, the probability of leakage current inducing the deterioration of Ebd is greatly reduced.
3.5 Further understanding the polarization and loss mechanisms of the composites
To further understand the polarization and loss mechanisms in the PVDF/PPy@BT and PVDF/PPy@BTOH composites, more visualized schematic representations are proposed according to the above observations and shown in Fig. 9. In the PVDF/PPy@BT composites (Fig. 9a), because most of the PPy nanoparticles dissociatively disperse in the PVDF matrix and therefore, the composites can be thought of as a simple combination of the PVDF/PPy and PVDF/BT composites, the enhancement of ε′ is mainly attributed to the interfacial polarization between PVDF and PPy nanoparticles and between PVDF and BT particles. At relatively low filler content, carriers (or space charges) accumulate at the interfaces in the alternating electric field, forming a large number of micro-capacitance structures, which leads to the enhancement of ε′. With the increase of filler content, PPy nanoparticles aggregate together and form the local conductive path, which facilitates the migration and accumulation of carriers, and finally, largely enhanced ε′ is achieved. However, the migration of carriers also results in the leakage current, which leads to the dramatic enhancement of tan![[thin space (1/6-em)]](https://www.rsc.org/images/entities/char_2009.gif) δ and the great decrease of Ebd.
δ and the great decrease of Ebd.
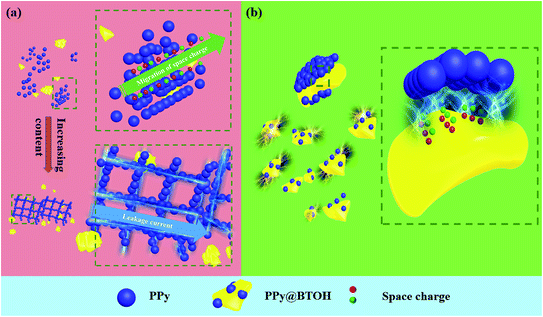 | ||
| Fig. 9 Schematic representations showing the polarization and loss mechanisms of the (a) PVDF/PPy@BT and (b) PVDF/PPy@BTOH composites. | ||
However, in the PVDF/PPy@BTOH composites (Fig. 9b), most of the PPy nanoparticles still adhere to the surface of the hydroxylated BaTiO3 and under these conditions, there are multiple interfaces in the composites, including the interface between PVDF and PPy and the interface between PPy and BTOH particles. Specifically, these interfaces are organized in a limited space. The strong interfacial polarization presented at these interfaces may superpose mutually, which leads to the great enhancement of ε′. Obviously, the more the composite particles in the composites, the more apparent the superposition of interfacial polarization is and consequently, the higher the ε′ is. On the other hand, the composite particles show a rough surface due to the irregular stacking of PPy nanoparticles and therefore, the interface area is increased, which also facilitates the enhancement of ε′. This is apparently different from the common ‘core–shell’-like composite particles with a smooth sheath.36,37 Furthermore, since most of the PPy nanoparticles adhere to the surface of the insulating BTOH particles, the dissociatively dispersed PPy nanoparticles in the PVDF matrix are relatively few and cannot form the local conductive path. Therefore, the migration of carriers in the composites is greatly restricted and accordingly, tan![[thin space (1/6-em)]](https://www.rsc.org/images/entities/char_2009.gif) δ is suppressed at a lower level compared with the PVDF/PPy@BT composites. Furthermore, since most of the PPy nanoparticles tightly adhere to the surface of the BTOH particles, the composite PPy@BTOH particles may play a role in the Coulomb-blockade effect in the composites, which also suppresses tan
δ is suppressed at a lower level compared with the PVDF/PPy@BT composites. Furthermore, since most of the PPy nanoparticles tightly adhere to the surface of the BTOH particles, the composite PPy@BTOH particles may play a role in the Coulomb-blockade effect in the composites, which also suppresses tan![[thin space (1/6-em)]](https://www.rsc.org/images/entities/char_2009.gif) δ of the composites.38 The similar phenomena have also been reported in the literature. For example, many research studies have already shown that ‘core–shell’-like composite particles with silver nanoparticles on their surface exhibit the Coulomb-blockade effect in polymer dielectric composites, resulting in low tan
δ of the composites.38 The similar phenomena have also been reported in the literature. For example, many research studies have already shown that ‘core–shell’-like composite particles with silver nanoparticles on their surface exhibit the Coulomb-blockade effect in polymer dielectric composites, resulting in low tan![[thin space (1/6-em)]](https://www.rsc.org/images/entities/char_2009.gif) δ and high Ebd.39–42 The construction of multiple interfaces in the PVDF/PPy@BTOH composite can be further confirmed by the variations of the thermal conductivities of the composite samples as shown in Fig. S6.† At all compositions, the PVDF/PPy@BTOH composite samples show lower thermal conductivities compared with the PVDF/PPy@BT composites, which can be attributed to the presence of multiple interfaces with a rough surface, increasing the scattering degree of phonons.
δ and high Ebd.39–42 The construction of multiple interfaces in the PVDF/PPy@BTOH composite can be further confirmed by the variations of the thermal conductivities of the composite samples as shown in Fig. S6.† At all compositions, the PVDF/PPy@BTOH composite samples show lower thermal conductivities compared with the PVDF/PPy@BT composites, which can be attributed to the presence of multiple interfaces with a rough surface, increasing the scattering degree of phonons.
The above results clearly show that decorating BTOH particles with PPy nanoparticles is an alternative way to fabricate dielectric composites with promising dielectric properties. However, there are still some problems that need to be further clarified in future work. First, more work should be carried out to tailor the content of hydroxyl groups on the surface of BT so that the decoration of the surface of BTOH with PPy nanoparticles can be further tailored. Second, it is not clear how the weight ratio of PPy and BTOH influences the dielectric properties of the composites. Third, it is well known that the conductive properties of the PPy nanoparticles are also influenced by the polymerization process, such as the type and content of dopants. Therefore, it is interesting to ask whether or not the dielectric properties of the composites can be well tailored through tailoring the conductivity of the PPy nanoparticles. Further work is being carried out in our group to clarify the above questions.
4. Conclusions
In summary, with the aid of hydroxyl groups, conductive PPy nanoparticles are successfully decorated onto BTOH particles and the PPy@BTOH composite particles show a rough surface with a ‘mulberry-like’ morphology. Different from the PVDF/PPy@BT composites, in which most of the PPy nanoparticles dissociatively disperse in the PVDF matrix, most of the PPy nanoparticles in the PVDF/PPy@BTOH composites still adhere to the surface of the BTOH. The different dispersion states of the composite particles endow the composites with different electrical conductivities at high particle content. Compared with the PVDF/PPy@BT composite samples, the PVDF/PPy@BTOH composite samples show largely enhanced ε′, greatly suppressed tan![[thin space (1/6-em)]](https://www.rsc.org/images/entities/char_2009.gif) δ and simultaneously enhanced Ebd. The formation of multiple interfaces and the superposition of interfacial polarization are suggested to be the main reason for the excellent dielectric properties of the PVDF/PPy@BTOH composites. This work confirms that assembling conductive polymer nanoparticles on insulating dielectric ceramics is an efficient way to prepare dielectric composites with excellent comprehensive dielectric properties.
δ and simultaneously enhanced Ebd. The formation of multiple interfaces and the superposition of interfacial polarization are suggested to be the main reason for the excellent dielectric properties of the PVDF/PPy@BTOH composites. This work confirms that assembling conductive polymer nanoparticles on insulating dielectric ceramics is an efficient way to prepare dielectric composites with excellent comprehensive dielectric properties.
Conflicts of interest
There are no conflicts to declare.Acknowledgements
This work was financially supported by the National Natural Science Foundation of China (51673159), the Key Research and Development Program of Sichuan Province (2017GZ0409), the International Science and Technology Cooperation Project of Sichuan Province (2017HH0066), the International Science and Technology Cooperation Project of Chengdu (2016-GH02-00097-HZ), and the Fundamental Research Funds for the Central Universities (2682019JQ04). SEM and TEM characterizations were supported by the Analytical and Testing Center of Southwest Jiaotong University.References
- Y. N. Hao, X. H. Wang, S. O'Brien, J. Lombardi and L. T. Li, J. Mater. Chem. C, 2015, 3, 9740–9747 RSC
.
- V. Hornebecq, C. Huber, M. Maglione, M. Antonietti and C. Elissalde, Adv. Funct. Mater., 2010, 14, 899–904 CrossRef
.
- X. Y. Huang, C. Y. Zhi, P. K. Jiang, D. Golberg, Y. Bando and T. Tanaka, Adv. Funct. Mater., 2013, 23, 1824–1831 CrossRef CAS
.
- J. Venkatesh, V. Sherman and N. Setter, J. Am. Ceram. Soc., 2010, 88, 3397–3404 CrossRef
.
- Y. F. Feng, B. Miao, H. H. Gong, Y. C. Xie, X. Y. Wei and Z. C. Zhang, ACS Appl. Mater. Interfaces, 2016, 8, 19054–19065 CrossRef CAS PubMed
.
- A. Chaipanich, Curr. Appl. Phys., 2007, 7, 537–539 CrossRef
.
- M. F. Lin and P. S. Lee, J. Mater. Chem. A, 2013, 1, 14455–14459 RSC
.
- H. Z. Guo, Y. Mudryk, M. I. Ahmad, X. C. Pang, L. Zhao, M. Akinc, V. K. Pecharsky, N. Bowler, Z. Q. Lin and X. Tan, J. Mater. Chem., 2012, 22, 23944–23951 CAS
.
- S. Roberts, Phys. Rev., 1947, 71, 890–895 CrossRef CAS
.
- E. S. Beh, S. A. Basun, X. F. Feng, I. U. Idehenre, D. R. Evansb and M. W. Kanan, Chem. Sci., 2017, 8, 2790–2794 RSC
.
- M. F. Lin, V. K. Thakur, E. J. Tan and P. S. Lee, RSC Adv., 2011, 1, 827–836 Search PubMed
.
- Z. M. Dang, H. P. Xu and H. Y. Wang, Appl. Phys. Lett., 2007, 90, 3804 Search PubMed
.
- J. Li, J. Claude, L. E. Norena-Franco and S. Q. Sang, Chem. Mater., 2016, 20, 6304–6306 CrossRef
.
- H. M. Jung, J. H. Kang, S. Y. Yang, J. C. Won and S. K. Yong, Chem. Mater., 2010, 22, 450–456 CrossRef CAS
.
- L. Y. Xie, X. Y. Huang, B. W. Li, C. Y. Zhi, T. Tanaka and P. K. Jiang, Phys. Chem. Chem. Phys., 2013, 15, 17560–17569 RSC
.
- B. Balasubramanian, K. L. Kraemer, N. A. Reding, R. Skomski, S. Ducharme and D. J. Sellmyer, ACS Nano, 2010, 4, 1893–1900 CrossRef CAS PubMed
.
- R. W. Sillars, J. Inst. Electr. Eng., 2010, 80, 378–394 Search PubMed
.
- L. Y. Xie, X. Y. Huang, Y. H. Huang, K. Yang and P. K. Jiang, J. Phys. Chem. C, 2013, 117, 22525–22537 CrossRef CAS
.
- J. H. Yang, X. Xie, Z. Z. He, Y. Lu, X. D. Qi and Y. Wang, Chem. Eng. J., 2019, 355, 137–149 CrossRef CAS
.
- S. B. Luo, S. H. Yu, R. Sun and C. P. Wong, ACS Appl. Mater. Interfaces, 2014, 6, 176–182 CrossRef CAS PubMed
.
- M. D. Smith, L. Pedesseau, M. Kepenekian, I. C. Smith, C. L. Katan, J. Even and H. I. Karunadasa, Chem. Sci., 2017, 8, 1960–1968 RSC
.
- T. Zhou, J. W. Zha, R. Y. Cui, B. H. Fan, J. K. Yuan and Z. M. Dang, ACS Appl. Mater. Interfaces, 2011, 3, 2184–2188 CrossRef CAS PubMed
.
- C. Madakbas, K. M. Vezir and K. Esmer, Chem. Pap., 2013, 67, 1048–1053 Search PubMed
.
- Z. Z. He, X. Yu, J. H. Yang, N. Zhang, T. Huang, Y. Wang and Z. W. Zhou, Composites, Part A, 2018, 104, 89–100 CrossRef CAS
.
- A. Salimi and A. A. Yousefi, Polym. Test., 2003, 22, 699–704 CrossRef CAS
.
- R. Gregorio and E. M. Ueno, J. Mater. Sci., 1999, 34, 4489–4500 CrossRef CAS
.
- M. D. Migahed, M. Ishra, T. Fahmy and A. Barakat, J. Phys. Chem. Solids, 2004, 65, 1121–1125 CrossRef CAS
.
- B. H. Fan, F. Bedoui, S. Weigand and J. B. Bai, J. Phys. Chem. C, 2016, 120, 9511–9519 CrossRef CAS
.
- K. Yu, Y. J. Niu, Y. Y. Bai, Y. C. Zhou and H. Wang, Appl. Phys. Lett., 2013, 102, 102903 CrossRef
.
- D. L. He, Y. Wang, X. Q. Chen and Y. Deng, Composites, Part A, 2017, 93, 137–143 CrossRef CAS
.
- X. Y. Huo, W. P. Li, J. J. Zhu, L. L. Li, Y. Li, L. H. Luo and Y. J. Zhu, J. Phys. Chem. C, 2015, 119, 25786–25791 CrossRef CAS
.
- M. F. Lin, V. K. Thakur, E. J. Tanb and P. S. Lee, RSC Adv., 2011, 1, 576–578 RSC
.
- Y. H. Li, J. J. Yuan, J. Xue, F. Y. Cai, F. Chen and Q. Fu, Compos. Sci. Technol., 2015, 118, 198–206 CrossRef CAS
.
- V. Tomer, E. Manias and C. A. Randall, J. Appl. Phys., 2011, 110, 044107 CrossRef
.
- R. C. Smith, C. C. Liang, M. Landry, J. K. Nelson and L. S. Schadler, IEEE Trans. Dielectr. Electr. Insul., 2008, 15, 187–196 CAS
.
- V. S. Puli, M. Ejaz, R. Elupula, M. Kothakonda, S. Adireddy, R. S. Katiyar, S. M. Grayson and D. B. Chrisey, Polymer, 2016, 105, 35–42 CrossRef CAS
.
- K. Yang, X. Y. Huang, L. Y. Xie, C. Wu, P. K. Jiang and T. Tanaka, Macromol. Rapid Commun., 2012, 33, 1921–1926 CrossRef CAS PubMed
.
- S. Y. Huang, N. Fukata, M. Shimizu, T. Yamaguchi, T. Sekiguchi and K. Ishibashi, Appl. Phys. Lett., 2008, 92, 213110 CrossRef
.
- L. Y. Xie, X. Y. Huang, Y. H. Huang, K. Yang and P. K. Jiang, ACS Appl. Mater. Interfaces, 2013, 55, 1747–1756 CrossRef PubMed
.
- K. S. Deepa, M. S. Gopika and J. James, Compos. Sci. Technol., 2013, 78, 18–23 CrossRef CAS
.
- K. Yang, X. Y. Huang, J. L. He and P. K. Jiang, Adv. Mater. Interfaces, 2015, 2, 1500361 CrossRef
.
- D. Yang, S. Huang, M. N. Ruan, Y. B. Wu, S. X. Li, H. Wang, J. Y. Zhang, H. N. Ma, W. L. Guo and L. Q. Zhang, J. Mater. Chem. C, 2017, 5, 7759–7767 RSC
.
Footnote |
| † Electronic supplementary information (ESI) available. See DOI: 10.1039/c9sc01965k |
| This journal is © The Royal Society of Chemistry 2019 |

