 Open Access Article
Multifunctional pyrazoline based AIEgens: real-time tracking and specific protein “fishing” of lipid droplets†
Na
Zhao
 *,
Yan
Li‡
,
Weiyao
Yang‡
,
Jiabao
Zhuang
,
Yue
Li
and
Nan
Li
 *
*
Key Laboratory of Macromolecular Science of Shaanxi Province, Key Laboratory of Applied Surface and Colloid Chemistry of Ministry of Education, School of Chemistry & Chemical Engineering, Shaanxi Normal University, 710119 Xi'an, China. E-mail: nzhao@snnu.edu.cn; nli@snnu.edu.cn
First published on 5th August 2019
Abstract
Despite the rapid development of organic fluorescent probes for bioimaging and biosensing applications, construction of advanced probes with multiple biological functions by precisely integrating different functionalized elements into a single molecule has rarely been reported. In this contribution, a series of multifunctional pyrazoline based fluorescent probes (Pyr-n, n = 1–5) were designed and synthesized by introducing different aromatic moieties into the pyrazoline core. All Pyr probes exhibited the aggregation-induced emission effect. Thanks to the excellent biocompatibility and suitable lipophilicity, the Pyr probes can stain the lipid droplets (LDs) in living cells with high specificity as well as track the lipid metabolism in Zebrafish embryos. The protonation–deprotonation capability of the diethylamino group enables Pyr-5 to reversibly migrate between LDs and mitochondria, and real-time monitor the intracellular pH change in dual-color mode. The mild reaction between the pentafluorophenyl unit and thiol group makes Pyr probes the ideal probes to “fish out” the proteins associated with LDs in living cells.
Introduction
Lipid droplets (LDs), ubiquitous lipid-rich organelles that exist in fungi, plants and animals, play crucial roles in diverse biological processes.1 It has been shown that LDs regulate the cellular energy storage between surplus and starvation to provide cells a competitive evolutionary advantage.2 By generating phospholipids and sterols from catabolism or mobilization of lipids, LDs involve in membrane biosynthesis.3 Using their buffering capacity, LDs protect cells from endoplasmic reticulum stress under excessive amounts of lipids and eventually protect cells against apoptosis or necrosis.4 Meanwhile, LDs participate in the progress of several human diseases from diabetes, cardiovascular diseases to hepatic steatosis, neurodegeneration, and cancers by controlling the lipid homeostasis.5 LDs also serve as the sites of storage and metabolism of specific proteins.6–8 For example, by temporarily storing histones, LDs could support the rapid development of Drosophila and Zebrafish embryos. By rerouting the peptides or proteins derived from phagocytosed materials, LDs involve in the process of antigen expression from immune cells to T cells. Considering the important biological roles of LDs, tracing their dynamic functions is of prime importance.The progress of fluorescence techniques stimulated the principle, design and synthesis of fluorescent probes with capabilities to specifically stain subcellular organelles.9 In particular, some novel fluorescent probes for LD imaging have been developed, such as commercial probes BODIPY493/503 and Nile red.10,11 However, non-specific binding and low signal-to-noise ratio (SNR) resulting from the aggregation-caused quenching effect severely limited the application scope of these conventional probes.12 The emergence of luminogens with aggregation-induced emission characteristics (AIEgens) provides the optimal choice to overcome the drawbacks of traditional fluorescent probes.13 Benefiting from their “light-up” properties that arise from the restriction of intramolecular rotation, AIEgens allow staining of subcellular organelles with high brightness, and have superior photostability, background-free imaging ability and wide range concentration tolerance.14 Some elegant AIEgens that are favourable for staining LDs have been developed, such as TPE-AmAl,15 AIP,16 NAP,17 and triphenyl amino based probes.18 Nevertheless, it should be noted that most of the LD specific AIEgens solely focus on staining, and design and construction of simple AIEgens with advanced biological functionalities for tracking the dynamics, metabolism and functionalities of LDs is still rare.
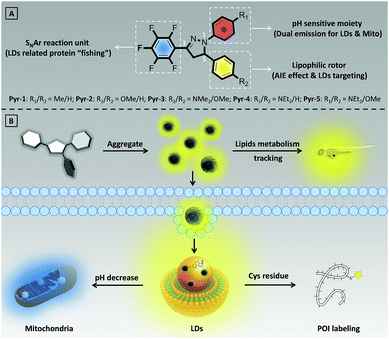
Herein, we have developed a series of multifunctional fluorescent probes (Pyr-1 to Pyr-5) by integrating the pyrazoline core with different functionalized moieties (Scheme 1). The resulting Pyr probes exhibited unique AIE characteristics, large Stokes shifts and tunable emission. The excellent biocompatibility as well as suitable lipophilicity with high Clog![[thin space (1/6-em)]](https://www.rsc.org/images/entities/char_2009.gif) P values enabled these Pyr probes to display superior LD staining ability in living cells and track the lipid metabolism in Zebrafish embryos. Benefiting from the protonation of the diethylamino group under acidic conditions, Pyr-5 could reversibly migrate between LDs and mitochondria with dual emission color by precisely responding to the intracellular pH changes within narrow acid–base transition. Moreover, taking advantage of mild reaction conditions between the pentafluorophenyl unit and thiol group, Pyr probes could serve as ideal probes to “fish out” the proteins associated with LDs in living cells.
P values enabled these Pyr probes to display superior LD staining ability in living cells and track the lipid metabolism in Zebrafish embryos. Benefiting from the protonation of the diethylamino group under acidic conditions, Pyr-5 could reversibly migrate between LDs and mitochondria with dual emission color by precisely responding to the intracellular pH changes within narrow acid–base transition. Moreover, taking advantage of mild reaction conditions between the pentafluorophenyl unit and thiol group, Pyr probes could serve as ideal probes to “fish out” the proteins associated with LDs in living cells.
Results and discussion
Synthesis and optical properties
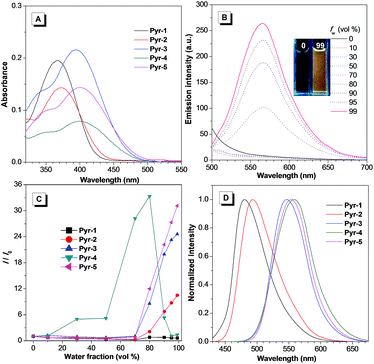
The synthetic routes to Pyr probes are shown in Scheme S1 and S2.† By adapting the convergent “photo-click” reaction of pentafluorophenyl substituted tetrazoles and styrene derivatives,19 the pyrazoline based compounds (Pyr-1 to Pyr-5) were facilely obtained with reasonable yield. All Pyr probes were fully characterized by NMR spectroscopy and high-resolution mass spectroscopy, and the data were in good agreement with the target structures.The UV-Vis spectra of Pyr probes were studied at the initial stage. As illustrated in Fig. 1A and Table 1, the longest absorption peaks of Pyr-1 to Pyr-5 in acetonitrile varied from 367 to 402 nm, which is probably attributed to the intramolecular charge transfer (ICT) transition from the electron donating part to the electron deficient unit.20 The red-shifted absorption peaks from Pyr-1 to Pyr-5 could be caused by the increase of electron donating ability from the 4-methylphenyl to the 4-diethylaminophenyl group. When the solutions of Pyr probes were photoexcited, faint or moderate photoluminescence was observed. However, increasing the water fractions (fw) of mixed solutions enhanced their emission intensity (Fig. 1B and S1†). By taking Pyr-5 as an example, the fluorescence intensity remained at a low level when the fw was less than 70%, and a continuous increase of fw led to the emission “light-up” and the emission intensity at 565 nm reached the maximum at an fw of 99% with an approximately 30-fold enhancement compared to that in the solution state (Fig. 1C), demonstrating its typical AIE effect. The existence of nanoaggregates at an fw of 99% was further confirmed by the measurement of dynamic light scattering (Fig. S2†). It is worth mentioning that the emission intensity of Pyr-4 dropped when the fw was more than 80%, which could be ascribed to the change of morphology and size of nanoaggregates at higher fw.17 Importantly, all Pyr probes exhibited a large Stokes shift (>133 nm), which shows great advantage for bio-imaging applications due to the reduction of self-absorption. Moreover, the solid-state emission of Pyr-1 to Pyr-5 was tuned from 480 to 558 nm with higher fluorescence quantum yields (Φf, 5.7–45.2%) than those in the solution state (0.3–34.8%), which further proved their AIE feature.
| Comp. | Solutiona | Solidb | |||||
|---|---|---|---|---|---|---|---|
| λ abs [nm] | λ em [nm] | Φ f (%) | τ avg [ns] | λ em [nm] | Φ f (%) | τ avg [ns] | |
| a In acetonitrile (10 μM). b In the solid state. c Absolute fluorescence quantum yield measured using a calibrated integrating sphere system. d Mean fluorescence lifetime (τavg) calculated using the equation τavg = A1τ1 + A2τ2. | |||||||
| Pyr-1 | 367 | 500 | 34.8 | 1.96 | 480 | 43.3 | 2.69 |
| Pyr-2 | 373 | 529 | 6.9 | 1.14 | 494 | 45.2 | 3.91 |
| Pyr-3 | 395 | 560 | 0.6 | 1.26 | 546 | 19.2 | 2.19 |
| Pyr-4 | 402 | 562 | 1.3 | 2.26 | 558 | 5.7 | 2.31 |
| Pyr-5 | 402 | 565 | 0.3 | 1.83 | 555 | 9.3 | 2.14 |
The fluorescence lifetimes of all Pyr probes both in the solid (2.19–3.91 ns) and solution (1.14–2.26 ns) states were also measured (Table 1). The rate constants for radiative (kr) and non-radiative decay (knr) of Pyr probes in different states were calculated based on the fluorescence lifetimes and quantum yields (Table S1†). Taking Pyr-5 as an example, the kr was 1.639 × 10⁶ s−1 in the solution state, which was less than the knr value (5.448 × 10⁸ s−1). However, the kr increased to 4.346 × 10⁷ s−1 whereas the knr decreased slightly to 4.238 × 10⁸ s−1 in the solid state. These results implied that suppression of the non-radiative decay was responsible for the enhanced emission in the solid state.
Crystal analysis and theoretical calculation
The single crystal structures of these Pyr probes were thoroughly investigated in order to explain the origination of their emission properties from the aspects of molecular conformations and crystal packing modes. To our delight, the single crystals of Pyr-1, Pyr-2 and Pyr-4 were successfully obtained by slowly evaporating mixtures of tetrahydrofuran/n-hexane or dichloromethane/n-hexane containing the probes at room temperature (Table S2†). As shown in Fig. 2, all crystals adopted a non-planar configuration and the torsion angles between the pyrazoline core and the substituted groups at position 1 were 13.52, 11.57 and 4.62° in the order from Pyr-1, Pyr-2 to Pyr-4, respectively. Additionally, the torsion angles between the pentafluorophenyl group at position 3 and the central pyrazoline ring were 13.57, 8.15 and 0.29° from Pyr-1, Pyr-2 to Pyr-4, respectively. It is noteworthy that the torsion angles varied from 70.87, 98.10 to 73.21° (Pyr-1, Pyr-2 to Pyr-4) between phenyl rings at position 5 and the pyrazoline part, which turned the whole molecule into an extremely distorted conformation. All crystals stacked in the form of an offset head-to-tail arrangement while the distances between neighbouring molecules range from 4.096 to 6.503 Å, indicating the absence of π−π stacking interaction. Moreover, multiple intermolecular interactions such as C–H⋯F (2.505, 2.560, 2.569 and 2.635 Å) and C–H⋯O (2.602 Å) were observed within crystal lattices (Fig. S3†), which could help the excited molecules to overcome the non-radiative decay and give intense emission in the condensed state.21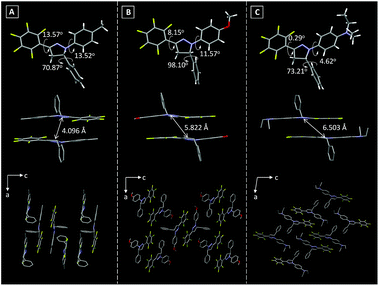 | ||
| Fig. 2 Torsion angles, distances between neighboring molecules and crystal packing modes of (A) Pyr-1, (B) Pyr-2 and (C) Pyr-4. | ||
To provide further insight into the relationship between the electronic transitions and special optical behaviour, the ground-state molecular orbital geometries of Pyr probes were optimized using the density functional theory (DFT) method at the B3LYP/6-31G basis set (Fig. 3). The calculation results revealed that the highest occupied molecular orbital (HOMO) was primarily delocalized on the aromatic substitutes at position 1 and the central pyrazoline ring, while the lowest unoccupied molecular orbital (LUMO) is mainly distributed over the pentafluorophenyl unit at position 3 as well as the pyrazoline core. The separated frontier orbitals suggested the existence of the ICT process in Pyr probes. It is noteworthy that no electron cloud distribution was observed for the aromatic rings at position 5 because of their non-participation in molecular conjugation. Meanwhile, as the electron-donating abilities increased in the order from Pyr-1 to Pyr-5, the energy levels of the LUMO varied from −0.30 to −0.12 while the energy levels of the HOMO increased from −6.40 to −5.65 eV. The energy gaps between the HOMO and LUMO were calculated from 6.10 to 5.53 eV (Pyr-1 to Pyr-5). The better orbital separation degree and reduced energy gap resulted in the red-shifted absorption bands from Pyr-1 to Pyr-5.
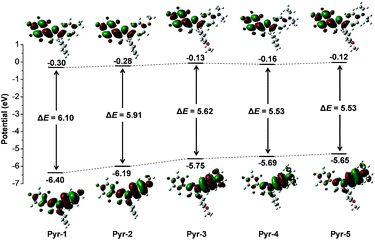 | ||
| Fig. 3 Molecular orbital amplitude plots of HOMO and LUMO energy levels of Pyr probes calculated by using the DFT method at the 3LYP/6-31G (d,p) basis set. | ||
LD imaging and lipid metabolism tracking
Considering the hydrophobic characteristic of Pyr probes and the lipophilic environment within LDs, we anticipated that the Pyr probes could be used for LD-targeted imaging. The cell viability studies were carried out at first by using the 3-(4,5-dimethyl-2-thiazolyl)-2,5-diphenyltetrazolium bromide (MTT) assay. As shown in Fig. S4,† after incubating either cancer cells (HeLa cells) or normal cells (CHO cells) with Pyr probes (Pyr-1, Pyr-2 and Pyr-5) over a concentration range from 100 nM to 10 μM, negligible cell toxicity was observed, suggesting their good biocompatibility. The cellular uptake and localization of Pyr probes were checked using confocal laser scanning microscopy (CLSM). By incubating HeLa cells with Pyr-1 for 30 min, the probe could successfully penetrate the cell membrane and accumulate in the LDs with blue emission (Fig. S5†). To elucidate exactly the localization of Pyr probes in the LDs, HeLa cells were co-stained with Pyr probes and the commercial LD-targeting marker HCS LipidTOX™ Deep Red Neutral Lipid Stain. As displayed in Fig. 4, the merged images indicated that the location of Pyr probes in cells was well consistent with that of the HCS LipidTOX™ Deep Red Neutral Lipid Stain. The Pearson's coefficients were calculated up to 0.94, 0.94 and 0.96 for Pyr-1, Pyr-2 and Pyr-5, respectively. Similar specific LD-targeted images were obtained when the CHO cells were treated with Pyr probes (Fig. S6†), manifesting that Pyr probes can selectively stain the LDs in living cells.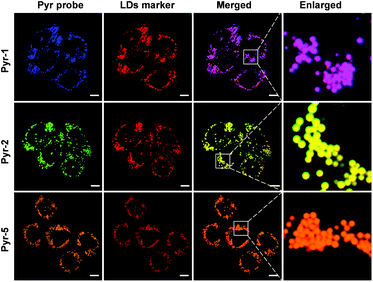 | ||
Fig. 4 Co-localization CLSM images of HeLa cells stained with Pyr probes (500 nM) and HCS LipidTOX™ Deep Red Neutral Lipid Stain (1![[thin space (1/6-em)]](https://www.rsc.org/images/entities/char_2009.gif) : :![[thin space (1/6-em)]](https://www.rsc.org/images/entities/char_2009.gif) 1000 dilution). Scale bar: 10 μm. 1000 dilution). Scale bar: 10 μm. | ||
To provide explanation for the high specificity of Pyr probes to LDs, their Clog![[thin space (1/6-em)]](https://www.rsc.org/images/entities/char_2009.gif) P values were calculated. Clog
P values were calculated. Clog![[thin space (1/6-em)]](https://www.rsc.org/images/entities/char_2009.gif) P is defined as the calculated log
P is defined as the calculated log![[thin space (1/6-em)]](https://www.rsc.org/images/entities/char_2009.gif) P (n-octanol/water partition coefficient) value and the probes with Clog
P (n-octanol/water partition coefficient) value and the probes with Clog![[thin space (1/6-em)]](https://www.rsc.org/images/entities/char_2009.gif) P > 5 are usually considered to specifically stain LDs.17,22 As shown in Fig. 5A, the Pyr probes displayed Clog
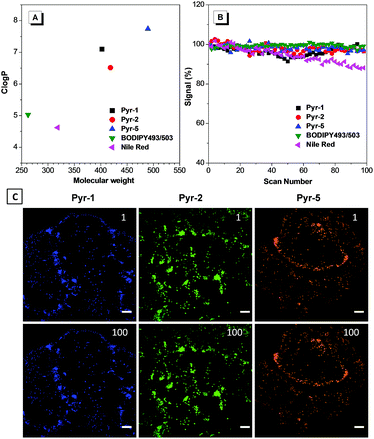
P > 5 are usually considered to specifically stain LDs.17,22 As shown in Fig. 5A, the Pyr probes displayed Clog![[thin space (1/6-em)]](https://www.rsc.org/images/entities/char_2009.gif) P values between 6.516 and 7.820, which were much higher than those of commercial probes BODIPY493/503 (5.028) and Nile red (4.618), and resulted in their selective localization in LDs.
P values between 6.516 and 7.820, which were much higher than those of commercial probes BODIPY493/503 (5.028) and Nile red (4.618), and resulted in their selective localization in LDs.
Besides their excellent biocompatibility and specificity properties, we further evaluated the photostability of these Pyr probes, since superior photostability is always critical for high resolution 3D imaging and time-resolved studies. To our delight, after 100 scans, the fluorescence intensity of Pyr probes remained over 95% (Fig. 5B and C), demonstrating that they possess higher resistance to photobleaching.
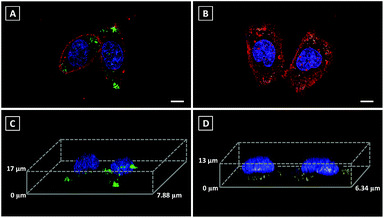
3D imaging is a powerful tool to track the dynamics and functions of subcellular organelles. Generally, 3D imaging is obtained by the reconstruction of multiple Z-stack images, which involves several laser scans of the sample. Therefore, a qualified fluorescent probe capable of giving high resolution 3D images is required to emit more photons before photobleaching than 2D imaging and also without sacrificing lateral resolution. However, commercial fluorescent probes always result in non-specific staining, which leads to the mixed signals of both specific fluorescent response and non-specific background noise, further limiting their ability in 3D imaging. Since Pyr probes displayed high brightness as well as excellent photostability, Pyr-2 and Pyr-5 were adopted for 3D imaging of LDs in living cells. Prior to imaging, the nucleus, LDs and cell plasma membrane were stained with Hoechst 33342, Pyr probes and DiD perchlorate, respectively. Then, 18 μm Z-stacking for Pyr-2 (14 μm Z-stacking for Pyr-5) was performed using 1 μm steps, representing 18 (or 14) scans per image. The 3D images exhibited clear and bright green (yellow) spots (Fig. 6), which revealed the great 3D imaging capability of Pyr probes for subcellular LD localization in HeLa cells.
Another key feature for a qualified subcellular organelle fluorescent tracker is wash-free imaging capability, because the wash-free manner can significantly simplify the bioimaging procedure and avoid interference from the cell morphology during the cell washing process. In view of the AIE characteristics of these Pyr probes, their wash-free staining ability was evaluated. HeLa cells were treated with Pyr probes, BODIPY493/503 or Nile red for 30 min and their fluorescent images were then collected directly (Fig. 7). The resulting images revealed that even without washing, the LDs can be successfully stained by Pyr probes with excellent image contrast as well as negligible background fluorescence. In sharp contrast, the cell images obtained by incubation with BODIPY493/503 or Nile red without washing exhibited strong fluorescent signals in the whole cell area. The wash-free imaging ability of Pyr probes with high SNR could be originating from their suitable lipophilicity nature as well as unique AIE characteristics. By virtue of the wash-free imaging ability of Pyr probes, a time-dependent staining was facilely achieved. As shown in Fig. S7,† after mixing the cell culture with Pyr probes at 37 °C for 5 min, the LDs could be visualized for Pyr-5. Upon prolonging the incubation time to 15 min, all Pyr probes gave fluorescent signals from LDs, illustrative of their fast staining ability for LDs.
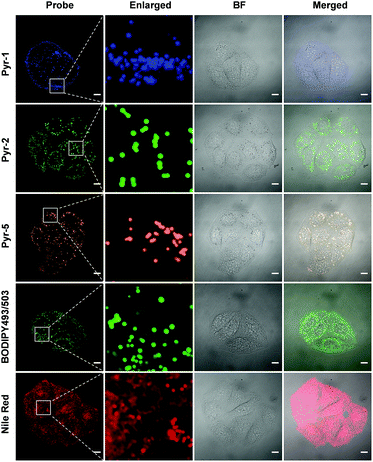 | ||
| Fig. 7 CLSM images of HeLa cells stained with Pyr probes (500 nM), BODIPY493/503 (500 nM) and Nile red (500 nM) in the absence of the washing procedure. Scale bar: 10 μm. | ||
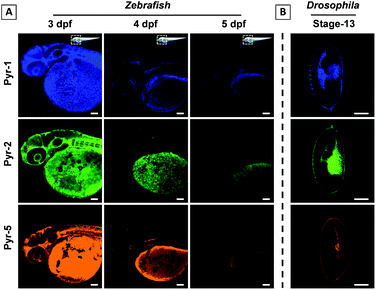
Zebrafish and Drosophila embryos are two kinds of ideal candidates to study lipid dynamics as well as lipid-related diseases, such as diabetes, atherosclerosis and obesity.7,23 The superior LD staining capabilities of Pyr probes inspired us to explore their application in the tracking of lipid metabolism in living Zebrafish and staining of Drosophila embryos. 3 day post fertilization (dpf) Zebrafish embryos were incubated with Pyr probes in embryo media for 30 min at 28 °C and the images of Zebrafish embryos were collected using CLSM (Fig. 8A and S9–S11†). Intense fluorescent signals mainly located in the yolk sac were observed. As the embryonic yolk zone is the sole energy supplier for larval development within the first week by storing most of the neutral lipids and phospholipids, the above results proved the ability of Pyr probes to stain the yolk lipids. With the absorption of the yolk sac (from 3 dpf to 5 dpf), the fluorescence intensity of Pyr probes decreased gradually, which was consistent with the development of the yolk sac. The results showed that the Pyr probes could be used as a probe for tracking the lipid metabolism in living vertebrate organisms. Meanwhile, during the process of imaging, no Zebrafish death was observed, suggesting the good biocompatibility of Pyr probes. Similar specific staining of lipids was obtained when the fixed Drosophila embryos (stage-13) were employed (Fig. 8B and S12†).
Real-time monitoring of the intracellular pH in dual-color mode
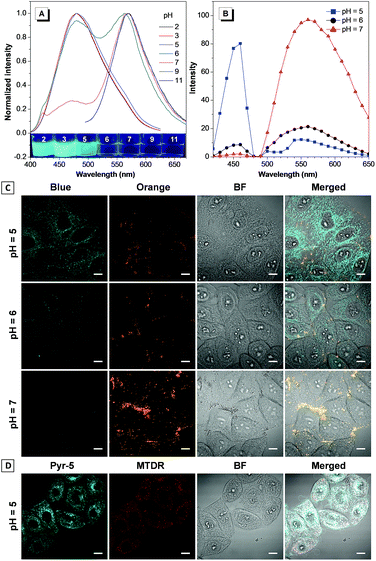
The reversed transmembrane pH gradient is a key characteristic of cancer cells, and therefore, development of an intracellular pH indicator becomes particularly important for convenient histopathological analysis.24 Since Pyr-5 contains a diethylamino group, we speculated that it may serve as a sensitive pH indicator. As shown in Fig. 9A, Pyr-5 gave orange emission at 565 nm when the pH value was more than 9. Reducing the pH value to 7, a new blue emission at 480 nm emerged, which further became dominant when the pH value was less than 5. This blue-shifted emission was probably due to the reduction of the ICT effect once the diethylamino group of Pyr-5 was protonated. We next evaluated the capability of Pyr-5 for intracellular pH detection, and the cells pre-stained with Pyr-5 were treated with HEPES buffer at different pH values, respectively. As illustrated in Fig. 9C, Pyr-5 presented orange fluorescent signals with the targeting of LDs in living cells at pH 7. However, when the cells were incubated with buffer at pH 6, the orange signals became weak whereas blue fluorescent signals appeared. And the signals from the blue channel became dominant at pH 5. The emission change of Pyr-5 under different intracellular pH conditions was further confirmed by the in situ lambda scan (Fig. 9B). It is noteworthy that the blue fluorescent signals were not located in the LDs. The co-staining experiment with commercial Mito Tracker Deep Red (MTDR) indicated that Pyr-5 mainly accumulated in the mitochondria under pH 5 conditions with the Pearson's coefficient of 0.87 (Fig. 9D). The cationic probes prefer to target the mitochondria through electrostatic interaction because of the negatively charged mitochondrial inner membrane.25 Therefore, the location of Pyr-5 in mitochondria under acidic conditions could be attributed to the conversion of the probe from neutral to cationic nature after the molecule was protonated.We further tested the real-time migration of Pyr-5 between LDs and mitochondria along with the change of intracellular pH. As shown in Fig. 10, intense orange signals from LDs were observed when the Pyr-5 pre-stained cells were incubated with buffer at pH 7. The culture medium was then replaced with buffer at pH 5 and incubated for 15 min; Pyr-5 released from LDs and migrated to mitochondria with strong blue emission. Subsequently, the stained cells were re-treated with buffer at pH 7 for another 15 min, and the orange signals from LDs recovered while the blue fluorescent signals in mitochondria almost disappeared. The above results depicted that Pyr-5 can reversibly monitor the intracellular pH from the aspects of both localization and emission color. To the best of our knowledge, this is the first example that fluorescent probes can migrate between LDs and mitochondria with different emission colors accompanied by a slight intracellular pH change.
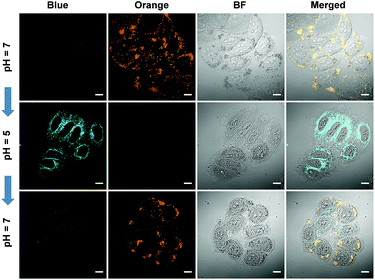 | ||
| Fig. 10 CLSM images of HeLa cells stained by Pyr-5 (10 μM) with in situ adjusting of the intracellular pH value. Scale bar: 10 μm. | ||
LD related protein labeling
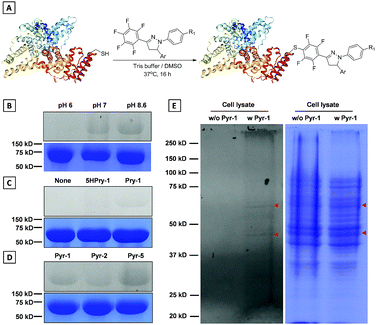
Development of chemical strategies for specific modification of proteins associated with LD dynamics and metabolism would enable a new avenue to precisely identify and regulate LD functions. In view of the reactivity between the pentafluorophenyl unit and thiol group through the nucleophilic aromatic substitution (SNAr) reaction,26Pyr probes would be able to “fish out” the proteins associated with biological processes of LDs in native environments by modifying their cysteine (Cys) residues. To implement this possibility, the model reaction of Pyr probes towards N-acetyl (Ac) cysteine was investigated first (Scheme S3†). The Pyr probes could smoothly react with N-acetyl (Ac) cysteine in DMF/Tris solution at 37 °C for 24 h to generate the desired product with a high yield (>70%). As shown in Fig. S13A and S13B,† absorption and emission wavelengths of the addition product (Pyr-6) between Pyr-1 and N-acetyl (Ac) cysteine red-shifted to 400 and 535 nm in DMSO solution compared to those of Pyr-1 (370 and 510 nm). The reduced energy gap of Pyr-6 (5.74 eV) could be responsible for this red-shift of spectra (Fig. S13C†).The above results encouraged us to examine whether Pyr probes could be employed to modify the Cys residue of protein. Therefore, bovine serum albumin (BSA), which contains one free thiol (Cys34) and 17 conserved disulphide bonds, was selected as the target protein and Pyr-1 was used as the representative labeling probe.27 After incubating BSA with Pyr-1 (50 equiv.) at different pH values (6.0, 7.2 and 8.6) for 16 h, the reaction mixtures were subjected to sodium dodecyl sulphate polyacrylamide gel electrophoresis (SDS-PAGE) followed by in-gel fluorescence analysis (Fig. 11B and S14†). A clear fluorescent band around 66 kDa was detected for the reaction at pH 8.6, while weak (or faint) fluorescent bands were observed for the reactions at pH 7.2 (or 6.0), which was attributed to the reduction of reactivity of Pyr-1 when the pH decreased from 8.6 to 6.0. Control experiments showed that the reaction did not proceed in the absence of Pyr-1. To prove that the pentafluorophenyl unit can specifically react with the Cys-residue, the compound without fluoro substitutes (5HPyr-1) was used to test the labeling reaction at pH 8.6. Gratifyingly, the reaction of 5HPyr-1 with BSA did not give any fluorescent band compared to Pyr-1 (Fig. 11C and S15†). Pyr-2 and Pyr-5 were also reacted with BSA and the results indicated that the Cys-residue of BSA can also be conveniently modified by Pyr probes through the SNAr reaction (Fig. 11D and S16 and S17†). The protein labeling was further proceeded in living cells using Pyr-1 due to its excellently long-term LD targeting (Fig. S8†). After treating cells with Pyr-1 for 48 h, the cells were lysed and the cell lysis was analysed by SDS-PAGE (Fig. 11E and S18); two major fluorescent bands were detected out of multiple other protein bands. However, no fluorescent bands were observed in the absence of Pyr-1, indicating that the proteins associated with LDs were successfully labeled by Pyr-1.
Conclusions
In conclusion, a series of multifunctional pyrazoline based fluorescent probes (Pyr-n, n = 1–5) have been designed and synthesized. The Pyr probes exhibited a specific AIE feature and tunable emission. Taking advantage of their excellent cellular-penetration ability and biocompatibility, Pyr probes can serve as the ideal fluorescent probes for selective LD imaging in living cells. Meanwhile, the tracking of lipid metabolism in Zebrafish embryos as well as staining of Drosophila embryos was successfully achieved by employing Pyr probes. Due to the sensitive pH response, Pyr-5 was able to dynamically and reversibly monitor the intracellular pH through both localization and emission color. In view of the reactivity between the pentafluorophenyl unit and thiol group, the protein with the Cys residue which is associated with LDs in living cells can be selectively “fished out” by Pyr probes. This intriguing strategy provides a rational platform for the construction of advanced multifunctional fluorescent probes for both fundamental and practical applications.Conflicts of interest
There are no conflicts to declare.Acknowledgements
We are grateful for the financial support from the National Natural Science Foundation of China (21672135, 51403122 and 21402115), Natural Science Foundation of Shaanxi Province (2018JM5086), Fundamental Research Funds for the Central Universities (GK201902006 and GK201702002) and Funded Projects for the Academic Leaders and Academic Backbones, Shaanxi Normal University (18QNGG007). We also appreciate Prof. Hui Xiao for kindly providing the Drosophila embryos for this study.Notes and references
- (a) R. V. Farese Jr and T. C. Walther, Cell, 2009, 139, 855–860 CrossRef PubMed; (b) T. C. Walther and R. V. Farese Jr, Annu. Rev. Biochem., 2012, 81, 687–714 CrossRef CAS PubMed; (c) J. A. Olzmann and P. Carvalho, Nat. Rev. Mol. Cell Biol., 2019, 20, 137–155 CrossRef CAS PubMed.
- (a) C. Thiele and J. Spandl, Curr. Opin. Cell Biol., 2008, 20, 378–385 CrossRef CAS PubMed; (b) S. Olofsson, P. Bostrom, L. Andersson, M. Rutberg, J. Perman and J. Boren, Biochim. Biophys. Acta, 2009, 1791, 448–458 CrossRef CAS PubMed; (c) E. Agmon and B. R. Stockwell, Curr. Opin. Chem. Biol., 2017, 39, 83–89 CrossRef CAS PubMed.
- C. Kurat, H. Wolinshi, J. Petschnigg, S. Kaluarachchi, B. Andrews, K. Natter and S. Kohlwein, Mol. Cell, 2009, 33, 53–63 CrossRef CAS PubMed.
- (a) F. R. Maxfield and I. Tabas, Nature, 2005, 438, 612–621 CrossRef CAS PubMed; (b) V. T. Salo and E. Ikonen, Curr. Opin. Cell Biol., 2019, 57, 64–70 CrossRef CAS PubMed.
- (a) Y. Miyanari, K. Atsuzawa, N. Usuda, K. Watashi, T. Hishiki, M. Zayas, R. Bartenschlager, T. Wakita, M. Hijikata and K. Shimotohno, Nat. Cell Biol., 2007, 9, 1089–1097 CrossRef CAS PubMed; (b) J. C. Cohen, J. D. Horton and H. H. Hobbs, Science, 2011, 332, 1519–1523 CrossRef CAS PubMed; (c) A. S. Greenberg, R. A. Coleman, F. B. Kraemer, J. L. McManaman, M. S. Obin, V. Puri, Q. W. Yan, H. Miyoshi and D. G. Mashek, J. Clin. Invest., 2011, 121, 2102–2110 CrossRef CAS PubMed; (d) L. Liu, K. Zhang, H. Sandoval, S. Yamamoto, M. Jaiswal, E. Sanz, Z. Li, J. Hui, B. H. Graham, A. Quintana and H. J. Bellen, Cell, 2015, 160, 177–190 CrossRef CAS PubMed; (e) N. L. Gluchowski, M. Becuwe, T. C. Walther and R. V. Farese Jr, Nat. Rev. Gastroenterol. Hepatol., 2017, 14, 343–355 CrossRef CAS PubMed; (f) Y. Sunami, A. Rebelo and J. Kleeff, Cancers, 2018, 10, 3 CrossRef PubMed.
- (a) S. Cermelli, Y. Guo, S. P. Gross and M. A. Welte, Curr. Biol., 2006, 16, 1783–1795 CrossRef CAS PubMed; (b) Y. Guo, T. C. Walther, M. Rao, N. Stuurman, G. Goshima, K. Terayama, J. S. Wong, R. D. Vale, P. Walter and R. V. Farese, Nature, 2008, 453, 657–661 CrossRef CAS PubMed; (c) S. Xu, X. Zhang and P. Liu, Biochim. Biophys. Acta, 2018, 1864, 1968–1983 CrossRef CAS PubMed.
- M. A. Welte, Biochim. Biophys. Acta, 2015, 1851, 1156–1185 CrossRef CAS PubMed.
- (a) W. Cao, R. Ramakrishnan, V. A. Tuyrin, F. Veglia, T. Condamine, A. Amoscato, D. Mohammadyani, J. J. Johnson, L. M. Zhang, J. Klein-Seetharaman, E. Celis, V. E. Kagan and D. J. Gabrilovich, J. Immunol., 2014, 192, 2920–2931 CrossRef CAS PubMed; (b) M. H. den Brok, T. K. Raaijmakers, E. Collado-Camps and G. J. Adema, Trends Immunol., 2018, 39, 380–392 CrossRef CAS PubMed.
- (a) H. Zhu, J. Fan, J. Du and X. J. Peng, Acc. Chem. Res., 2016, 49, 2115–2126 CrossRef CAS PubMed; (b) X. Ma, N. Gong, L. Zhong, J. Sun and X. Liang, Biomaterials, 2016, 97, 10–21 CrossRef CAS PubMed; (c) W. Xu, Z. Zeng, J. H. Jiang, Y. T. Chang and L. Yuan, Angew. Chem., Int. Ed., 2016, 55, 13658–13699 CrossRef CAS PubMed.
- (a) E. E. Spangenburg, S. J. P. Pratt, L. M. Wohlers and R. M. Lovering, J. Biomed. Biotechnol., 2011, 598358 Search PubMed; (b) P. Greenspan, E. P. Mayer and S. D. Fowler, J. Cell Biol., 1985, 100, 965–973 CrossRef CAS PubMed.
- (a) M. Collot, T. K. Fam, P. Ashokkumar, O. Faklaris, T. Galli, L. Danglot and A. S. Klymchenko, J. Am. Chem. Soc., 2018, 140, 5401–5411 CrossRef CAS PubMed; (b) X. J. Zheng, W. C. Zhu, F. Ni, H. Ai, S. L. Gong, X. Zhou, J. L. Sessler and C. L. Yang, Chem. Sci., 2019, 10, 2342–2348 RSC.
- J. Mei, Y. Hong, J. W. Y. Lam, A. Qin, Y. Tang and B. Z. Tang, Adv. Mater., 2014, 26, 5429–5479 CrossRef CAS PubMed.
- (a) J. Luo, Z. Xie, J. W. Y. Lam, L. Cheng, H. Chen, C. Qiu, H. S. Kwok, X. Zhan, Y. Liu, D. Zhu and B. Z. Tang, Chem. Commun., 2001, 1740–1741 RSC; (b) J. Mei, N. L. C. Leung, R. T. K. Kowk, J. W. Y. Lam and B. Z. Tang, Chem. Rev., 2015, 115, 11718–11940 CrossRef CAS PubMed.
- (a) J. Liang, B. Z. Tang and B. Liu, Chem. Soc. Rev., 2015, 44, 2798–2811 RSC; (b) R. T. K. Kwok, C. W. T. Leung, J. W. Y. Lam and B. Z. Tang, Chem. Soc. Rev., 2015, 44, 4228–4238 RSC; (c) D. Ding, K. Li, B. Liu and B. Z. Tang, Acc. Chem. Res., 2013, 46, 2441–2453 CrossRef CAS PubMed.
- E. Wang, E. Zhao, Y. Hong, J. W. Y. Lam and B. Z. Tang, J. Mater. Chem. B, 2014, 2, 2013–2019 RSC.
- L. Shi, K. Li, L. L. Li, S. Y. Chen, M. Y. Li, Q. Zhou, N. Wang and X. Q. Yu, Chem. Sci., 2018, 9, 8969–8974 RSC.
- G. Niu, R. Zhang, J. P. C. Kwong, J. W. Y. Lam, C. Chen, J. Wang, Y. Chen, X. Feng, R. T. K. Kwok, H. H. Y. Sung, I. D. Williams, M. R. J. Elsegood, J. Qu, C. Ma, K. S. Wong, X. Q. Yu and B. Z. Tang, Chem. Mater., 2018, 30, 4778–4787 CrossRef CAS.
- (a) D. Wang, H. F. Su, R. T. K. Kwok, G. G. Shan, A. C. S. Leung, M. M. S. Lee, H. H. Y. Sung, I. D. Williams, J. W. Y. Lam and B. Z. Tang, Adv. Funct. Mater., 2017, 27, 1704039 CrossRef; (b) S. Li, X. Ling, Y. Lin, A. Qin, M. Gao and B. Z. Tang, Chem. Sci., 2018, 9, 5730–5735 RSC.
- (a) W. Song, Y. Zhong, J. Qu and Q. Lin, J. Am. Chem. Soc., 2008, 130, 9654–9655 CrossRef CAS PubMed; (b) R. K. V. Lim and Q. Lin, Acc. Chem. Res., 2011, 44, 828–839 CrossRef CAS PubMed.
- J. N. Zhang, H. Kang, N. Li, S. M. Zhou, H. M. Sun, S. W. Yin, N. Zhao and B. Z. Tang, Chem. Sci., 2017, 8, 577–582 RSC.
- S. Xu, T. Liu, Y. Mu, Y. Wang, Z. Chi, C. Lo, S. Liu, Y. Zhang, L. Alan and J. Xu, Angew. Chem., Int. Ed., 2015, 54, 874–878 CrossRef CAS PubMed.
- R. W. Horobin, F. Rashid-Doubell, J. D. Pediani and G. Milligan, Biotech. Histochem., 2013, 88, 440–460 CrossRef CAS PubMed.
- S. Ko, X. Chen, J. Yoon and I. Shin, Chem. Soc. Rev., 2011, 40, 2120–2130 RSC.
- (a) X. Luo, H. T. Yang, H. L. Wang, Z. W. Ye, Z. N. Zhou, L. Y. Gu, J. Q. Chen, Y. Xiao, X. W. Liang, X. H. Qian and Y. J. Yang, Anal. Chem., 2018, 90, 5803–5809 CrossRef CAS PubMed; (b) F. Galindo, M. I. Burguete, L. Vigara, S. V. Luis, N. Kabir, J. Gavrilovic and D. A. Russell, Angew. Chem., Int. Ed., 2005, 44, 6504–6508 CrossRef CAS PubMed; (c) M. H. Lee, J. H. Han, J. H. Lee, N. Park, R. Kumar, C. Kang and J. S. Kim, Angew. Chem., Int. Ed., 2013, 52, 6206–6209 CrossRef CAS PubMed; (d) H. J. Kim, C. H. Heo and H. M. Kim, J. Am. Chem. Soc., 2013, 135, 17969–17977 CrossRef CAS PubMed.
- (a) M. Tian, J. Sun, B. Dong and W. Lin, Angew. Chem., Int. Ed., 2018, 57, 16506–16510 CrossRef CAS PubMed; (b) N. Zhao, P. Li, J. Zhuang, Y. Liu, Y. Xiao, R. Qin and N. Li, ACS Appl. Mater. Interfaces, 2019, 11, 11227–11237 CrossRef CAS PubMed.
- A. M. Embaby, S. Schoffelen, C. Kofoed, M. Meldal and F. Diness, Angew. Chem., Int. Ed., 2018, 57, 8022–8026 CrossRef CAS PubMed.
- K. A. Majorek, P. J. Porebski, A. Dayal, M. D. Zimmerman, K. Jablonska, A. J. Stewart, M. Chruszcz and W. Minor, Mol. Immunol., 2012, 52, 174–182 CrossRef CAS PubMed.
Footnotes |
| † Electronic supplementary information (ESI) available: Synthesis, characterization, optical spectra, crystal data, cytotoxicity and cell imaging. CCDC 1917274, 1917276 and 1917277. For ESI and crystallographic data in CIF or other electronic format see DOI: 10.1039/c9sc03111a |
| ‡ These authors contributed equally to this work. |
| This journal is © The Royal Society of Chemistry 2019 |

