 Open Access Article
Investigation of mixed-metal (oxy)fluorides as a new class of water oxidation electrocatalysts†
Kévin
Lemoine
 a,
Jérôme
Lhoste
 a,
Annie
Hémon-Ribaud
 a,
Nina
Heidary
b,
Vincent
Maisonneuve
 a,
Amandine
Guiet
 *a and
Nikolay
Kornienko
 *b
*b
aInstitut des Molécules et Matériaux du Mans (IMMM), UMR 6283 CNRS, Le Mans Université, Avenue Olivier Messiaen, 72085 Le Mans Cedex 9, France. E-mail: amandine.guiet@univ-lemans.fr
bDepartment of Chemistry, Université de Montréal, Roger-Gaudry Building, Montreal, Quebec H3C 3J7, Canada. E-mail: nikolay.kornienko@umontreal.ca
First published on 10th September 2019
Abstract
The development of electrocatalysts for the oxygen evolution reaction (OER) is one of the principal challenges in the area of renewable energy research. Within this context, mixed-metal oxides have recently emerged as the highest performing OER catalysts. Their structural and compositional modification to further boost their activity is crucial to the wide-spread use of electrolysis technologies. In this work, we investigated a series of mixed-metal F-containing materials as OER catalysts to probe possible benefits of the high electronegativity of fluoride ions. We found that crystalline hydrated fluorides, CoFe2F8(H2O)2 and NiFe2F8(H2O)2, and amorphous oxyfluorides, NiFe2F4.4O1.8 and CoFe2F6.6O0.7, feature excellent activity (overpotential for 10 mA cm−2 as low as 270 mV) and stability (extended performance for >250 hours with ∼40 mV activity loss) for the OER in alkaline electrolyte. Subsequent electroanalytical and spectroscopic characterization hinted that the electronic structure modulation conferred by the fluoride ions aided their reactivity. Finally, the best catalyst of the set, NiFe2F4.4O1.8, was applied as anode in an electrolyzer comprised solely of earth-abundant materials, which carried out overall water splitting at 1.65 V at 10 mA cm−2.
1 Introduction
The rapidly growing consumption of fossil fuels to meet the expanding energy demands of today's society is leading to negative consequences to the environment.1,2 Global warming, ocean acidification, extreme weather events and low air quality are emerging problems. To mitigate further environmental changes, fossil fuels may be replaced by alternative energy sources. Such sources include wind, hydro, and solar power, and their conversion to electrical power is being developed. However, renewable sources are typically intermittent, presenting an obstacle for their widespread use. As such, the conversion of renewable electricity to energy-dense fuels and value-added chemicals is important to increase the penetration of renewables in the market.A key technology within this context is the electrolysis of H2O and/or CO2 into H2 and C-containing fuels. These reduction reactions are balanced by the oxidation of H2O into O2 and, as such, the continual development of highly active, cost efficient and stable oxygen evolution reaction (OER) catalysts is important to render this technology economically viable. The majority of efforts in recent years have focused on metal-oxide OER catalysts as alternatives to Ir and Ru oxides that were traditionally used.3 The highest performing class of these OER catalysts is often iron based oxides/oxyhydroxides containing Ni or Co, and in select cases, these 3d metal oxides outperform the precious metal standards.4,5 The presence of strain,6 defects,7,8 and dopants9 as well as exfoliation10 and an amorphous structure11 have been shown to further boost the performance of metal oxides. We point the interested reader to several recent reviews and perspectives on metal-oxide OER catalysts.12–17
The utilization of inductive effects in electrocatalysis is an effective method to modulate materials' performance.18–20 Substitution with metals having different electronegativity will induce the tendency to donate or withdraw electron density. In the context of OER, a large number of coordinately unsaturated sites on the catalyst with an electron-deficient configuration would boost water oxidation performance.21–23 Thus, metal fluorides should be promising candidates for high-performance catalysts, given that fluorine is the highest electronegative element and therefore abstract electrons from the neighboring metals. As a consequence, the electronic structure of the transition-metal active sites is modified. However, the poor electronic conductivity of pure metal fluorides MxFy hinders their use as highly efficient electrocatalyst. In this context, the use of oxyfluorides MxOyFz can be a good alternative as they offer a good chemical and thermal stability as well as an enhanced electronic conductivity while preserving key characteristics due to the strong electronegativity of fluorine (3.98 for F vs. 3.44 for O).24 Indeed, oxyfluorides are present in a large range of applications such as ceramic glasses, laser cooling systems, optical amplifiers, and lithium-ion batteries.25,26 Even if the advantages of the introduction of fluorine element in changing the chemical properties and electronic structures have been demonstrated,27 only rare reports were found in the literature on fluorides or oxyfluorides as efficient catalyst for water oxidation.28–33 The lack of studies could be explained by the challenging task to prepare oxyfluorides due to the difficulty to stabilize both fluorine and oxygen anions despite their similar ionic radii (F 1.31 Å, O 1.38 Å). Indeed, the number of iron-based oxyfluoride synthetic methods remains modest in the literature compared to pure oxides and fluorides.27 As fluoride precursors are frequently sensitive to air humidity and can be easily hydrolyzed, especially at high temperatures, iron oxyfluoride FeOF was first synthesized by solid state reaction in a sealed platinum tube at 950 °C for 24 h from a mixture of Fe2O3 and FeF3.34 FeOF was also tempted to be prepared by solid–gas reaction with the F2 through the fluorination of Fe3O4 magnetite at 120 °C but only the formation of an oxyfluoride layer was observed at the surface of nanoparticles.35 In order to avoid the use of pure and sensitive fluoride precursors and toxic F2, the synthesis of iron-based oxyfluorides using hydrated fluoride precursors was developed by Zhu et al.36 The authors succeed to obtain FeOF nanorods using FeF3·3H2O in 1-propanol at 200 °C for 24 h. Other hydrated fluorides precursors such as FeSiF6·6H2O could also be used to obtain FeOxF2−x oxyfluorides through their thermal decomposition between 150 to 300 °C.37 More recently, successive dehydration at 240 °C followed by dehydroxylation at 350 °C of the hydrated iron hydroxyfluoride FeF2.2(OH)0.8·0.33H2O (ref. 38) lead to the successful preparation of a lacunar oxyfluoride with the formulation FeF2.2O0.4□0.4.39
Following this strategy, the preparation of new iron-based hydrated fluorides M2+Fe23+F8(H2O)2 (M = Mn, Co, Ni, Cu) by microwave heating assisted solvothermal synthesis from metal salts, aqueous hydrofluoric acid and methanol as solvent was previously reported.40 These hydrated crystallized phases were further calcinated under ambient air to obtain the corresponding amorphous oxyfluorides. Though those resulting amorphous oxyfluorides were tested as cathode active material in Li-ion batteries, neither a thoroughly study of the morphology and electronic structure of those new amorphous iron-based mixed-metal oxyfluorides nor their viability as OER catalysts have been conducted.
In this paper, we set out to synthesize a series of Ni–Fe and Co–Fe (oxy)fluorides in both their crystalline and amorphous structure. Crystalline hydrated fluorides, NiFe2F8(H2O)2 and CoFe2F8(H2O)2 and amorphous oxyfluorides NiFe2F4.4O1.8 and CoFe2F6.6O0.7 materials were synthesized and characterized by XRD diffraction, thermal analysis and electronic microscopies. Their subsequent electrochemical characterization revealed each of these materials to be exceptionally active OER catalysts while Raman and X-ray photoelectron spectroscopies offered mechanistic clues to their superior activity. Finally, the highest performing NiFe2F4.4O1.8 was combined with another earth abundant catalyst, cobalt sulfide, in a proof-of-concept overall water electrolysis system based on earth-abundant materials.
2 Results and discussion
2.1 Synthesis and characterization
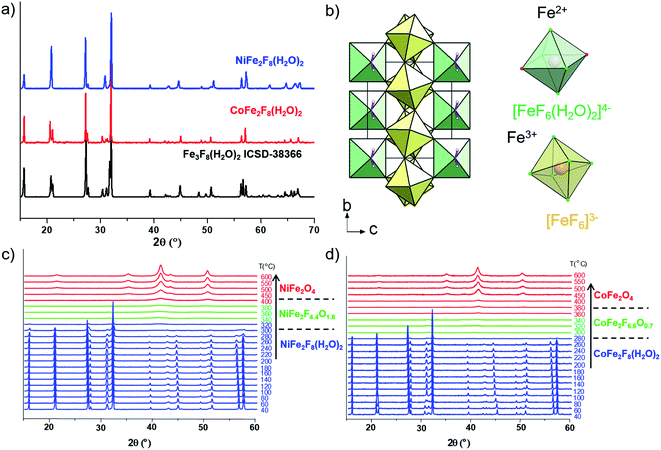
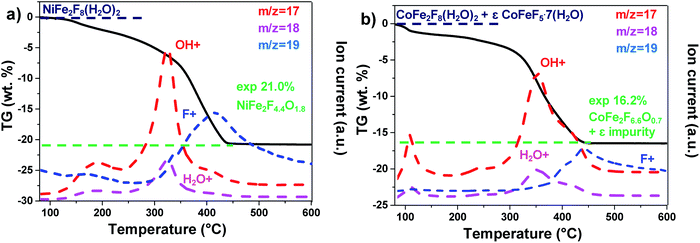
The hydrated fluorides, NiFe2F8(H2O)2 and CoFe2F8(H2O)2, were synthesized through a facile microwave heating assisted solvothermal synthesis. In brief, metal chlorides are mixed together with aqueous hydrofluoric acid (HF40%) and methanol. The mixture is heated by microwave irradiation at 160 °C for 30 min and leads to green and pink crystalline powders for NiFe2F8(H2O)2 and CoFe2F8(H2O)2 respectively. The X-ray powder diffraction patterns, indexed in the monoclinic system with the C2/m space group, show that these metal hydrates are isostructural with Fe3F8(H2O)2 (Fig. 1a and b and S1†).41,42 The structures were determined using the Rietveld method (ESI†).Those resulting crystalline hydrated fluorides were used as precursors to obtain the corresponding amorphous oxyfluorides by an appropriate treatment under ambient air. Their structural and compositional evolutions with the temperature were monitored by thermodiffraction and thermogravimetric analyses (Fig. 1c and d and S2†). The diffraction peaks positions of the hydrated crystallized phases (blue domain) shift above 180 °C to lower 2θ values and their intensities decrease. The last phenomenon is related to the elimination of water and hydrogen fluoride molecules leading to the amorphous phase (green domain) as confirmed by mass spectroscopy coupled thermogravimetric (MS-TGA) analysis under N2 (Fig. 2). Further calcination and hydrolysis at higher temperature allows the formation of the corresponding crystallized spinel M2+Fe23+O4 structures. The formulations of the intermediate stabilized amorphous oxyfluorides were determined through the following chemical reactions. For NiFe2F8(H2O)2, the experimental weight loss (21.0 wt%) corresponds to NiFe2F4.4O1.8 following the reaction (1):
| NiFe2F8(H2O)2 → NiFe2F4.4O1.8 + 3.6HF + 0.2H2O | (1) |
And in the case of CoFe2F8(H2O)2, to the reaction (2). It must be noted that CoFeF5·7H2O as impurity was detected by XRD (Fig. S1†) and quantified (8% molar) by Mössbauer spectrometry.40 This amount has to be taken into account to obtain the 16.2% experimental weight loss.
| 0.92CoFe2F8(H2O)2 + 0.08CoFeF5·7H2O → 0.92CoFe2F6.6O0.7 + 0.08CoFeF5 + 1.29HF + 1.76H2O | (2) |
Compared to TGA under N2, TGA under ambient air shows identical first weight losses (Fig. S2†) but for temperatures above 400 °C, slow weight losses related to a hydrolysis occur that leads to spinel oxides (Table S1†) according to reaction (3):
| M2+Fe2F8−2xOx + (4 − x)H2O → M2+Fe2O4 + (8 − 2x)HF | (3) |
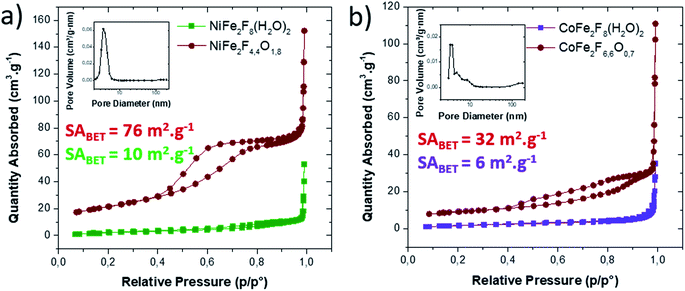
Consequently, the stabilized amorphous oxyfluorides phases were prepared by thermal decomposition of M2+Fe23+F8(H2O)2 under air for 1 h at 340 °C and 320 °C for Ni and Co, respectively. Electronic microscopies (SEM and TEM) together with nitrogen sorption have been performed to determine the size and the morphology of the Ni–Fe and Co–Fe based compounds before and after calcination. As revealed by SEM (Fig. S3†), microsized particles are obtained for the hydrate fluorides which is in good accordance with the sharpness of the peaks in the diffractograms (Fig. 1a). The decomposition of those crystalline fluorides leads in both cases to a significant decrease of the particle size (Fig. S3†). In order to probe the atomic distribution in those resulting amorphous oxyfluorides, energy dispersive spectroscopy (EDS) elemental mapping, carried out by SEM, shows that both metals (Ni/Fe and Co/Fe) were homogenously dispersed without phase segregation within the resolution capacity of the instrument (Fig. S3†). The final Fe to metal ratio of 2 present in the initial hydrated fluoride precursors was also confirmed. This nanostructuration though the thermal treatment was further investigated by transmission electron microscopy (TEM) and N2 sorption. As shown in Fig. 3 for high magnification, fine structures are observed for both materials and in the case of Ni–Fe amorphous oxyfluorides, pores of less than 10 nm could be detected. This emerging porosity is probably related to the precursor's decomposition. Indeed, the HF and H2O gas molecules liberated during the thermal decomposition could act as a self-generated porogen.43 The porosity enhancement between NiFe2F4.4O1.8 and CoFe2F6.6O0.7 seems to be related to the increase of the number of lost HF molecules. Indeed, as shown in reaction (1) and (2), a release of 3.6HF molecules is determined for NiFe2F8(H2O)2 whereas only 1.4 for CoFe2F8(H2O)2. The amorphous character of those oxyfluorides, evidenced by thermodiffraction, was further confirmed by TEM as diffuse electron diffraction patterns were obtained by selected area electron diffraction (SEAD) on several grains and no distinct diffraction fringes at higher resolution could be observed (Fig. 3). TEM analyses could not be performed on the hydrated fluorides as they were not stable under the electron beam.
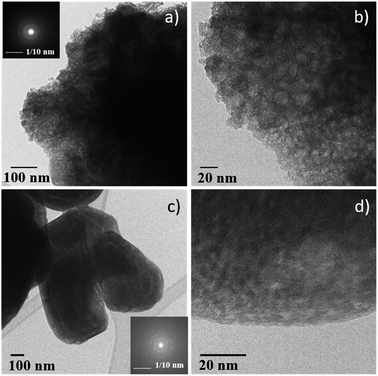 | ||
| Fig. 3 TEM micrographs of (a) and (b) NiFe2F4.4O1.8 and (c) and (d) CoFe2F6.6O0.7. Inserts: corresponding SAED. | ||
N2 sorption measurements were carried out to determine the specific surface area (SABET) of the fluorinated materials before and after thermal treatment. As expected for microsized hydrated fluorides, the measured surface areas are less than 10 m2 g−1. However, for the corresponding oxyfluorides obtained after calcination, the SABET is drastically increased up to 76 m2 g−1 and 30 m2 g−1 for NiFe2F4.4O1.8 and CoFe2F6.6O0.7 respectively confirming the porogen effect of the H2O and HF release during the thermal treatment. N2 adsorption/desorption isotherms shows type IV hysteresis corresponding to mesoporous structure according to the IUPAC classification.44 In the case of NiFe2F4.4O1.8, the BJH pore-size distribution analysis (Fig. 4a inset) shows an average pore diameter inferior to 10 nm for Ni–Fe phase, value in good agreement with the TEM observation.
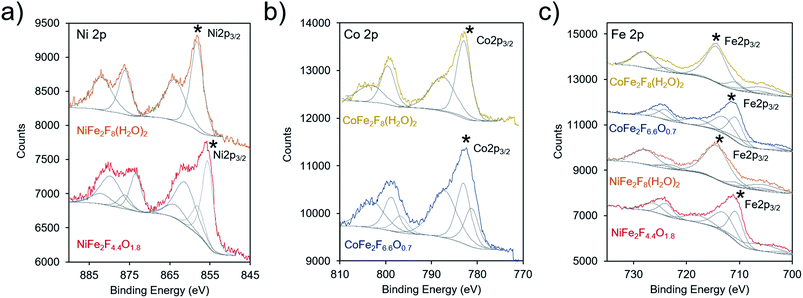
X-ray photoelectron spectroscopy (XPS) was subsequently utilized to probe the electronic structure of the transition metal species within the hydrated fluoride and oxyfluoride catalysts (together labelled (oxy)fluorides). In these measurements, both the binding peak position and peak shape provide element-specific information on oxidation state and chemical environment. The binding energies, and specifically the 2p3/2 peaks (denoted with a * in Fig. 5), of our materials were compared to those found in the national institute of science and technology (NIST) database.45 The Ni 2p3/2 binding energies were determined to be at 858.1 and 855.6 eV for NiFe2F8(H2O)2 and NiFe2F4.4O1.8, respectively (Fig. 5a). The values for NiF2 have been measured at 857.4–858.2 eV. In comparison, the Ni 2p3/2 peak is typically found at 855–856 eV for Ni(OH)2, and at 854–855 eV for NiO. This indicates that the F withdraws electron density from the Ni in our materials as their binding energies, especially that of NiFe2F8(H2O)2, are positively shifted in comparison to Ni(II) oxides/hydroxides. The Co 2p3/2 peaks of CoFe2F8(H2O)2 and CoFe2F6.6O0.7 were centered at 782.9 eV and 781.2, respectively (Fig. 5b). Likewise, these peaks are shifted slightly higher in binding energy as compared to CoO (∼780.4 eV), Co(OH)2 (781–782 eV), Co(OH)O (∼780 eV) and Co3O4 (779–780 eV) and closer to those of CoF2 (783.0 eV) and CoF3 (782.4 eV). The same can be said for the Fe 2p3/2 peaks, which were found at 712.9 eV (NiFe2F4.4O1.8 and CoFe2F6.6O0.7) and 714.4 eV (NiFe2F8(H2O)2 and CoFe2F8(H2O)2) (Fig. 5c). These shifted the most in comparison to (709–710 eV), FeOOH (711–712 eV), Fe3O4 (709–710 eV) and Fe2O3 (710–711 eV) and are closer to FeF3 (∼714 eV). The O 1s spectra for NiFe2F8(H2O)2 and CoFe2F8(H2O)2 are similar to that of pure water (∼533 eV) while the oxyfluoride O 1s spectra featured only a red-shifted peak at ∼530 eV as the O was incorporated in the lattice (Fig. S4†). Similarly, the F 1s spectra displayed a peak at 685.2 eV for NiFe2F8(H2O)2 and CoFe2F8(H2O)2 that is slightly red-shifted to 684.8 eV upon their conversion to oxyfluorides.
In summation, the XPS investigation points to all of the transition metals in the new synthesized (oxy)fluorides being electron-poor relative to their oxide analogues, induced by the presence of the highly electronegative F anions. The Fe metal cation likely experiences the largest magnitude of these effects and this is especially pronounced in the hydrated fluorides. Because the exact position of the peaks is not linearly proportional to oxidation state and electronic structure, we do not yet draw quantitative conclusions regarding the magnitude of inductive effects conferred by the F anion.
2.2 Electrocatalysis
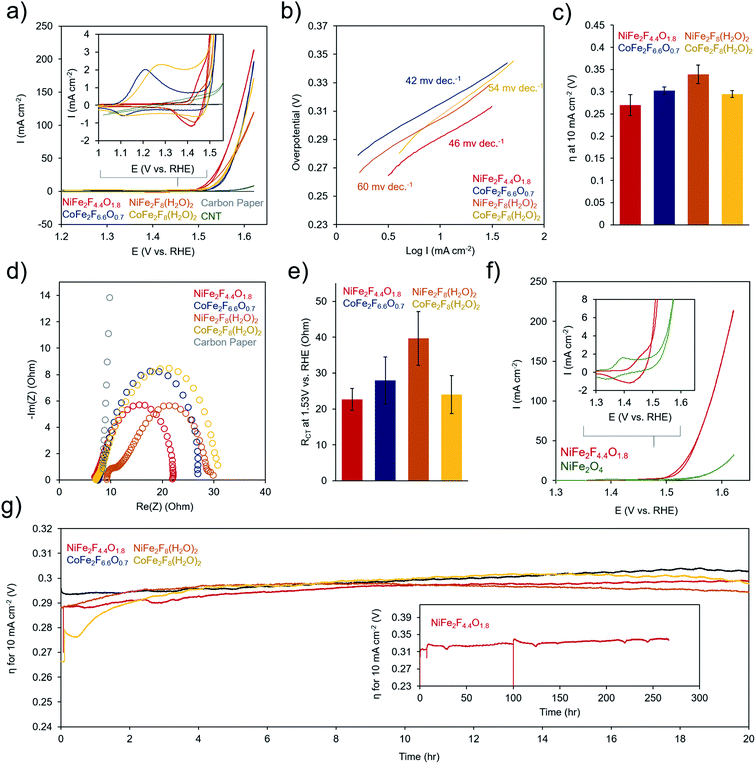
To evaluate the electrochemical performance of the (oxy)fluoride materials, the as-prepared powders were sonicated together with a Nafion binder and carbon nanotube conductive adhesive to generate a catalyst ink. The catalyst ink was then drop-cast onto a carbon paper electrode and dried prior testing in 1 M KOH. Several (∼3–6) electrodes were prepared for each measurement and error bars represent standard deviations from multiple electrodes. Cyclic voltammetry (CV) tests of the catalysts in 1 M KOH electrolyte illustrated that each material undergoes a series of redox-changes prior to OER catalysis, indicating the transformation to a catalytically active state (Fig. 6a). This is common in mixed-metal oxides of Ni, Co, and Fe, in which typically the surface evolves into an oxyhydroxide phase at a potential in the range of where our redox peaks are located.4 This may indicate that the surface of our (oxy)fluorides also evolve into similar phases. The differences in peak shapes here reflect variance in the physical and electronic structure of the transition metals in each material. We also did not witness drastic changes in the CV shape or increases in OER activity as is sometime observed in Ni–Fe and Co–Fe oxides as a result of structural or compositional changes during this conditioning phase.46,47 Following this redox transformation, the OER kinetics are exceptionally high, evidenced by the low Tafel slopes (40–60 mV dec−1 range) (Fig. 6b) and low overpotential to attain a geometric current density of 10 mA cm−2 (250–350 mV) (Fig. 6c). The performance of the (oxy)fluorides is comparable to state-of-the-art mixed-metal oxide OER catalysts.48,49 In this series, the NiFe2F4.4O1.8 was consistently the highest performing material. The series of materials' performance is likely also influenced by their surface area and consequently the quantity of active sites exposed to the solution, with NiFe2F4.4O1.8 exhibiting both the highest surface area (76 m2 g−1) and electrocatalytic activity. An interesting point is that each material exhibits a current crossover in the CV, around 1.5 V (i.e. the current in the reverse scan is slightly higher). This may indicate an in situ surface reconstruction during the CV that serves to activate the material during the CV cycle and could be an interesting aspect to explore with operando techniques in the future.The precise benefit to OER catalysis conferred by the F anions within NiFe2F4.4O1.8 is illustrated by comparing its electrochemical response to the crystalline NiFe2O4 (Fig. 6f). The electron-withdrawing nature of F is evident through a shift in the redox potential for the Ni-oxidation peak, which is shifted 50 mV more positive. This indicates that the Ni is harder to oxidize in NiFe2F4.4O1.8. However, once oxidizes the NiFe2F4.4O1.8 catalyst oxidized water much more rapidly, with an earlier onset potential and quickly increasing OER current. In contrast, NiFe2O4 requires <100 mV more overpotential to attain similar currents.
Electrochemical Impedance Spectroscopy (EIS) was performed at 300 mV overpotential for all samples and the data, which was in the form of a semi-circle, was fit using a Randles equivalent circuit model (Fig. 6d and e). However, NiFe2F8(H2O)2 featured two semi-circles, indicative of both a charge-transfer resistance and a significant resistance from the material's limited conductivity had to be fit with a separate model. The models and fitting are presented in Fig. S5.† In these spectra, the high-frequency intercept at ∼7 ohms reflects the solution-resistance and the low-frequency intercept of the semicircle at around 20–40 ohms resistance corresponds to the charge transfer kinetics at the catalyst surface. The lowest charge-transfer resistance of NiFe2F4.4O1.8 (23 ± 3 ohms) corresponds to its rapid OER catalysis. Finally, the stability of (oxy)fluorides was evaluated through chronopotentiometric measurements at 10 mA cm−2 (Fig. 6g). Over a period of 20 h, each sample experiences only minimal (∼30 mV) performance losses. The stability of NiFe2F4.4O1.8 is demonstrated with a duration of ∼270 h (Fig. 6g inset). Prior to efforts at optimization of material structure and morphology, these initial electrochemical results already indicate that these (oxy)fluorides are excellent candidates for OER-enabled technologies such as electrolyzer or air batteries.
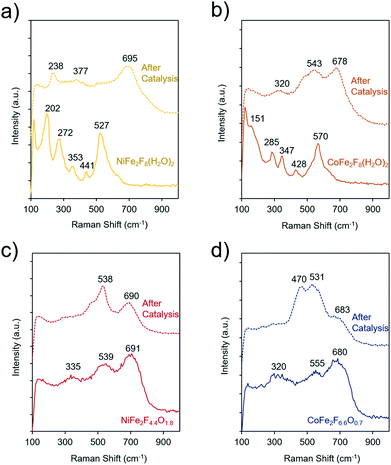
To elucidate the molecular dynamics (oxy)fluorides throughout the catalytic process, Raman spectroscopy was used to probe them before and after catalysis (4 h chronoamperometry at 300 mV overpotential in 1 M KOH). Spectra of crystalline NiFe2F8(H2O)2 and CoFe2F8(H2O)2 shows several strong bands, as common to crystalline metal-oxides (Fig. 7a and b). However, the bands of hydrated fluorides significantly widen and decrease in intensity, indicating a loss of crystallinity during catalysis. In contrast, the spectra of the amorphous oxyfluorides, NiFe2F4.4O1.8 and CoFe2F6.6O0.7, show a small evolution with weak and wide bands before and after OER testing. Likely, the OER-active state of each material is an amorphous final state on the material's surface and is at a higher-valence oxidation state than the as-made material. The spectra of these materials after catalysis do not match those of NiOOH,50 CoOOH,50 amorphous CoOx,51,52 or various iron oxide phases,53 indicating that the surface of the (oxy)fluorides tested here are not transformed to NiOOH or CoOOH.
The TEM analysis was also conducted on the amorphous NiFe2F4.4O1.8 and CoFe2F6.6O0.7 after the OER catalysis (Fig. S6†). In both cases, these oxyfluorides remain amorphous confirming the Raman analysis. Their morphology slightly changes to thin sheet-like appearance and no additional amorphous layer is observed. Metal leaching was also observed during catalysis. Indeed, the Fe3+ to M2+ ratios measured by EDS-TEM vary from 2 to 1.4 for NiFe2F4.4O1.8 corresponding to a Fe leaching and from 2.1 to 2.4 for CoFe2F6.6O0.7 corresponding to a Co leaching. Those differences in the composition through leaching are in good agreement with the slight differences in the Raman spectra.
In order to probe surface intermediates and rate-limiting steps of the OER cycle of the (oxy)fluoride materials, we utilized methanol oxidation as facile method to detect surface-bound *OH. As *OH is a very electrophilic intermediate, it will react with methanol, and thus give rise to methanol oxidation currents when present in substantial quantities.54 Upon the addition of 10 mM methanol, we noted enhanced currents beginning at 1.0 V vs. RHE for all examples except for NiFe2F8(H2O)2 (Fig. S7†). This result points to (though does not prove) *OH coverage on the (oxy)fluoride surfaces prior to OER initiation and that the *OH deprotonation step as possibly being rate limiting. On the other hand, the limiting step for NiFe2F8(H2O)2 may be the adsorption of *OH. This is especially interesting as even changes in a material's stoichiometry induce notable changes in mechanism.
While a complete mechanistic picture of these oxyfluoride materials is not yet available, there exist a number of promising approaches to obtain complementary pieces to this puzzle. X-ray absorption spectroscopy (XAS), especially when operated in situ, has been previously used to elucidate how changes in oxidation states and chemical environments of the transition metal species influence catalytic activity in metal-oxide materials and would be similarly useful to this system.49,55–58 XPS, performed in specialized instrumental setups would also provide complementary information regarding electronic structure as a function of applied bias and reaction time.59 Furthermore, techniques such as electrochemical quartz crystal microbalance measurements may impart information on voltage-dependent surface or bulk reconstruction by cross-comparing currents and in situ changes in mass.60
As a proof of concept, the best performing material, NiFe2F4.4O1.8, was combined with another earth-abundant hydrogen evolution reaction (HER) catalyst, cobalt sulfide (CoSx),61,62 and utilized in an overall water electrolysis cell (Fig. 8a and S8†). In a two-electrode configuration, overall water electrolysis initiated at ∼1.60 V and reached 100 mA cm−2 at 1.80 V. Chronopotentiometric testing at 10 mA cm−2 pointed to a stable performance of this composite system at ∼1.65 V for 24 h. In this configuration, the OER overpotential was ∼270 mV, in line with some of the highest-performing Ni–Fe oxides48 and the HER overpotential was ∼100 mV. This metric is comparable to the performance achieved with benchmark precious-metal (e.g. Pt, Ir, Ru) containing systems63 that also need typically 1.55–1.60 V to reach 10 mA cm−2 and points to the promise of oxyfluorides as cost-effective OER components of next-generation electrochemical technologies.
3 Concluding remarks
In summary, we present a study on the synthesis and electrocatalytic applications of mixed-metal (oxy)fluorides as OER catalysts. Crystalline hydrated fluorides, CoFe2F8(H2O)2 and NiFe2F8(H2O)2, were prepared by microwave heating assisted solvothermal synthesis. Subsequent calcination of the hydrated fluorides leads to the formation of amorphous oxyfluorides NiFe2F4.4O1.8 and CoFe2F6.6O0.7. The (oxy)fluorides are speculated to benefit from the fluorine anions withdrawing electron density away from the Co, Ni, and Fe species, which are likely responsible for the exceptional electrocatalytic properties of each material. Finally, the best catalyst, NiFe2F4.4O1.8, associated with a CoSx HER catalyst leads to a highly performing water electrolyzer comprised of only earth-abundant element catalysts. This study may open up avenues towards the utility of (oxy)fluoride materials for energy-related applications and rational routes for harnessing inductive effects conferred by fluorine species.4 Materials and methods
4.1 Synthesis
The hydrated fluorides M2+Fe23+F8(H2O)2 (M2+ = Co, Ni) was obtained by solvothermal reaction using a MARS-5 Microwave Digestion System (CEM Corp.) from starting reactants of chloride precursors (Alfa Aesar), 9.45 mL of absolute methanol ‘MeOH’ (233 mmol, 24.7 mol L−1, 99.8%, Sigma Aldrich) and 0.55 mL hydrofluoric acid solution (15 mmol, 27.6 mol L−1, Riedel De Haen). A constant concentration [MII] + [FeIII] = 0.1 mol L−1, a ratio [FeIII]/[MII] = 2 and a constant volume of liquid (HF and MeOH) were fixed. The MII/FeIII/HF/MeOH ratio is 1/2/44/699. The mixtures are placed in Teflon autoclaves and heated at 160 °C for 30 min with stirring. After cooling, the solid products are filtered, washed with 2 mL of ethanol and dried in a furnace under air.CoFe2F8(H2O)2 and NiFe2F8(H2O)2 were put in a furnace at 320 °C and 340 °C, respectively, during 1 h (heating/cooling rate of 2 °C min−1) giving the amorphous oxyfluorides with M2+M23+F8−2xOx formulations.
4.2 Characterization methods
Conflicts of interest
There are no conflicts to declare.Acknowledgements
The authors give thanks to French Research Ministry for a doctoral grant. The authors attached to the IMMM institute to gratefully acknowledge the “X-ray Diffusion and Diffraction” and the “Electron Microcopy” technical platforms of IMMM (Le Mans University). The authors also give thanks to Josianne Lefebvre for help with XPS experiments. N. K. and N. H. acknowledge the NSERC Discovery Grant RGPIN-2019-05927.References
- M. I. Hoffert, K. Caldeira, A. K. Jain, E. F. Haites, L. D. Harvey, S. D. Potter, M. E. Schlesinger, S. H. Schneider, R. G. Watts and T. Wigley, Nature, 1998, 395, 881 CrossRef CAS.
- P. Nejat, F. Jomehzadeh, M. M. Taheri, M. Gohari and M. Z. A. Majid, Renewable Sustainable Energy Rev., 2015, 43, 843–862 CrossRef CAS.
- C. Hu, L. Zhang and J. Gong, Energy Environ. Sci., 2019 10.1039/c9ee01202h.
- L. Trotochaud, J. K. Ranney, K. N. Williams and S. W. Boettcher, J. Am. Chem. Soc., 2012, 134, 17253–17261 CrossRef CAS.
- F. Dionigi and P. Strasser, Adv. Energy Mater., 2016, 6, 1600621 CrossRef.
- D. Zhou, S. Wang, Y. Jia, X. Xiong, H. Yang, S. Liu, J. Tang, J. Zhang, D. Liu, L. Zheng, Y. Kuang, X. Sun and B. Liu, Angew. Chem., Int. Ed., 2019, 58, 736–740 CrossRef CAS PubMed.
- G. Ou, F. Wu, K. Huang, N. Hussain, D. Zu, H. Wei, B. Ge, H. Yao, L. Liu, H. Li, Y. Shi and H. Wu, ACS Appl. Mater. Interfaces, 2019, 11, 3978–3983 CrossRef PubMed.
- H. Wang, H.-W. Lee, Y. Deng, Z. Lu, P.-C. Hsu, Y. Liu, D. Lin and Y. Cui, Nat. Commun., 2015, 6, 7261 CrossRef CAS PubMed.
- K. Fan, H. Chen, Y. Ji, H. Huang, P. M. Claesson, Q. Daniel, B. Philippe, H. Rensmo, F. Li, Y. Luo and L. Sun, Nat. Commun., 2016, 7, 11981 CrossRef CAS PubMed.
- L. Hui, Y. Xue, B. Huang, H. Yu, C. Zhang, D. Zhang, D. Jia, Y. Zhao, Y. Li, H. Liu and Y. Li, Nat. Commun., 2018, 9, 5309 CrossRef PubMed.
- A. Indra, P. W. Menezes, N. R. Sahraie, A. Bergmann, C. Das, M. Tallarida, D. Schmeißer, P. Strasser and M. Driess, J. Am. Chem. Soc., 2014, 136, 17530–17536 CrossRef CAS PubMed.
- R. Pittkowski, P. Krtil and J. Rossmeisl, Curr. Opin. Electrochem., 2018, 12, 218–224 CrossRef CAS.
- M. E. G. Lyons, R. L. Doyle, M. P. Browne, I. J. Godwin and A. A. S. Rovetta, Curr. Opin. Electrochem., 2017, 1, 40–45 CrossRef CAS.
- Q. Shi, C. Zhu, D. Du and Y. Lin, Chem. Soc. Rev., 2019, 48, 3181–3192 RSC.
- I. Godwin, A. Rovetta, M. Lyons and J. Coleman, Curr. Opin. Electrochem., 2018, 7, 31–35 CrossRef CAS.
- M. P. Browne, C. Domínguez and P. E. Colavita, Curr. Opin. Electrochem., 2018, 7, 208–215 CrossRef CAS.
- M.-I. Jamesh and X. Sun, J. Power Sources, 2018, 400, 31–68 CrossRef CAS.
- D. A. Kuznetsov, B. Han, Y. Yu, R. R. Rao, J. Hwang, Y. Román-Leshkov and Y. Shao-Horn, Joule, 2018, 2, 225–244 CrossRef CAS.
- N. Kornienko, Joule, 2018, 2, 207–209 CrossRef CAS.
- J. H. Zagal and M. T. M. Koper, Angew. Chem., Int. Ed., 2016, 55, 14510–14521 CrossRef CAS PubMed.
- S. Zhao, Y. Wang, J. Dong, C.-T. He, H. Yin, P. An, K. Zhao, X. Zhang, C. Gao, L. Zhang, J. Lv, J. Wang, J. Zhang, A. M. Khattak, N. A. Khan, Z. Wei, J. Zhang, S. Liu, H. Zhao and Z. Tang, Nat. Energy, 2016, 1, 16184 CrossRef CAS.
- L. Tao, C.-Y. Lin, S. Dou, S. Feng, D. Chen, D. Liu, J. Huo, Z. Xia and S. Wang, Nano Energy, 2017, 41, 417–425 CrossRef CAS.
- W. Yang, Z. Wang, W. Zhang and S. Guo, Trends in Chemistry, 2019, 1, 259–271 CrossRef.
- S. Polishchuk, L. Ignat'eva, Y. V. Marchenko and V. Bouznik, Glass Phys. Chem., 2011, 37, 1–20 CrossRef CAS.
- W. B. Im, N. George, J. Kurzman, S. Brinkley, A. Mikhailovsky, J. Hu, B. F. Chmelka, S. P. DenBaars and R. Seshadri, Adv. Mater., 2011, 23, 2300–2305 CrossRef CAS PubMed.
- N. Pereira, F. Badway, M. Wartelsky, S. Gunn and G. Amatucci, J. Electrochem. Soc., 2009, 156, A407–A416 CrossRef CAS.
- M. Leblanc, V. Maisonneuve and A. Tressaud, Chem. Rev., 2015, 115, 1191–1254 CrossRef CAS PubMed.
- K. Liang, L. Guo, K. Marcus, S. Zhang, Z. Yang, D. E. Perea, L. Zhou, Y. Du and Y. Yang, ACS Catal., 2017, 7, 8406–8412 CrossRef CAS.
- X. Fan, Y. Liu, S. Chen, J. Shi, J. Wang, A. Fan, W. Zan, S. Li, W. A. Goddard and X.-M. Zhang, Nat. Commun., 2018, 9, 1809 CrossRef PubMed.
- P. Chen, T. Zhou, S. Wang, N. Zhang, Y. Tong, H. Ju, W. Chu, C. Wu and Y. Xie, Angew. Chem., Int. Ed., 2018, 57, 15471–15475 CrossRef CAS PubMed.
- Y. Xue, Y. Wang, H. Liu, X. Yu, H. Xue and L. Feng, Chem. Commun., 2018, 54, 6204–6207 RSC.
- H. Han, J. Woo, Y.-R. Hong, Y.-C. Chung and S. Mhin, ACS Appl. Energy Mater., 2019, 2, 3999–4007 CrossRef CAS.
- C. Pei, H. Chen, B. Dong, X. Yu and L. Feng, J. Power Sources, 2019, 424, 131–137 CrossRef CAS.
- F. J. Brink, R. L. Withers and J. G. Thompson, J. Solid State Chem., 2000, 155, 359–365 CrossRef CAS.
- H. Zhou, J. Nanda, S. K. Martha, J. Adcock, J. C. Idrobo, L. Baggetto, G. M. Veith, S. Dai, S. Pannala and N. J. Dudney, J. Phys. Chem. Lett., 2013, 4, 3798–3805 CrossRef CAS.
- J. Zhu and D. Deng, Angew. Chem., Int. Ed., 2015, 54, 3079–3083 CrossRef CAS PubMed.
- N. Pereira, F. Badway, M. Wartelsky, S. Gunn and G. G. Amatucci, J. Electrochem. Soc., 2009, 156, A407–A416 CrossRef CAS.
- M. Duttine, D. Dambournet, N. Penin, D. Carlier, L. Bourgeois, A. Wattiaux, K. W. Chapman, P. J. Chupas, H. Groult, E. Durand and A. Demourgues, Chem. Mater., 2014, 26, 4190–4199 CrossRef CAS.
- M. Burbano, M. Duttine, B. J. Morgan, O. J. Borkiewicz, K. W. Chapman, A. Wattiaux, A. Demourgues, H. Groult, M. Salanne and D. Dambournet, J. Phys. Chem. Lett., 2019, 10, 107–112 CrossRef CAS PubMed.
- K. Lemoine, L. Zhang, J.-M. Grenèche, A. Hémon-Ribaud, M. Leblanc, a. guiet, C. Galven, J.-M. Tarascon, V. Maisonneuve and J. Lhoste, J. Phys. Chem. C, 2019, 123, 21386–21394 CrossRef CAS.
- E. Herdtweck, Z. Anorg. Allg. Chem., 1983, 501, 131–136 CrossRef CAS.
- M. Leblanc, G. Ferey, Y. Calage and R. De Pape, J. Solid State Chem., 1984, 53, 360–368 CrossRef CAS.
- A. Lemaire, J. C. Rooke, L.-H. Chen and B.-L. Su, Langmuir, 2011, 27, 3030–3043 CrossRef CAS PubMed.
- K. S. Sing, Pure Appl. Chem., 1985, 57, 603–619 CAS.
- NIST X-ray Photoelectron Spectroscopy Database, 2019, vol. 20, http://https://srdata.nist.gov/xps/citation.aspx Search PubMed.
- L. Trotochaud, S. L. Young, J. K. Ranney and S. W. Boettcher, J. Am. Chem. Soc., 2014, 136, 6744–6753 CrossRef CAS PubMed.
- M. Gao, W. Sheng, Z. Zhuang, Q. Fang, S. Gu, J. Jiang and Y. Yan, J. Am. Chem. Soc., 2014, 136, 7077–7084 CrossRef CAS.
- M. Gong and H. Dai, Nano Res., 2015, 8, 23–39 CrossRef CAS.
- N.-T. Suen, S.-F. Hung, Q. Quan, N. Zhang, Y.-J. Xu and H. M. Chen, Chem. Soc. Rev., 2017, 46, 337–365 RSC.
- B. S. Yeo and A. T. Bell, J. Phys. Chem. C, 2012, 116, 8394–8400 CrossRef CAS.
- B. S. Yeo and A. T. Bell, J. Am. Chem. Soc., 2011, 133, 5587–5593 CrossRef CAS PubMed.
- J. Tyczkowski, R. Kapica and J. Łojewska, Thin Solid Films, 2007, 515, 6590–6595 CrossRef CAS.
- D. L. A. de Faria, S. Venâncio Silva and M. T. de Oliveira, J. Raman Spectrosc., 1997, 28, 873–878 CrossRef CAS.
- H. B. Tao, Y. Xu, X. Huang, J. Chen, L. Pei, J. Zhang, J. G. Chen and B. Liu, Joule, 2019, 3, 1498–1509 CrossRef CAS.
- N. Li, D. K. Bediako, R. G. Hadt, D. Hayes, T. J. Kempa, F. von Cube, D. C. Bell, L. X. Chen and D. G. Nocera, Proc. Natl. Acad. Sci. U. S. A., 2017, 114, 1486 CrossRef CAS PubMed.
- A. Bergmann, T. E. Jones, E. Martinez Moreno, D. Teschner, P. Chernev, M. Gliech, T. Reier, H. Dau and P. Strasser, Nat. Catal., 2018, 1, 711–719 CrossRef CAS.
- L. J. Enman, M. B. Stevens, M. H. Dahan, M. R. Nellist, M. C. Toroker and S. W. Boettcher, Angew. Chem., Int. Ed., 2018, 57, 12840–12844 CrossRef CAS PubMed.
- D. Friebel, M. W. Louie, M. Bajdich, K. E. Sanwald, Y. Cai, A. M. Wise, M.-J. Cheng, D. Sokaras, T.-C. Weng, R. Alonso-Mori, R. C. Davis, J. R. Bargar, J. K. Nørskov, A. Nilsson and A. T. Bell, J. Am. Chem. Soc., 2015, 137, 1305–1313 CrossRef CAS PubMed.
- H. Ali-Löytty, M. W. Louie, M. R. Singh, L. Li, H. G. Sanchez Casalongue, H. Ogasawara, E. J. Crumlin, Z. Liu, A. T. Bell, A. Nilsson and D. Friebel, J. Phys. Chem. C, 2016, 120, 2247–2253 CrossRef.
- N. Kornienko, N. Heidary, G. Cibin and E. Reisner, Chem. Sci., 2018, 9, 5322–5333 RSC.
- Y. Sun, C. Liu, D. C. Grauer, J. Yano, J. R. Long, P. Yang and C. J. Chang, J. Am. Chem. Soc., 2013, 135, 17699–17702 CrossRef CAS PubMed.
- N. Kornienko, J. Resasco, N. Becknell, C.-M. Jiang, Y.-S. Liu, K. Nie, X. Sun, J. Guo, S. R. Leone and P. Yang, J. Am. Chem. Soc., 2015, 137, 7448–7455 CrossRef CAS PubMed.
- C. C. L. McCrory, S. Jung, I. M. Ferrer, S. M. Chatman, J. C. Peters and T. F. Jaramillo, J. Am. Chem. Soc., 2015, 137, 4347–4357 CrossRef CAS PubMed.
Footnote |
| † Electronic supplementary information (ESI) available. See DOI: 10.1039/c9sc04027g |
| This journal is © The Royal Society of Chemistry 2019 |

