One-step synthesis of nickel–iron layered double hydroxides with tungstate acid anions via flash nano-precipitation for the oxygen evolution reaction
Xueyan
Xue
a,
Feng
Yu
 *a,
Banghua
Peng
a,
Gang
Wang
a,
Yin
Lv
a,
Long
Chen
a,
Yongbin
Yao
a,
Bin
Dai
a,
Yulin
Shi
*a and
Xuhong
Guo
 *ab
*ab
aKey Laboratory for Green Processing of Chemical Engineering of Xinjiang Bingtuan, School of Chemistry and Chemical Engineering, Shihezi University, Shihezi 832003, P. R. China. E-mail: yufeng05@mail.ipc.ac.cn; shiyulin521@126.com
bState Key Laboratory of Chemical Engineering, East China University of Science and Technology, Shanghai 200237, P. R. China. E-mail: guoxuhong@ecust.edu.cn
First published on 17th October 2018
Abstract
Layered double hydroxide materials with two-dimensional structures and rich diversity have proved to be very promising candidates for non-precious metal electrocatalysis of the oxygen evolution reaction. We utilized a flash nano-precipitation (FNP) synthetic strategy to produce nickel–iron layered double hydroxides with tungstate anions, which simultaneously optimizes the intrinsic and extrinsic activity of the electrocatalyst. The high-valent metal W6+ was introduced into NiFe-LDH in the form of WO42−, which not only increases the diversity of metal species but also optimizes the electronic structure. Furthermore, the flash nano-precipitation synthesis method used changes the morphological structure of the material and thus provides more edge active sites for the oxygen evolution reaction. This led to the fact that NiFe-WO4-LDH prepared from FNP has excellent electrocatalytic activity compared to the pristine materials we prepared. By combining the classical theory of chemical precipitation processes, it can be found that the flash nano-precipitation synthetic strategy can achieve a certain degree of separation of nucleation and growth processes by adjusting experimental parameters. The simple, efficient and scalable flash nano-precipitation synthesis method will provide new routes for metal-based electrocatalyst materials.
Introduction
It goes without saying that various types of electrocatalytic processes, which mainly include the oxygen evolution reaction, hydrogen evolution reaction, oxygen reduction reaction, carbon dioxide reduction reaction, and nitrogen reduction reaction, play a key role in the clean energy conversion process.1 Research studies on such electrocatalytic processes can promote the sustainable production of various fuels and chemicals.1 Among them, the oxygen evolution reaction (OER), half reaction of water splitting, is the bottleneck of the water oxidation process due to the slow kinetics.2 In addition, it is also the key of rechargeable metal–air batteries.3 Research on the electrocatalysts of OER can not only improve the efficiency of the water splitting, but also promote the development of the fuel cell.4 It is well known that the precious metals ruthenium, rhodium and their derivatives are ideal OER catalysts. However, due to the limited reserves and high costs, they are not suitable for large-scale application. Therefore, people are looking for inexpensive and abundant non-precious metal catalysts as alternatives.A large number of studies have shown that the first-row transition metal-based compound materials exhibit OER catalytic activity comparable to that of precious metals in alkaline electrolytes.5–7 Among such materials, layered double hydroxide (LDH) materials have attracted much attention because of their unique two-dimensional layered structure and excellent electrocatalytic activity. Since NiFe-LDH/CNTs has been reported to exhibit excellent OER performance,8 LDH materials and LDH-based composites have been widely studied in electrocatalysis over the past five years. Studies have shown that the reason for the excellent OER catalytic activity of LDH is mainly attributed to that the main layers are composed of an edge-sharing MO6 octahedral structure, which is the possible active site of the OER.9,10 The main layers of the LDH material are composed of two metals, three metals, or even four metals to form a binary, ternary or even quaternary LDH. Studies found that NiFe-LDH shows relatively excellent OER catalytic performance in binary LDH.11,12 The formation of nanosheet structures by exfoliate bulk NiFe-LDH10 and nanosheet array structures by directly growing on specific substrates13–17 can lead to exposure of more active sites to improve the electrocatalytic activity.
Researchers further developed a ternary LDH electrocatalyst by introducing another metal element such as Mn,18 Al,19 Co,20 V,21 Cr22etc. in NiFe-LDH. Study of their OER activity revealed that the activity of these ternary LDH materials is superior to that of the corresponding binary LDH materials. In other words, the pluralism of metal species can improve the OER performance in electrocatalysts. This conclusion has also been verified in other transition metal (oxy)hydroxide electrocatalysts.23,24 High-priced metals such as tungsten and molybdenum not only increased the diversity of metal species, but also modulated 3d metal (oxy) hydroxides, allowing them to possess near optimal adsorption energies for OER intermediates.23,24 The LDH materials have not only the diversity of metal composition of the main layers, but also a variety of interlayer anions. They may be inorganic anions, organic anions or polyacid anions, and the like. High-valent metal cations (W6+ or Mo6+) may exist in LDH in the form of polyacid anions. A study has shown that the introduction of MoO42− into NiFe-LDH can promote the improvement of the OER activity.25 Therefore, we decided to introduce W6+ into NiFe-LDH in the form of WO42− and investigate its electrocatalytic properties.
In our work, the high-valent metal W6+ was introduced into NiFe-LDH in the form of WO42−. NiFe-LDH intercalated CO32− was used as the control group. The above two materials were prepared by flash nano-precipitation. Flash nano-precipitation (FNP) is a rapid self-assembly processing technique.26 At present, the technology is mainly used for uniform nanoparticle preparations, which are applied to drug delivery and imaging.27 A study has shown that the technology can also be used to prepare highly efficient metal catalysts.28 The FNP technology can achieve a continuous sub-millisecond micro-mixing.29 And instantaneous nucleation can be achieved by adjusting the solution concentration and flow rate of raw material streams.30 The FNP can provide a relatively uniform reaction environment that is beneficial to the homogeneity of products. Moreover, FNP technology also has the advantages of high efficiency, multiple functions, controllability and scalability. In addition, we also used the coprecipitation method (CP) to prepare NiFe-LDH intercalated CO32− or WO42− for comparison with these two materials prepared by the FNP method. The well-crystallized NiFe-CO3-LDH and NiFe-WO4-LDH with low crystallinity were successfully prepared by the FNP method. The experimental results show that NiFe-WO4-LDH prepared from FNP has the best electrocatalytic properties for the OER compared to other control groups.
Experimental
Preparation of samples
NiFe-CO3-LDH (CP) and NiFe-WO4-LDH (CP) were synthesized via a simple co-precipitation process.31 First, Ni(NO3)2·6H2O and Fe(NO3)3·9H2O were dissolved in 20 mL water to form a homogeneous salt solution. The ratio of Ni2+ and Fe3+ was about 3![[thin space (1/6-em)]](https://www.rsc.org/images/entities/char_2009.gif) :
:![[thin space (1/6-em)]](https://www.rsc.org/images/entities/char_2009.gif) 1, and the total amount of transition metal nitrates was 20 mmol. Second, NaOH (35 mmol) and Na2CO3 (or Na2WO4·2H2O) (10 mmol) were dissolved in 20 mL water to form a homogeneous base solution. The above salt and base solution are simultaneously added dropwise to 40 mL of water with magnetic stirring within 1.5 h. Keeping the pH around 8.5 the mixture was crystallized under stirring at 50 °C for 6 h. The resulting turbid liquid was centrifuged, washed with water and ethanol several times, and then dried in a vacuum at 80 °C overnight.
1, and the total amount of transition metal nitrates was 20 mmol. Second, NaOH (35 mmol) and Na2CO3 (or Na2WO4·2H2O) (10 mmol) were dissolved in 20 mL water to form a homogeneous base solution. The above salt and base solution are simultaneously added dropwise to 40 mL of water with magnetic stirring within 1.5 h. Keeping the pH around 8.5 the mixture was crystallized under stirring at 50 °C for 6 h. The resulting turbid liquid was centrifuged, washed with water and ethanol several times, and then dried in a vacuum at 80 °C overnight.
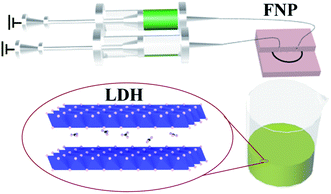
The raw materials used in the preparation of NiFe-CO3-LDH (FNP) and NiFe-WO4-LDH (FNP) are identical to those used in the preparation of NiFe-CO3-LDH (CP) and NiFe-WO4-LDH (CP). The only difference in the preparation process is that the two-drop stirring–mixing process in the CP is replaced by a microchannel mixer at an injection rate of 2 mL min−1 in the FNP, as shown in Fig. 1. Regarding the stability of the microreactor under alkaline conditions, the problem is ignored under current conditions of use, because it has been observed that the microreactor does not appear to be corroded after repeated use under alkaline conditions.32,33 Another problem that needs to be noted for such a microchannel reactor is channel blockage due to inappropriate reactor installation or poor cleaning. In addition, the conditions for subsequent crystallization, washing and drying are all the same.
Material characterization
Powder X-ray diffraction (XRD) patterns were recorded on a Bruker D8 Advance X-ray diffractometer (Bruker Biosciences Corporation, Billerica, MA, USA) with Cu Kα radiation (40 kV, 40 mA, λ = 1.5406 Å). The spectra were recorded at a scan rate of 10 per minute in the 2θ range of 10° to 80°. Fourier transform infrared (FT-IR) spectra were recorded in the range of 3999 to 525 cm−1 with 2 cm−1 resolution on a Thermo iS10 instrument using the KBr pellet technique. Raman spectra were recorded on a RM2000 (Renishaw, UK) with a 514 nm laser as an excitation source. Transmission electron microscopy (TEM) images, high-resolution transmission electron microscopy (HRTEM) images and EDS mapping were recorded on a FEI Tecnai G2 F20 equipped with an energy dispersive X-ray spectroscope (EDS), operating at 200 kV. N2 adsorption and desorption experiments were performed using an analyzer model of Micromeritics ASAP 2460, in order to obtain structural information of the material including BET specific surface area, pore size distribution and pore volume. The material was degassed at 90 °C to ensure that it does not affect the LDH material. X-ray photoelectron spectroscopy (XPS) measurements were carried out on an ESCALAB 250Xi (Thermo Scientific) using monochromatized Al Kα radiation (1486.6 eV). The XPS spectra were energy calibrated by setting the adventitious carbon peak to 284.8 eV. Elemental analyses were performed on an inductively coupled plasma emission spectrometer (ICPS-7510).Electrochemical performance
Ni foam was cut in to 1 × 4 cm pieces and ultrasonically cleaned in acetone, dilute hydrochloric acid, distilled water and ethanol. Subsequently, it was dried in a vacuum at 80 °C for 12 h. A measure of 2 mg of the as-synthesized catalysts was dispersed in the mixture solution of 500 μL distilled water, 500 μL ethanol and 30 μL of PTFE by sonication for at least 0.5 h to form a homogeneous catalyst suspension. In order to prepare the working electrode, the above suspension (100 μL) was drop-cast onto pre-polished Ni foam (area: 1 × 1 cm) yielding a catalyst loading of 0.1 mg cm−2, and dried at 60 °C for 12 h in a vacuum.The OER electrocatalytic properties were investigated in 1 M KOH bubbled with O2 within a standard three electrode system (reference electrode: Ag/AgCl electrode filled with saturated KCl; counter electrode: Pt wire; working electrode: Ni foam) using a CHI 660D electrochemical workstation. Prior to data collection, twenty cyclic voltammetric (CV) scans were recorded at 50 mV s−1 within the potential range of 0–0.8 V (vs. Ag/AgCl) until a stable curve was obtained. Linear sweep voltammetry (LSV) curves were measured at a scan rate of 1 mV s−1 in the same voltage range. Tafel slopes were calculated from the LSV curves at the current density range of 1–16 mA cm−2. Chronopotentiometry data were collected at a current density of 10 mA cm−2 to measure the stability of NiFe-WO4-LDH. To further investigate the electrocatalytic kinetics, electrochemical impedance spectroscopy (EIS) measurements were carried out in the frequency range from 0.01 Hz to 10 kHz at an AC voltage of 5 mV.
Results and discussion
The XRD of NiFe-CO3-LDH has a number of peaks that can be well-indexed to Ni3Fe-CO3-LDHs (PDF#40-0215) in Fig. 2a. No impurity peaks were observed in the blue line and the black line, confirming the high purity of the products. In this picture, there are no obvious characteristic peaks in the patterns of NiFe-WO4-LDH (CP or FNP). But by amplifying the vertical axis of the XRD pattern, we can clearly see that the XRD curves of NiFe-WO4-LDH (CP) and NiFe-WO4-LDH (FNP) have significant fluctuations at some special locations in Fig. 2b (no background removed). It can be seen that there are corresponding peaks at the (006), (101), (012), (110) and (113) crystal faces, but these peaks are rather messy and weak. The peak of (003) is not clearly observed. On the one hand, it may be due to the shift of the diffraction peak to the left due to the increase of the interlayer spacing, and on the other hand, the influence of low crystallinity.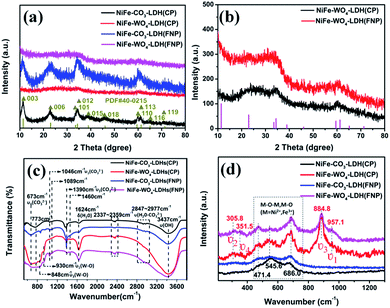 | ||
| Fig. 2 (a) XRD spectra. (b) Amplified XRD spectra of NiFe-WO4-LDH (CP) and NiFe-WO4-LDH (FNP). (c) FT-IR spectra. (d) Raman spectra. | ||
To figure out the presence of the added tungstic acid anions in the material, we performed characterizations of FT-IR and Raman. In Fig. 2c, we can observe the infrared spectra of four samples. Undoubtedly, the wide bands around 3437 cm−1 are caused by the stretching vibration of the layered hydroxyl groups and inter-layer water molecules. The shoulder peaks appearing at 2800–3000 cm−1 are attributed to the bridge vibration model of H2O–CO32−. Furthermore, we can observe the asymmetrical stretching vibration peak (ν3), the symmetrical stretching vibration peak (ν1) and the asymmetrical bending vibration peak (ν4) of CO32− at 1390, 1049, and 673 cm−1 respectively in each of the four sample species.34 This indicates that carbonate ions are present in the four samples. This is consistent with previous research by others,35,36 which suggested that carbonate ions are highly likely to exist between the layers of LDH materials in the absence of inert atmosphere protection. The band at 1624 cm−1 corresponds to the vibration of water molecules. The two bands at 930 and 848 cm−1, that appear only in NiFe-WO4-LDH (CP) and NiFe-WO4-LDH (FNP), represent ν1(W–O) and ν3(W–O), respectively. These are the characteristics of the presence of tungstate.37 It should be noted that bands with wave numbers below 1000 cm−1 in the FT-IR diagram may be present due to several reasons. The band characteristics of this region can be more clearly observed by the Raman spectrum. As can be seen from Fig. 2d, there are two large broad peaks appearing between NiFe-WO4-LDH (CP) and NiFe-WO4-LDH (FNP) at 250–400 and 800–1000 cm−1. After reviewing the literature,38–40 the peaks at 320, 357, 884, and 957 cm−1, that make up the two broad peaks mentioned above, correspond to the internal patterns of the WO42− tetrahedron ν2, ν4, ν3, and ν1 respectively. In addition, the three peaks that appeared in all samples at 400–700 cm−1 correspond to M–O–M and M–O (M = Ni2+, Fe3+) from the positively charged main metal plate of NiFe-LDH.41–45
For the anion stability problem of our materials in an alkaline environment, we conducted the following experiments. Referring to the literature,36 the materials were first taken out after soaking in 1 M KOH for 30 min, followed by centrifugation and drying. The materials before and after immersion in 1 M KOH solution were then subjected to infrared spectrum comparison analysis, and the results are shown in Fig. 3. In all of the figures below we can see that the IR spectra of the materials have not changed, so the materials can be considered stable in alkaline electrolytes.
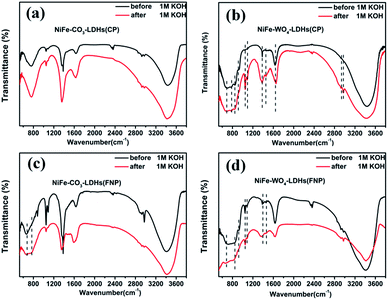 | ||
| Fig. 3 (a–d) FT-IR images before (black line) and after (red line) soaking in 1 M KOH solution of (a) NiFe-CO3-LDH (CP), (b) NiFe-WO4-LDH (CP), (c) NiFe-CO3-LDH (FNP), (d) NiFe-WO4-LDH (FNP). | ||
To further understand the structural features of these samples, their morphological features are clearly shown in Fig. 4 by TEM and HRTEM. As can be seen from Fig. 4a, NiFe-CO3-LDH (CP) shows a loose smooth sheet structure. The orientation of the sheets is diverse, with horizontal, vertical, or even inclined sheets. The corresponding HRTEM image exhibits clear lattice fringes in Fig. 4b. For better clarity of observation, some areas in Fig. 4b are enlarged and the lattice spacing is measured, which correspond to the (012), (018) and (015) crystal faces of Ni3Fe-CO3-LDHs, respectively. However, it is in very few places of NiFe-WO4-LDH (CP) that crystal lattice streaks with very short and poor quality were observed in Fig. 4d (enlarged areas of several places). Considering that the error rate is relatively large in this case, the crystal faces that these crystal lattice streaks may correspond to are not marked in the figure. There was a serious lack of lattice fringes, indicating the low crystallinity structure of NiFe-WO4-LDH (CP) that matched the XRD results. This phenomenon may also be an amorphous/crystalline hetero-phase, similar to the one reported.46
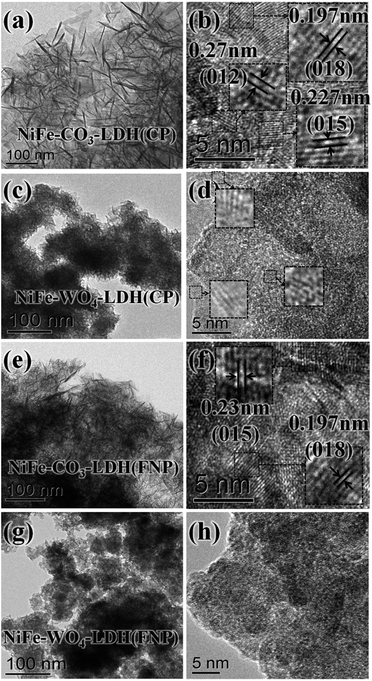 | ||
| Fig. 4 (a) and (b) TEM and HRTEM images of NiFe-CO3-LDH (CP), (c) and (d) of NiFe-WO4-LDH (CP), (e) and (f) of NiFe-CO3-LDH (FNP) and (g) and (h) of NiFe-WO4-LDH (FNP). | ||
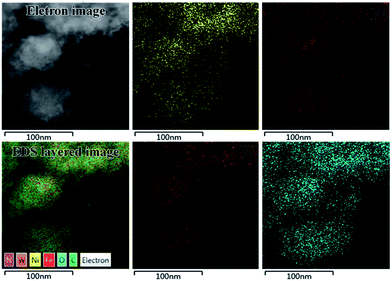
Comparing the morphology of samples prepared by CP and FNP, it can be found that NiFe-CO3-LDH (FNP) has a structure with co-existing sheets of various spatial orientations similar to NiFe-CO3-LDH (CP), while NiFe-WO4-LDH (FNP) has no clear lattice fringes even if it's HRTEM image is enlarged. By comparing the TEM images, it was found that the material made using the FNP device has a smaller unit size and is more broken, which also means that it has more edges. Compared with the HRTEM images of NiFe-WO4-LDH (CP) and NiFe-WO4-LDH (FNP), no lattice fringes were observed in NiFe-WO4-LDH (FNP), which indirectly indicates it has a more uniform internal structure. Furthermore, the distribution of the main constituent elements in NiFe-WO4-LDH (FNP) was directly observed by EDS mapping (TEM) images, as shown in Fig. 5. The results show that Ni, Fe, W and O are uniformly distributed in the material.
In order to further explore the effect of using FNP equipment on the internal structure of the materials, we performed BET characterization of the samples at 90 °C. The results revealed that the BET surface area of the materials prepared using FNP is greater than the BET surface area of the materials prepared using CP, and the most probable pore size distribution of the former is smaller than that of the latter. The BET surface areas of NiFe-CO3-LDH (FNP), NiFe-CO3-LDH (CP), NiFe-WO4-LDH (FNP) and NiFe-WO4-LDH (CP) were 351.76, 161.70, 190.05, and 125.42 m2 g−1, respectively, and the corresponding most probable pore widths were 3.83, 15.00, 3.40, and 3.82 nm, respectively. As shown in Fig. 6a, all samples showed type IV adsorption and desorption isotherms and H3 hysteresis loops, which indicates that the pore structure types on these materials are mesopores, which are mainly wedge-shaped holes made up of loose sheet material. It can be observed that the specific surface area of NiFe-WO4-LDH (CP or FNP) is smaller than that of NiFe-CO3-LDH (CP or FNP). The possible reason for this phenomenon is that the unit nanosheets in NiFe-WO4-LDH (CP or FNP) are arranged more densely and adhere to each other as shown in the TEM image in Fig. 4. From the pore size distribution curves (Fig. 6b), it can be clearly seen that the pore size distribution range of the samples made of FNP is significantly narrower than that of the samples made of CP, and the contrast between the blue line and the black line is particularly obvious. This indicates that the pore structure inside the former materials is more uniform and regular, which may be due to the more uniform size of the unit nanosheets of the materials made of FNP. In short, comparing the samples prepared by the two methods, the samples prepared by FNP has a larger specific surface area, a more uniform internal pore size distribution, and a smaller number of the most probable pore diameters. These may be attributed to the smaller and more uniform material cell size. This result is in good agreement with the topography results obtained in Fig. 4.
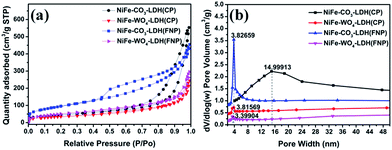 | ||
| Fig. 6 (a) Nitrogen adsorption–desorption isotherms and (b) pore size distributions of NiFe-CO3-LDH and NiFe-WO4-LDH. | ||
We analyzed the ratio of Ni to Fe in several materials by XPS and ICP and the results obtained are shown in the Table 1. From the values in the table, it can be clearly seen that the two materials prepared by the CP method maintain the molar values of nickel and iron originally designed for the experiment, while the two materials prepared by the FNP method have a larger iron percentage than the experimental design value. The cause of this phenomenon is unclear for the time being. But it should be noted that different Ni and Fe ratios may have an effect on the catalytic performance.47,48 In addition, XPS characterization is used to further explore the presence of metallic elements in the samples, as shown in Fig. 7. It can be seen well in the full spectrum (Fig. 7a) that there are only significant features of the W element in NiFe-WO4-LDH (CP or FNP) compared to NiFe-CO3-LDH (CP or FNP). By analyzing the enlarged spectra of the transition metal elements in Fig. 7b–d, it can be concluded that Ni, Fe, and W exist in the form of Ni2+, Fe3+, and W6+, respectively. The results are consistent with the conclusion from Raman spectra (Fig. 2d). As can be seen in Fig. 7b, from the Ni 2p spectrum two conclusions can be drawn. It can be seen that the positions of all the peaks of NiFe-WO4-LDH (CP or FNP) are apparently shifted toward high energy density, relative to NiFe-CO3-LDH (CP or FNP). On the other hand, also comparing the samples made by FNP and CP, it can also be found that the all Ni peaks of the materials made from FNP are weakly shifted toward high energy density. Similar conclusions are also available in the W 4f spectrum (Fig. 7d). This indicates the changes in the electronic structure of the Ni and W species. This may be due to the increase in the average valence of metal species.45 The change of Ni species may be due to two reasons, the introduction of WO42− and the use of FNP technology. However, the change of the W species is only due to the enhanced effect of the FNP synthetic process. After investigating and researching the literatures, it was found that the increase of the average valence of metal cations45,49 and the introduction of high-valent metals21,23,24,50 in a multi-metal catalyst are beneficial to OER activity. Therefore, it is speculated that the introduction of WO42− and the use of FNP, a method of preparing materials, are advantageous for the OER activity. In order to verify the supposition, the OER activity of the material was tested.
![[thin space (1/6-em)]](https://www.rsc.org/images/entities/char_2009.gif) :
:![[thin space (1/6-em)]](https://www.rsc.org/images/entities/char_2009.gif) Fe of initial experimental values and final result values
Fe of initial experimental values and final result values
| Sample name | The molar ratio of Ni![[thin space (1/6-em)]](https://www.rsc.org/images/entities/char_2009.gif) : :![[thin space (1/6-em)]](https://www.rsc.org/images/entities/char_2009.gif) Fe Fe |
||
|---|---|---|---|
| Initial experimental value | Final result value (ICP) | Final result value (XPS) | |
| NiFe-CO3-LDH (CP) | 3![[thin space (1/6-em)]](https://www.rsc.org/images/entities/char_2009.gif) : :![[thin space (1/6-em)]](https://www.rsc.org/images/entities/char_2009.gif) 1 1 |
3.05![[thin space (1/6-em)]](https://www.rsc.org/images/entities/char_2009.gif) : :![[thin space (1/6-em)]](https://www.rsc.org/images/entities/char_2009.gif) 1 1 |
3.2![[thin space (1/6-em)]](https://www.rsc.org/images/entities/char_2009.gif) : :![[thin space (1/6-em)]](https://www.rsc.org/images/entities/char_2009.gif) 1 1 |
| NiFe-WO4-LDH (CP) | 3![[thin space (1/6-em)]](https://www.rsc.org/images/entities/char_2009.gif) : :![[thin space (1/6-em)]](https://www.rsc.org/images/entities/char_2009.gif) 1 1 |
3.02![[thin space (1/6-em)]](https://www.rsc.org/images/entities/char_2009.gif) : :![[thin space (1/6-em)]](https://www.rsc.org/images/entities/char_2009.gif) 1 1 |
3.1![[thin space (1/6-em)]](https://www.rsc.org/images/entities/char_2009.gif) : :![[thin space (1/6-em)]](https://www.rsc.org/images/entities/char_2009.gif) 1 1 |
| NiFe-CO3-LDH (FNP) | 3![[thin space (1/6-em)]](https://www.rsc.org/images/entities/char_2009.gif) : :![[thin space (1/6-em)]](https://www.rsc.org/images/entities/char_2009.gif) 1 1 |
1.30![[thin space (1/6-em)]](https://www.rsc.org/images/entities/char_2009.gif) : :![[thin space (1/6-em)]](https://www.rsc.org/images/entities/char_2009.gif) 1 1 |
1.6![[thin space (1/6-em)]](https://www.rsc.org/images/entities/char_2009.gif) : :![[thin space (1/6-em)]](https://www.rsc.org/images/entities/char_2009.gif) 1 1 |
| NiFe-WO4-LDH (FNP) | 3![[thin space (1/6-em)]](https://www.rsc.org/images/entities/char_2009.gif) : :![[thin space (1/6-em)]](https://www.rsc.org/images/entities/char_2009.gif) 1 1 |
1.44![[thin space (1/6-em)]](https://www.rsc.org/images/entities/char_2009.gif) : :![[thin space (1/6-em)]](https://www.rsc.org/images/entities/char_2009.gif) 1 1 |
1.7![[thin space (1/6-em)]](https://www.rsc.org/images/entities/char_2009.gif) : :![[thin space (1/6-em)]](https://www.rsc.org/images/entities/char_2009.gif) 1 1 |
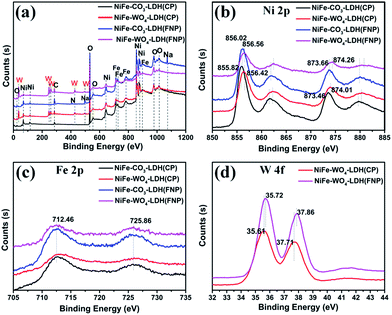 | ||
| Fig. 7 High-resolution XPS spectra of (a) full spectrum, (b) Ni 2p, (c) Fe 2p and (d) W 4f for NiFe-CO3-LDH and NiFe-WO4-LDH. | ||
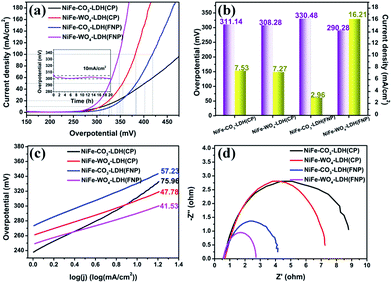
The water oxidation catalytic properties of these samples were tested in alkaline electrolytes (1 M KOH). A standard three-electrode system was used in the test. The filamentous Pt was used as the counter electrode, Ag/AgCl filled with saturated KCl solution was used as the reference electrode, and porous Ni foam was used as the working electrode substrate. The catalyst powders and the binder PTFE were uniformly mixed in an aqueous ethanol solution to form the catalyst inks, which were coated on the 1 × 1 Ni foams and vacuum dried overnight to obtain the working electrodes. Firstly, cyclic voltammetry (CV) was conducted in O2 saturated 1 M KOH to make the reaction system stable. Next, linear sweep voltammetry (LSV) with IR correction was carried out and at a scan rate of 1 mV s−1. Fig. 8b was obtained by organizing the LSV data presented in Fig. 6a. Similarly, using the Tafel formula (η = a + b![[thin space (1/6-em)]](https://www.rsc.org/images/entities/char_2009.gif) lg
lg![[thin space (1/6-em)]](https://www.rsc.org/images/entities/char_2009.gif) J) to calculate the partial LSV data in the above figure, the Tafel slope of Fig. 8c could be obtained. In Fig. 8b, it can be seen very intuitively that NiFe-WO4-LDH (FNP) has the maximum current density value of 16.2 mA cm−2 at 300 mV overpotential and the minimum overpotential value 290.3 mV required to reach a current density of 10 mA cm−2, compared to other samples. From the above data alone, it can be seen that the OER electrocatalytic activity of the sample is optimal among the four materials measured. The reaction kinetic characteristics of these materials were further analyzed by Tafel slope and electrochemical impedance spectroscopy (EIS). In Fig. 8c, it can be seen that NiFe-WO4-LDH (FNP) has a smaller Tafel slope value of 41.5 mV dec−1, compared to 76.0, 47.8, and 57.2 mV dec−1 of NiFe-CO3-LDH (CP), NiFe-WO4-LDH (CP), and NiFe-CO3-LDH (FNP). In addition, the EIS image in Fig. 8d shows that the semicircular arc radii of NiFe-CO3-LDH (CP), NiFe-WO4-LDH (CP), NiFe-CO3-LDH (FNP) and NiFe-WO4-LDH (FNP) are successively decreased, indicating that their charge-transfer resistances are successively reduced. The decrease in the charge-transfer resistance suggests the improvement in the OER activity,51,52 and the NiFe-WO4-LDH (FNP) exhibits much lower charge-transfer resistance, which suggests its high OER activity. The above results demonstrate once again that NiFe-WO4-LDH (FNP) has an advantage in the electrocatalytic oxygen evolution reaction.
J) to calculate the partial LSV data in the above figure, the Tafel slope of Fig. 8c could be obtained. In Fig. 8b, it can be seen very intuitively that NiFe-WO4-LDH (FNP) has the maximum current density value of 16.2 mA cm−2 at 300 mV overpotential and the minimum overpotential value 290.3 mV required to reach a current density of 10 mA cm−2, compared to other samples. From the above data alone, it can be seen that the OER electrocatalytic activity of the sample is optimal among the four materials measured. The reaction kinetic characteristics of these materials were further analyzed by Tafel slope and electrochemical impedance spectroscopy (EIS). In Fig. 8c, it can be seen that NiFe-WO4-LDH (FNP) has a smaller Tafel slope value of 41.5 mV dec−1, compared to 76.0, 47.8, and 57.2 mV dec−1 of NiFe-CO3-LDH (CP), NiFe-WO4-LDH (CP), and NiFe-CO3-LDH (FNP). In addition, the EIS image in Fig. 8d shows that the semicircular arc radii of NiFe-CO3-LDH (CP), NiFe-WO4-LDH (CP), NiFe-CO3-LDH (FNP) and NiFe-WO4-LDH (FNP) are successively decreased, indicating that their charge-transfer resistances are successively reduced. The decrease in the charge-transfer resistance suggests the improvement in the OER activity,51,52 and the NiFe-WO4-LDH (FNP) exhibits much lower charge-transfer resistance, which suggests its high OER activity. The above results demonstrate once again that NiFe-WO4-LDH (FNP) has an advantage in the electrocatalytic oxygen evolution reaction.
Comparing the Tafel slope values and the charge-transfer resistance of NiFe-CO3-LDH (CP or FNP) and NiFe-WO4-LDH (CP or FNP) we can find that the presence of WO42− can adjust the dynamic properties of the materials. Also comparing the above two parameters of NiFe-CO3/WO4-LDH (CP) and NiFe-CO3/WO4-LDH (FNP), we can also find that the synthesis method using FNP can also optimize the dynamic properties of the materials. This also shows that the optimal OER activity of NiFe-WO4-LDH (FNP) compared to other control groups is attributed to the simultaneous effect of WO42− and FNP. The durability of the material was tested using chronopotentiometry for 20 h (current density maintained at 10 mA cm−2). From the stability test in Fig. 8a, it can be observed that the potential of the material during the 20 h has no apparent upward trend and has been kept at between 300 and 305 mV, which indicates that the material has good electrocatalytic stability for OER. In addition, we also compared the OER catalytic activity values of the above samples with some of the NiFe-based (oxy)hydroxide electrocatalysts previously reported (Table 2). Thus, NiFe-WO4-LDH (FNP) possesses well comparable electrocatalytic activity and stability for the OER.
| Catalyst | Electrolyte | Working electrode | Mass-loading (mg cm−2) | η 10 (mV) | J 300 (mA cm−2) | Tafel slope (mV dec−1) | Stability (h) | Reference |
|---|---|---|---|---|---|---|---|---|
| a η 10 means the overpotential to achieve the current density of 10 mA cm−2; J300 means the current density at the overpotential of 300 mV; ∼ means the estimate from the graph because no clear value is given in the reference. | ||||||||
| NiFe-LDH-NS | 1 M KOH | GCE | 0.07 | 302 | 9.35 | 40 | 13 | 8 |
| NiFe-LDH-B | 1 M KOH | GCE | 0.07 | 347 | 2.07 | 67 | — | 8 |
| NiFeMn-LDH | 1 M KOH | CFP | 0.2 | ∼260 | ∼23 | 47 | 15 | 16 |
| NiFe-LDH | 1 M KOH | CFP | 0.2 | ∼355 | ∼4 | 65 | — | 16 |
| NiMn-LDH | 1 M KOH | CFP | 0.2 | ∼370 | ∼2 | 70 | — | 16 |
| NiFeAl-LDH | 1 M KOH | GCE | 0.2 | ∼355 | ∼1 | 50 | 18 | 17 |
| NiFe-LDH | 1 M KOH | GCE | 0.2 | >400 | ∼0.8 | 97 | — | 17 |
| NiCoFe-LDH | 1 M KOH | Ni | 0.25 | 220 | >40 | 42 | 11 | 18 |
| NiFe-LDH | 1 M KOH | Ni | 0.25 | 242 | >40 | 55 | — | 18 |
| NiFeV-LDH | 1 M KOH | Ni | — | 231 | >200 | 39.4 | 15 | 19 |
| NiFe-LDH | 1 M KOH | Ni | — | 278 | ∼20 | 65.7 | — | 19 |
| NiFeCr-LDH | 1 M KOH | GCE | 0.2 | 280 | ∼11 | 131 | 6 | 20 |
| NiFe-LDH | 1 M KOH | GCE | 0.2 | ∼320 | ∼5 | 144 | — | 20 |
| NiFe-MoO4-LDH | 1 M KOH | GCE | 0.28 | 280 | — | 40 | 8 | 23 |
| NiFe-LDH | 1 M KOH | GCE | 0.28 | 315 | — | 40 | — | 23 |
| H2PO2−/NiFe-LDH | 1 M KOH | CFP | 0.2 | ∼240 | >25 | 37.7 | 8 | 39 |
| CO32−/NiFe-LDH | 1 M KOH | CFP | 0.2 | ∼340 | ∼5 | 44.3 | 8 | 39 |
| NiFe-WO4-LDH (FNP) | 1 M KOH | Ni | 0.1 | 290.3 | 16.2 | 41.6 | 20 | This work |
Conclusions
In summary, we have demonstrated a simple but efficient FNP synthetic strategy to produce crystallized NiFe-CO3-LDH and amorphous NiFe-WO4-LDH with high surface area. The results show that the introduction of WO42− and the adoption of the FNP method all have a modification effect on the OER activity. Therefore, NiFe-WO4-LDH (FNP) shows a relatively optimal OER activity. Through various structural characterization means, the introduction of WO42− into NiFe-LDH has led to the destruction of the low crystallinity of materials, the synechia of nanoplatelets, and the modulation of the electronic structure of Ni species. The FNP strategy not only allows WO42− to be uniformly distributed in the NiFe-LDH but also allows the material to have a larger specific surface area, a smaller pore distribution range, and a smaller most measurable pore size. This results in that NiFe-WO4-LDH (FNP) has relatively optimal charge transfer ability and more edge active sites compared to other control groups. Therefore, by adjusting the experimental parameters the FNP synthesis method has been proved to be able to optimize the crystallization process of the materials to regulate the structural properties of materials. This work provides a new, simple, efficient and scalable strategy to design advanced electrocatalysts.Conflicts of interest
The authors declare no conflicts of interests.Acknowledgements
The work was supported by Program for Changjiang Scholars and Innovative Research Team in University (No. IRT_15R46), the Program of Science and Technology Innovation Team in Bingtuan (No. 2015BD003) and National Natural Science Foundation of China (No. 21476143, 21661027).References
- Z. W. Seh, J. Kibsgaard, C. F. Dickens, I. Chorkendorff, J. K. Nørskov and T. F. Jaramillo, Science, 2017, 355, eaad4998 CrossRef PubMed.
- M. W. Kanan and D. G. Nocera, Science, 2008, 39, 1072–1075 CrossRef PubMed.
- Z.-L. Wang, D. Xu, J.-J. Xu and X.-B. Zhang, Chem. Soc. Rev., 2014, 43, 7746–7786 RSC.
- V. R. Stamenkovic, D. Strmcnik, P. P. Lopes and N. M. Markovic, Nat. Mater., 2016, 16, 57–69 CrossRef PubMed.
- D. Zhou, Z. Cai, X. Lei, W. Tian, Y. Bi, Y. Jia, N. Han, T. Gao, Q. Zhang, Y. Kuang, J. Pan, X. Sun and X. Duan, Adv. Energy Mater., 2017, 1701905, DOI:10.1002/aenm.201701905.
- B. M. Hunter, H. B. Gray and A. M. Muller, Chem. Rev., 2016, 116, 14120–14136 CrossRef CAS PubMed.
- M.-I. Jamesh and X. Sun, J. Power Sources, 2018, 400, 31–68 CrossRef CAS.
- M. Gong, Y. Li, H. Wang, Y. Liang, J. Z. Wu, J. Zhou, J. Wang, T. Regier, F. Wei and H. Dai, J. Am. Chem. Soc., 2013, 135, 8452–8455 CrossRef CAS PubMed.
- X. Zou, A. Goswami and T. Asefa, J. Am. Chem. Soc., 2013, 135, 17242–17245 CrossRef CAS PubMed.
- F. Song and X. Hu, Nat. Commun., 2014, 5, 4477 CrossRef CAS PubMed.
- L. Han, S. Dong and E. Wang, Adv. Mater., 2016, 28, 9266–9291 CrossRef CAS PubMed.
- M. Gong and H. Dai, Nano Res., 2014, 8, 23–39 CrossRef.
- Z. Lu, W. Xu, W. Zhu, Q. Yang, X. Lei, J. Liu, Y. Li, X. Sun and X. Duan, Chem. Commun., 2014, 50, 6479–6482 RSC.
- Y. Zhang, Q. Shao, Y. Pi, J. Guo and X. Huang, Small, 2017, 13, 1700355 CrossRef PubMed.
- L. Yu, J. F. Yang, B. Y. Guan, Y. Lu and X. W. D. Lou, Angew. Chem., Int. Ed., 2018, 57, 172–176 CrossRef CAS PubMed.
- M. Yu, S. Zhou, Z. Wang, J. Zhao and J. Qiu, Nano Energy, 2018, 44, 181–190 CrossRef CAS.
- L. Yu, H. Zhou, J. Sun, F. Qin, F. Yu, J. Bao, Y. Yu, S. Chen and Z. Ren, Energy Environ. Sci., 2017, 10, 1820–1827 RSC.
- Z. Lu, L. Qian, Y. Tian, Y. Li, X. Sun and X. Duan, Chem. Commun., 2016, 52, 908–911 RSC.
- H. Liu, Y. Wang, X. Lu, Y. Hu, G. Zhu, R. Chen, L. Ma, H. Zhu, Z. Tie, J. Liu and Z. Jin, Nano Energy, 2017, 35, 350–357 CrossRef CAS.
- X. Long, S. Xiao, Z. Wang, X. Zheng and S. Yang, Chem. Commun., 2015, 51, 1120–1123 RSC.
- K. N. Dinh, P. Zheng, Z. Dai, Y. Zhang, R. Dangol, Y. Zheng, B. Li, Y. Zong and Q. Yan, Small, 2017, 1703257, DOI:10.1002/smll.201703257.
- Y. Yang, L. Dang, M. J. Shearer, H. Sheng, W. Li, J. Chen, P. Xiao, Y. Zhang, R. J. Hamers and S. Jin, Adv. Energy Mater., 2018, 8, 1703189 CrossRef.
- B. Zhang, X. Zheng, O. Voznyy, R. Comin, M. Bajdich, M. Garcia-Melchor, L. Han, J. Xu, M. Liu, L. Zheng, F. P. G. d. Arquer, C. T. Dinh, F. Fan, M. Yuan, E. Yassitepe, N. Chen, T. Regier, P. Liu, Y. Li, P. D. Luna, A. Janmohamed, H. L. Xin, H. Yang, A. Vojvodic and E. H. Sargent, Science, 2016, 352, 333–337 CrossRef CAS PubMed.
- P. F. Liu, S. Yang, L. R. Zheng, B. Zhang and H. G. Yang, Chem. Sci., 2017, 8, 3484–3488 RSC.
- N. Han, F. Zhao and Y. Li, J. Mater. Chem. A, 2015, 3, 16348–16353 RSC.
- R. Liu, C. Sosa, Y.-W. Yeh, F. Qu, N. Yao, R. K. Prud'homme and R. D. Priestley, J. Mater. Chem. A, 2014, 2, 17286–17290 RSC.
- W. S. Saad and R. K. Prud'homme, Nano Today, 2016, 11, 212–227 CrossRef CAS.
- C. Wang, F. Yu, M. Zhu, Y. Shi, J. Dan, Y. Lv, X. Guo and B. Dai, Chem. Eng. Res. Des., 2018, 134, 476–486 CrossRef CAS.
- B. K. Johnson and R. K. Prud'homme, AIChE J., 2003, 49, 2264–2282 CrossRef CAS.
- X.-G. Wang, Q. Cheng, Y. Yun and X.-Z. Zhang, Angew. Chem., Int. Ed., 2018, 7836, DOI:10.1002/anie.201803766.
- M. Luo, Z. Cai, C. Wang, Y. Bi, L. Qian, Y. Hao, L. Li, Y. Kuang, Y. Li, X. Lei, Z. Huo, W. Liu, H. Wang, X. Sun and X. Duan, Nano Res., 2017, 10, 1732–1739 CrossRef CAS.
- D. Zhao, C. Wang, F. Yu, Y. Shi, P. Cao, J. Dan, K. Chen, Y. Lv, X. Guo and B. Dai, Nanomaterials, 2018, 8(8), 620 CrossRef PubMed.
- M. Zhang, F. Yu, J. Li, K. Chen, Y. Yao, P. Li, M. Zhu, Y. Shi, Q. Wang and X. Guo, Catalysts, 2018, 8, 363 CrossRef.
- J. Theo Kloprogge, D. Wharton, L. Hickey and R. L. Frost, Am. Mineral., 2002, 87, 623–629 CrossRef.
- B. M. Hunter, W. Hieringer, J. R. Winkler, H. B. Gray and A. M. Müller, Energy Environ. Sci., 2016, 9, 1734–1743 RSC.
- L. Dang, H. Liang, J. Zhuo, B. K. Lamb, H. Sheng, Y. Yang and S. Jin, Chem. Mater., 2018, 30, 4321–4330 CrossRef CAS.
- C. Vaysse, L. Guerlou-Demourgues, A. Demourgues, F. Lazartigues, D. Fertier and C. Delmas, J. Mater. Chem., 2002, 12, 1035–1043 RSC.
- M. Miroslaw, J. Solid State Chem., 1997, 129, 287–297 CrossRef.
- Y. K. Voron'ko, A. A. Sobor, S. N. Ushakov and L. I. Tsymbal, Inorg. Mater., 2000, 36, 947–953 CrossRef.
- Y. K. Voronko, A. A. Sobol, V. E. Shukshin, P. P. Fedorov, A. E. Kokh and N. G. Kononova, Inorg. Mater., 2009, 45, 182–188 CrossRef CAS.
- Z. Chen, L. Cai, X. Yang, C. Kronawitter, L. Guo, S. Shen and B. E. Koel, ACS Catal., 2018, 8, 1238–1247 CrossRef CAS.
- Y. Hou, M. R. Lohe, J. Zhang, S. Liu, X. Zhuang and X. Feng, Energy Environ. Sci., 2015, 9, 478–483 RSC.
- Y.-J. Ye, N. Zhang and X.-X. Liu, J. Mater. Chem. A, 2017, 5, 24208–24216 RSC.
- M. W. Louie and A. T. Bell, J. Am. Chem. Soc., 2013, 135, 12329–12337 CrossRef CAS PubMed.
- C. Xie, Y. Wang, K. Hu, L. Tao, X. Huang, H. Jia and S. Wang, J. Mater. Chem. A, 2016, 5, 87–91 RSC.
- N. Yang, H. Cheng, X. Liu, Q. Yun, Y. Chen, B. Li, B. Chen, Z. Zhang, X. Chen, Q. Lu, J. Huang, Y. Huang, Y. Zong, Y. Yang, L. Gu and H. Zhang, Adv. Mater., 2018, e1803234, DOI:10.1002/adma.201803234.
- D. Friebel, M. W. Louie, M. Bajdich, K. E. Sanwald, Y. Cai, A. M. Wise, M.-J. Cheng, D. Sokaras, T.-C. Weng, R. Alonso-Mori, R. C. Davis, J. R. Bargar, J. K. Nørskov, A. Nilsson and A. T. Bell, J. Am. Chem. Soc., 2015, 137, 1305–1313 CrossRef CAS PubMed.
- B. M. Hunter, J. R. Winkler and H. B. Gray, Molecules, 2018, 23, 903 CrossRef PubMed.
- L. Qian, Z. Lu, T. Xu, X. Wu, Y. Tian, Y. Li, Z. Huo, X. Sun and X. Duan, Adv. Energy Mater., 2015, 5, 1500245 CrossRef.
- Y. Pi, Q. Shao, P. Wang, F. Lv, S. Guo, J. Guo and X. Huang, Angew. Chem., 2017, 56, 4502–4506 CrossRef CAS PubMed.
- Y. Li, H. Zhang, M. Jiang, Q. Zhang, P. He and X. Sun, Adv. Funct. Mater., 2017, 27, 1702513 CrossRef.
- M. I. Jamesh, J. Power Sources, 2016, 333, 213–236 CrossRef CAS.
| This journal is © The Royal Society of Chemistry 2019 |

