The promotional effect of Mn on Fe-based Fischer–Tropsch catalysts for the synthesis of C5+ hydrocarbons
Juan
Li
a,
Liangpeng
Wu
a,
Shaohong
Zhang
a,
Jianbo
Wen
b,
Mingwei
Liu
c,
Chenguang
Wang
*a and
Xinjun
Li
 *a
*a
aKey Laboratory of Renewable Energy, Guangzhou Institute of Energy Conversion, Chinese Academy of Sciences, Guangzhou 510640, P. R. China. E-mail: wangcg@ms.giec.ac.cn; lixj@ms.giec.ac.cn
bBeijing Daking Eastern Technology Co., Ltd., Beijing 101300, P. R. China
cGuangzhou Nanfeng Environment Technology Co., Ltd., Guangzhou 510335, P. R. China
First published on 17th October 2018
Abstract
Fe–Mn oxide catalysts with different morphologies were synthesized by a one-pot hydrothermal method and applied to the Fischer–Tropsch synthesis reaction. Unpromoted Fe2O3 presents a spindle-like shape. The increase of the Mn/Fe atomic ratio in the catalysts from 5/100 to 10/100 and then to 20/100 causes the morphology transformation of the Fe–Mn oxides from spindles (FeMn5) to cubes (FeMn10) and then to nanoparticles (FeMn20). Although the Mn has a negative influence on the catalytic stability, the introduction of a Mn promoter in the Fe-based catalysts can effectively suppress the CH4 formation and facilitate the carbon chain growth. The FeMn5 spindle catalyst with a low Mn content exhibits a higher selectivity for C2–C4 short-chain hydrocarbons, while the FeMn10 cube catalyst with a relatively high Mn content displays a much better selectivity for C5+ long-chain hydrocarbons. This demonstrates that the amount of Mn promoter in the synthesized Fe–Mn oxide catalysts has a great influence on the distribution of hydrocarbon products.
1. Introduction
Fischer–Tropsch synthesis (FTS) provides a promising route for the direct conversion of coal-, biomass-, and natural gas-derived syngas (a mixture of H2 and CO) to liquid fuels and chemicals.1–3 The catalyst plays a critical role in the FTS reaction. Presently, only Fe and Co based catalysts have been used for practical industrial processes. Because of high FTS activity as well as excellent water gas shift (WGS) activity, Fe-based catalysts have attracted much attention for the production of light olefins (C2–C4) and C5+ hydrocarbons using syngas with a low H2/CO ratio.4–6Increasing the selectivity of the desired products has long been a challenge in FTS since typical FTS products obey the Anderson–Schultz–Flory (ASF) distribution, with a wide spectrum ranging from light gases (C1–C4) to heavy waxes (C30+).7 To improve the selectivity of the target products, Fe-based catalysts are typically modified with promoters, such as potassium,8–10 magnesium,11 manganese,12,13 copper,14 zinc,15,16 and so on. Promoters are expected to modify the electronic character of the active Fe species in the form of electron transfer or electronic interaction, thus strengthening the Fe–C bond and weakening the Fe–H and C–O bonds.17,18 Therefore, the addition of appropriate amounts of promoter can suppress the formation of CH4, inhibit the surface carbon hydrogenation and promote the carbon chain growth.
Manganese has been widely used as an efficient promoter for Fe-based FTS catalysts. It was reported that incorporation of a small amount of manganese into the catalyst can enhance the selectivities of C2–C4 olefins and C5+ heavy hydrocarbons, and at the same time suppress the formation of undesired methane in FTS.13,19–21 Compared with other promoters, manganese may cause complex structural and electronic effects. Many studies found that a solid solution compound was formed over the coprecipitated Fe–Mn catalyst,20–22 resulting in a Mn-induced textural structure variation, which could affect the reduction and carburization behaviors of Fe catalysts. Furthermore, manganese was also found to promote the dispersion of active Fe components and make the catalyst less prone to deactivation through carbon deposition.23 Although the function of manganese in facilitating light olefin formation has been widely accepted, some inconsistencies regarding the effects of manganese on the FTS activity and the hydrocarbon selectivity still exist. Li et al. observed that the addition of a manganese promoter improved the FTS activity; meanwhile the selectivities to C2–C4 olefins and C5+ hydrocarbons were increased with the increase in the Mn/Fe atomic ratio from 0 to 0.25.21 Liu et al. reported a manganese-modified Fe3O4 microsphere catalyst, which effectively converted syngas to C2–C4 olefins with a selectivity up to 60.1%, but presented a decreased FTS activity and C5+ selectivity.12 In the meantime, Xu et al. found that incorporation of a small amount of Mn (Mn/Fe ≤ 0.01) into the catalyst resulted in an increase in the C5+ yield and C2–C4 olefin selectivity without any loss in FTS activity.19 The discrepancies in the promotional effect of manganese may be due to the different catalyst preparation, pretreatment and FTS conditions.24 In addition, the selectivity for liquid fuels over Fe–Mn oxide catalysts needs to be further improved, and the promotion mechanism of manganese is still not completely clear. Therefore, further investigation is needed to illustrate the effects of manganese on Fe-based catalysts for the synthesis of C5+ hydrocarbons.
Herein, we report the design and synthesis of Fe–Mn oxide catalysts with different morphologies and tunable Mn/Fe ratios by a one-pot hydrothermal method for enhancing the selectivity to C5+ hydrocarbons. The effects of manganese addition on the crystal structure, morphology, reducibility, and bulk phase and surface compositions of the catalysts were examined by physical and chemical characterization techniques. The correlation between the textural structure and the FTS performance of Fe–Mn oxide catalysts was investigated in order to obtain the catalyst design concept.
2. Experimental
2.1 Catalyst preparation
The Fe–Mn oxide catalysts with different morphologies were prepared by a one-pot hydrothermal method. In brief, 50% Mn(NO3)2 solution and Fe(NO3)3·9H2O (3.0 g) with a desired Mn/Fe atomic ratio of x/100 (x = 0, 5, 10 and 20) were dissolved in 40 mL of deionized water containing polyvinylpyrrolidone (PVP, 1 g), followed by addition of potassium acetate anhydrous (KAC, 2.4 g) and ethylenediamine (7.0 mL). Then, the mixture was sealed into a Teflon-lined stainless autoclave and heated at 200 °C for 10 h. Finally, Fe–Mn oxide catalysts were obtained after washing with deionized water and drying at 60 °C in an air oven. The compositions of the final obtained catalysts were xMn/100Fe (x = 0, 5, 10 and 20) in the atomic ratio, which were labelled Fe2O3, FeMn5, FeMn10, and FeMn20, respectively.2.2 Catalyst characterization
The powder X-ray diffraction (XRD) pattern was recorded using a PANalytical X'Pert Pro diffractometer with a Cu Kα radiation source operated at 40 kV and 40 mA. The surface area (SA) and porosity were analyzed by N2 adsorption–desorption using a SI-MP-10 automated system at liquid nitrogen temperature after the samples were degassed in a vacuum at 150 °C for 10 h. The morphology of the sample was observed using a Hitachi S-4800 field emission scanning electron microscope (FESEM) and a FEI Tecnai G20 high-resolution electron microscope (HRTEM). The actual atomic ratios of Mn/Fe for the Fe–Mn catalysts were measured by using an energy-dispersive X-ray analyzer (EDX) attached on the FESEM. In situ X-ray photoelectron spectroscopy (XPS) was performed using a Thermo ESCALAB 250XI with a monochromatized Al Kα source (1486.6 eV). The powder sample was mounted on a sample holder placed in the XPS treatment chamber, where the sample was in situ reduced at 300 °C for 2 h using syngas and then cooled to room temperature under the same flow. Afterwards, the sample was transferred to the XPS analysis chamber to record XPS spectra. The C 1s line was taken as an internal standard at 284.8 eV. Temperature-programmed reduction (TPR) measurements were conducted with an Autosorb-iQ-C fully automatic physical/chemical adsorption analyzer equipped with a TCD detector. 50 mg as-prepared samples were loaded and pretreated with Ar or He at 200 °C for 1 h to remove the adsorbed carbonates and hydrates. After cooling down to room temperature and introducing the reduction agent (10% H2/Ar for H2-TPR, or 10% CO/He for CO-TPR, 30 mL min−1), the samples were then heated to 900 °C at a ramp of 10 °C min−1.2.3 Fischer–Tropsch synthesis reaction
The FTS reaction was conducted in a stainless steel fixed bed reactor (10 mm inner diameter). The catalyst (1.0 g) was mixed with 1.0 g of quartz granules to prevent hot spot generation. Prior to the reaction, the catalyst was reduced in situ by syngas (H2/CO = 1, space velocity of 3000 mL (gcat h)−1) at 300 °C for 12 h. After the reduced catalyst was cooled to 150 °C, the pressure was gradually increased to 2.0 MPa, and then the temperature was slowly raised to 280 °C and maintained for 48 h. The tail gas was analyzed online by gas chromatograph (GC, Agilent, 7890 A) equipped with a TCD and a FID detectors. The liquid products in the trap were collected and analyzed offline using a Shimadzu GC-2010 with a PONA capillary column connected to a FID detector. 5% N2 in the feed gas was used as the internal standard to calculate CO conversion. The product selectivity was calculated on a carbon basis.3. Results and discussion
3.1 Characterization of the Fe–Mn oxide catalysts
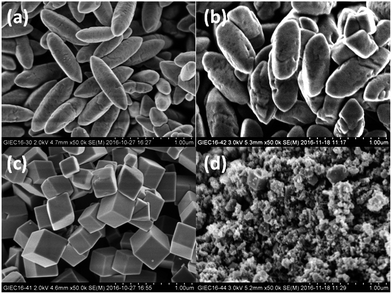
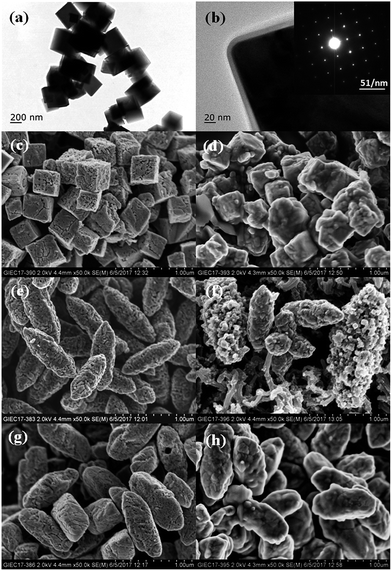
Fig. 1 shows the SEM images of the as-prepared Fe2O3, FeMn5, FeMn10 and FeMn20 catalysts. The Fe2O3 presents a uniformly spindle-like shape, with a mean length of ∼800 nm and a width of ∼300 nm. It is found from the SEM images that the added amount of Mn component during hydrothermal synthesis causes the morphology and microstructure transformation of the Fe–Mn oxides. Irregular truncated spindles are observed for FeMn5 with a Mn/Fe atomic ratio of 5/100, while uniform cubes are obtained for FeMn10 with a Mn/Fe atomic ratio of 10/100. Further increasing the Mn/Fe atomic ratio to 20/100, aggregations of lots of nanoparticles and a few cubes are formed for FeMn20. The actual Mn/Fe atomic ratios determined by EDX analysis are 3.5/100 for FeMn5, 9.6/100 for FeMn10 and 20.6/100 for FeMn20, which are close to the set content values.The detailed morphological and microstructural features of the FeMn10 catalyst are further investigated by TEM and HRTEM combined with selected area electron diffraction (SAED) analysis techniques. The typical TEM and HRTEM images are shown in Fig. 2a and b. FeMn10 displays the cube structure with an average size of ∼300 nm, which is consistent with the observation from SEM images. From the corresponding HRTEM images, it is observed that an∼8 nm carbon layer is uniformly and continuously coated on the surface of a single FeMn10 cube. The formation of this thin carbon layer can be related to the pyrolysis of the nonionic surfactant PVP, which is usually employed as a ligand to stabilize the synthesized nanostructure.13,25 The SAED pattern taken from an individual cube structure (the inset in Fig. 1b) shows the presence of sharp and well separated spots, indicating the high crystallization and single crystalline nature of the FeMn10 cube.26,27 SEM images of the Fe2O3, FeMn5 and FeMn10 catalysts after reduction and after the FTS reaction are shown in Fig. 2c–h. Besides showing a rough surface, the three catalysts still retain the original morphology after reduction in a flow of syngas. The surface roughness after reduction further indicates that iron carbide species are formed on the surface for the syngas-reduced samples, as verified by the subsequent XRD analysis in Fig. 3b. After the FTS reaction for 48 h, the FeMn5 and the FeMn10 catalysts still present the complete spindle-like and cubic morphology, respectively. However, the spindles become unstable and begin to collapse for the unpromoted Fe2O3 after the FTS reaction for 48 h. The results indicate that the structural stability of the synthesized Fe-based catalysts was increased because of the addition of a small amount of Mn promoter.
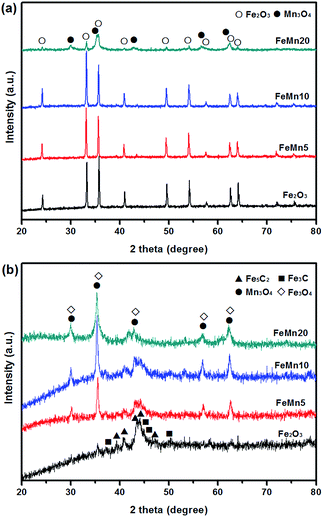
The crystal phase compositions of the Fe–Mn oxide catalysts are examined by XRD analysis. Fig. 3a shows that all the diffraction peaks for the as-prepared Fe2O3, FeMn5 and FeMn10 samples can be indexed to the pure hematite (α-Fe2O3) phase (JCPDS 33-0664). Among these three samples, no other peaks belonging to impurities or Mn species are observed in the XRD patterns, indicating that the final product is of high purity and single phase. The disappearance of diffraction peaks for the manganese phase is probably due to the formation of solid solution. It is suggested that an appropriate amount of Mn ions can be dissolved in the hematite phase due to similar ion radii of Mn3+ (the radius of Mn3+ = 0.66 Å) and Fe3+ (the radius of Fe3+ = 0.64 Å).21,28 With increasing the Mn/Fe atomic ratio to 20/100 for FeMn20, a mixed crystal phase of cubic Mn3O4 (JCPDS 13-0162) and hematite (JCPDS 33-0664) appears. For Fe-based catalysts, iron carbide is believed to be an active phase in the FTS process. Based on this consideration, the XRD patterns of the Fe–Mn oxide catalysts after being reduced with syngas (H2/CO = 1) at 300 °C and 0.1 MPa for 12 h are presented in Fig. 3b. As shown, the Fe2O3 catalyst is mainly composed of Fe5C2 (JCPDS 51-0997) and Fe3C (JCPDS 65-2411) phases after the syngas reduction. However, the coexistence of Fe3O4 (JCPDS 65-3107), Mn3O4 (JCPDS 13-0162) and FeCx phases can be found for the Mn-introduced catalysts. This result suggests that the introduction of the Mn promoter stabilizes the iron oxide phases and thus suppresses the catalyst carburization in the syngas flow, which coincides with the results reported by other groups.21,22,24
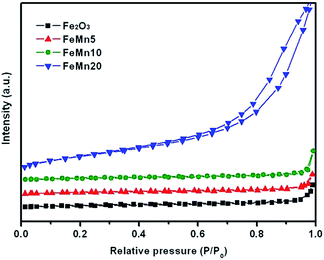
Fig. 4 shows the nitrogen adsorption–desorption isotherms of the prepared Fe–Mn oxide catalysts. Except for FeMn20, the isotherms for the other three samples exhibit typically type-II curves, which are normally obtained with nonporous adsorbents,12,29 suggesting that no pores exist inside the fresh Fe2O3, FeMn5 and FeMn10 samples. The textual properties and elemental compositions of the prepared Fe–Mn oxide catalysts are summarized in Table 1. The Fe2O3, FeMn5 and FeMn10 samples have a similar BET surface area and pore volume, which are calculated to be about 6 m2 g−1 and 0.030 cm3 g−1, respectively. FeMn20 shows a higher surface area of 65 m2 g−1 and pore volume of 0.212 cm3 g−1, which is derived from the piled pore of secondary particles, as confirmed by SEM analysis in Fig. 1d.
| Catalysts | BET surface area (m2 g−1) | Pore volume (cm3 g−1) | Average pore size (nm) | Mn/Fe atomic ratio (100%) | |
|---|---|---|---|---|---|
| Bulk from EDX | Surface from XPS | ||||
| a The values of the Mn/Fe atomic ratio in brackets were calculated for the activated catalysts in syngas at 300 °C for 2 h. | |||||
| Fe2O3 | 6 | 0.026 | 17.2 | 0 | 0 |
| FeMn5 | 5 | 0.023 | 17.4 | 3.5 | 23.5 (17.0)a |
| FeMn10 | 6 | 0.034 | 20.7 | 9.6 | 32.8 (19.5)a |
| FeMn20 | 65 | 0.212 | 13.1 | 20.6 | 22.3 (23.1)a |
XPS analyses were used to characterize the surface bonding state and chemical composition in the synthesized Fe–Mn oxide catalysts. The XPS spectra recorded are shown in Fig. 5. The signals corresponding to Fe 2p, Mn 2p, O 1s, and C 1s can be detected in the full-survey-scan spectrum for the Fe–Mn oxides (Fig. 5a), indicating that Mn element has been successfully introduced into the synthesized nanostructures. The Fe 2p3/2 and Fe 2p1/2 peaks centered at 710.6 and 723.9 eV along with two shake-up satellite peaks at about 718.8 and 732.6 eV are in good agreement with the standard Fe2O3 phase, as shown in Fig. 5b. No obvious peaks from Fe0 and/or Fe2+ were observed, indicating that Fe2O3 is the only iron species formed on the surface of the fresh Fe–Mn oxides. This result is consistent with the aforementioned XRD analysis in Fig. 3a. The Mn 2p spectra can be fitted with two peaks located at 641.4 and 653.0 eV (Fig. 5c), corresponding to Mn 2p3/2 and Mn 2p1/2, respectively. In FeMn20, a weak satellite peak derived from MnO is also observed at about 647 eV. Because Mn(II) and Mn(III) have almost the same Mn 2p bonding energy, Mn 3s peak splitting is generally used to distinguish Mn oxidation states (energy separation for MnO (Mn2+) ≈ 6.0 eV and Mn2O3 (Mn3+) ≥ 5.3 eV). It can be seen from Mn 3s spectra in Fig. 5d that FeMn5 and FeMn10 exhibit an energy separation of 5.5 eV, and FeMn20 displays a broadened 3s peak with an energy separation of 5.5–6.1 eV. The Mn 3s spectra reveal that manganese exists in the form of Mn(III) for both the FeMn5 and FeMn10 oxides, but exists in two oxidation states of Mn(II) and Mn(III) for FeMn20. The XPS results coupled with the XRD analysis further demonstrate that Fe–Mn hematite oxide solid solutions are formed in the FeMn5 and FeMn10 catalysts. Furthermore, it can also be seen from the XPS analysis (Table 1) that the Mn/Fe atomic ratio on the surface and in the bulk is very close for FeMn20, whereas those on the surface for the FeMn5 and FeMn10 catalysts are much larger than that in the bulk. Especially for FeMn5, a surface to bulk atomic ratio of 23.5/3.5 indicates that manganese highly enriches on the surface.
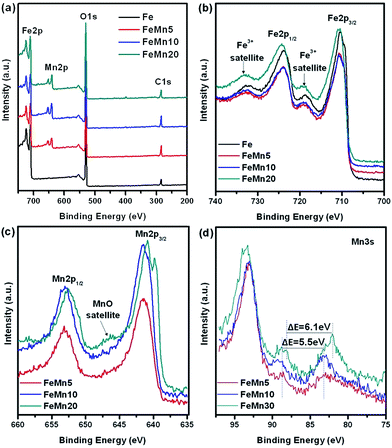 | ||
| Fig. 5 XPS spectra of the synthesized Fe–Mn oxide catalysts: (a) survey spectra, (b) Fe 2p, (c) Mn 2p and (d) Mn 3s. | ||
In order to further investigate the nature of the iron phases on the activated catalysts, in situ high resolution XPS spectra of the Fe–Mn oxide catalysts after in situ reduction using syngas at 300 °C for 2 h are presented, as shown in Fig. 6. For the unpromoted Fe2O3 sample, the Fe 2p peaks at the binding energy of 706.9 and 720.1 eV can be attributed to Fe5C2,30 which is well matched with the XRD analysis in Fig. 3b. For the Mn-promoted catalysts, the intensity of Fe5C2 peaks decreases with the increase of the Mn/Fe atomic ratio in the catalysts. The content of iron carbides over the reduced Fe2O3 catalyst is the highest among the four catalysts. The above results indicate that the addition of the Mn promoter suppresses the carburization of iron-based catalysts. In addition to Fe5C2, the peaks corresponding to Fe3O4 (Fig. 6a) and Mn3O4 (Fig. 6b) are also observed for the activated catalysts. It is known that the reduction of iron-based catalysts in syngas includes the removal of oxygen and the introduction of carbon. The appearance of Fe3O4 peaks further indicates that the reduction of the synthesized Fe–Mn oxide catalysts in syngas includes two steps, Fe2O3 → Fe3O4 and Fe3O4 → FeCx. The Mn/Fe surface atomic ratios for the activated Fe–Mn oxide catalysts are shown in Table 1. Compared with FeMn20, FeMn5 and FeMn10 display a higher surface to bulk atomic ratio of Mn/Fe.
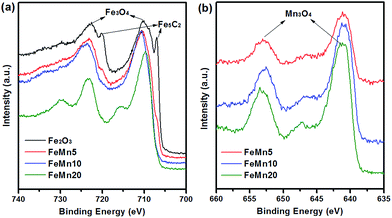 | ||
| Fig. 6 In situ high resolution XPS spectra of the Fe–Mn oxide catalysts after in situ reduction using syngas at 300 °C for 2 h: (a) Fe 2p and (b) Mn 2p. | ||
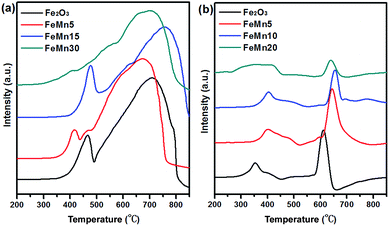
The effect of the manganese promoter on the reduction and carburization behaviour of the synthesized Fe–Mn oxide catalysts was studied by H2-TPR and CO-TPR. For the unpromoted Fe2O3 catalyst, two distinct reduction peaks are observed in the H2-TPR curves (Fig. 7a). The first small reduction peak centered at 465 °C is associated with the reduction of Fe2O3 to Fe3O4, and the second broadened reduction peak ranging from 500 °C to 800 °C represents the reduction of Fe3O4 to Fe.21,24 For the FeMn5 and the FeMn10 catalysts, the low-temperature reduction peaks can be ascribed to the transition of (Fe1−xMnx)2O3 to (Fe1−xMnx)3O4, and the high-temperature reduction peak can be assigned to the transition of (Fe1−xMnx)3O4 to Fe and MnO.21 It is observed from the H2-TPR profiles that the reduction peaks shift to lower temperature for FeMn5 with a low Mn content, whereas those of FeMn10 with a high Mn content shift to higher temperature. The results apparently illustrate that the incorporation of a small amount of Mn into the solid solution promotes the reduction of the catalyst, and the presence of a larger amount of Mn suppresses the reduction of iron species. Moreover, a new peak at 415 °C is detected in FeMn5 with a low Mn content, which may arise from the reduction of surface-enriched Mn oxides. The XPS results also indicate that the FeMn5 spindles display a higher Mn/Fe atomic ratio on the surface than the one in the bulk. Thus it can be inferred that surface-enriched Mn oxides in the FeMn5 spindles may provide H2 dissociation sites, which will promote the activation of hydrogen and weaken the Fe–O bond,13 thus leading to the shift of the reduction peaks to lower temperature. No reduction peaks of Mn oxides are observed for FeMn10, probably due to the formation of (Fe1−xMnx)2O3 solid solution with a stable cube structure. For the FeMn20 catalyst with a mixed crystal phase of Mn3O4 and Fe2O3, the low-temperature reduction peak at 405 °C is attributed to the reduction of Mn3O4 nanoparticles,9,31 and the overlapping reduction peak in the temperature range of 425–800 °C is associated with the reduction of Fe2O3 nanoparticles.
Fig. 7b shows the CO-TPR profiles of the Fe–Mn oxide catalysts. Broad low temperature peaks with shoulders below 550 °C and sharp high temperature peaks above 550 °C are observed in the CO-TPR profiles of the four catalysts. It is well known that the reduction of Fe-based catalysts using CO gas includes oxygen removal and carbon introduction. Consequently, reduction and carburization occur concurrently during the temperature programme under the CO flow, which is different from the H2-TPR process. The peaks at temperature below 550 °C are attributed to the reduction of Fe2O3 to Fe3O4 and the carburization of Fe3O4 on the surface,15 and the peaks at temperature above 550 °C are related to the carburization of Fe3O4 in the bulk. The temperature required for the reduction–carburization steps is lowest for the unpromoted Fe2O3 catalyst. With the increase of the Mn/Fe atomic ratio in the catalysts, the reduction–carburization peaks gradually shift to higher temperatures. The above results indicate that the introduction of the Mn promoter over the synthesized Fe-based catalysts leads to resistance to reduction–carburization under the CO flow, which coincides with the XRD results in Fig. 3b.
3.2 Catalytic performance of the Fe–Mn oxide catalysts
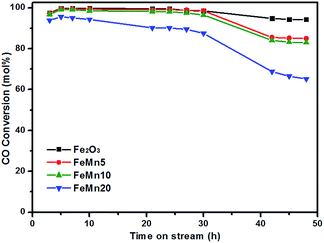
The FTS performances of the synthesized Fe–Mn oxide catalysts were measured at a temperature of 280 °C and a pressure of 2.0 MPa in syngas (CO/H2 = 1). The variations in the CO conversion with time on stream over the synthesized catalysts are shown in Fig. 8. After an initial activation period, the pure Fe2O3 exhibited a relative stable catalytic activity for 48 h. A gradual decrease in activity with time on the stream was observed for the Mn-promoted catalysts. The catalytic reaction results obtained during 42–48 h on stream are summarized in Table 2. It can be seen that the conversion rate of CO is decreased with the increase of the Mn/Fe atomic ratio in the catalysts. The unpromoted Fe2O3 catalyst has a highest CO conversion of 94.3% and the FeMn20 presents the lowest value of 65.2%. For the FeMn5 and the FeMn10 catalysts, the CO conversion decreases to 85.0% and 83.0%, respectively. There is a mass balance greater than 95 wt% over the synthesized Fe–Mn oxide catalysts. The catalyst with more iron carbide species is often found to exhibit high activity for the FTS reaction.19–21 Combining the results of the XRD, in situ XPS and H2/CO-TPR measurements, the declined activity over the FeMn5 and FeMn10 catalysts may result from the suppression of the reduction–carburization of iron oxides to iron carbides by Mn promotion. However, for the FeM20 catalyst, the amount of active iron species is greatly decreased due to the further increase of the Mn content in the catalyst, thus resulting in significantly reduced FTS activity.| Catalysts | CO conv. (mol%) | Mass balanced (wt%) | CO2 sel. (mol%) | Hydrocarbon selectivities (wt%)b | O/Pc | C5+ yield (mg (gFe h)−1) | ||
|---|---|---|---|---|---|---|---|---|
| CH4 | C2–C4 | C5+ | ||||||
| a Reaction conditions: catalyst 1.0 g, 2.0 MPa, 280 °C, CO/H2 = 1, and space velocity was 3000 mL (gcat h)−1. b Hydrocarbon selectivities are reported on the basis of total hydrocarbons in weight. c The molar ratio of olefin to paraffin in the C2–C4 range hydrocarbons. d Mass balance was calculated based on the reaction results during 42–48 h on stream. | ||||||||
| Fe2O3 | 94.3 | 99.4 | 38.8 | 17.4 | 32.3 | 50.3 | 1.43 | 227 |
| FeMn5 | 85.0 | 97.8 | 22.7 | 7.2 | 43.7 | 49.1 | 0.54 | 290 |
| FeMn10 | 83.0 | 97.6 | 34.0 | 9.5 | 26.6 | 63.9 | 4.32 | 307 |
| FeMn20 | 65.2 | 95.5 | 31.2 | 14.2 | 34.6 | 51.2 | 3.38 | 177 |
The hydrocarbon product distributions for the synthesized Fe–Mn oxide catalysts are shown in Fig. 9. The unpromoted Fe2O3 catalyst presents a selectivity of 17.4% and 32.3% for CH4 and C2–C4, as well as 50.3% selectivity for C5+ hydrocarbons. Meanwhile, the weight ratio of olefin to paraffin in the C2–C4 range hydrocarbons was as low as 1.43. For the FeMn5 and the FeMn10 catalysts, the CH4 selectivity decreases obviously to 7.2% and 9.5%, respectively. The selectivity to CH4 on the FeMn10 cube catalyst with a high Mn content is higher than on the FeMn5 spindle catalyst with a low Mn content, which is inconsistent with the results over the Mn promoted Fe-based nanoparticle catalysts reported in ref. 13 and 19. The discrepancies in the effect of the Mn promoter on the CH4 selectivity may be due to the different catalyst morphologies and surface states. It is also worth noting that FeMn5 exhibits a 49.1% selectivity for C5+ hydrocarbons closer to that of the Fe2O3 catalyst, but a higher C2–C4 selectivity (43.7%), while FeMn10 provides a selectivity for C5+ hydrocarbons as high as 63.9%, but a lower C2–C4 selectivity (26.6%). In addition, the ratio of olefin/paraffin over the FeMn5 and the FeMn10 is 0.54 and 4.32, which is much lower and higher than that of the unpromoted Fe2O3 catalyst. The yield of C5+ hydrocarbons for the Fe2O3 catalyst is 227 mg (gFe h)−1, which increases rapidly to 290 mg (gFe h)−1 and 307 mg (gFe h)−1 for the FeMn5 and the FeMn10 catalysts, respectively. With further increasing the Mn/Fe atomic ratio, a significant decrease in the yield of C5+ hydrocarbons is observed for the FeMn20 catalyst. In conclusion, the introduction of the Mn promoter into the Fe-based catalysts can effectively suppress the CH4 formation and facilitate the carbon chain growth. The FeMn5 spindle catalyst with a low Mn content exhibits a higher selectivity for C2–C4 short-chain hydrocarbons, while the FeMn10 cube catalyst with a relatively high Mn content displays a much better selectivity for C5+ long-chain hydrocarbons. This indicates that the amount of Mn promoter in the synthesized Fe–Mn oxide catalysts has a great impact on the product selectivity.
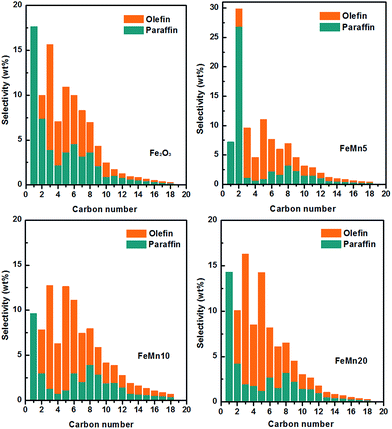 | ||
| Fig. 9 Product distribution of the Fe–Mn oxide catalysts during 42–48 h of FTS reaction. Reaction conditions: catalyst 1.0 g, 2.0 MPa, 280 °C, CO/H2 = 1, and space velocity was 3000 mL (gcat h)−1. | ||
In the FTS reaction, the competition between surface carbon hydrogenation and C–C coupling is the key factor for the selectivity of CH4 and C5+ long-chain hydrocarbons.17,32,33 It is reported that the Mn promoter can activate the C–O bond and then induce the insertion reaction of the adsorbed alkyl species.34 As a result, the Mn-introduced catalysts can effectively suppress the CH4 formation and promote the carbon chain growth. Compared with the unpromoted Fe2O3 catalyst, the FeMn5 spindles with a low Mn content (Mn/Fe atomic ratio of 5/100) exhibit a higher selectivity for C2–C4 short-chain hydrocarbons, while the FeMn10 cubes with a high Mn content (Mn/Fe atomic ratio of 10/100) display a much better selectivity for C5+ long-chain hydrocarbons. The XPS and TPR results have indicated that the surface-enriched Mn oxides in the FeMn5 spindles can promote the chemisorption and activation of hydrogen. For the FeMn5 catalyst with a low Mn content, the surface-enriched Mn oxides in the spindle-like structure may provide H2 dissociation sites and accelerate the hydrogen reaction of a-olefin (a major intermediate in FTS), leading to a much lower ratio of olefin/paraffin and a limited carbon chain growth. However, for the FeMn10 cube catalyst, incorporation of larger amounts of Mn oxides results in a stable solid solution structure, which can effectively suppress the hydrogen reaction of a-olefin and thus accelerate the production of C5+ hydrocarbons. As shown in Fig. 7, the selectivity for C5+ hydrocarbons over the FeMn10 cubes with a high Mn content is substantially increased mainly at the expense of C2–C4 and undesired CH4 production. The above results indicate that the amount of Mn promoter in the synthesized Fe–Mn oxide catalysts has a great influence on the distribution of hydrocarbon products.
4. Conclusions
Fe–Mn oxide catalysts with different morphologies were synthesized by a one-pot hydrothermal method for the production of C5+ long-chain hydrocarbons. The increase of the Mn/Fe atomic ratio in the catalysts from 5/100 to 10/100 and then to 20/100 causes the morphology transformation of the Fe–Mn oxides from spindles (FeMn5) to cubes (FeMn10) and then to nanoparticles (FeMn20) during hydrothermal synthesis. The amount of Mn promoter in the Fe–Mn oxide catalysts has a great influence on the hydrocarbon product distributions. Compared with the unpromoted Fe2O3 catalyst, the FeMn5 spindles with a low Mn content exhibit a higher selectivity for C2–C4 short-chain hydrocarbons, while the FeMn10 cubes with a high Mn content display much better performance towards the synthesis of C5+ long-chain hydrocarbons. Meantime, the introduction of the Mn promoter into the Fe-based catalysts has a negative influence on the catalytic stability, which may be overcome by optimizing the pre-activation conditions in our future work. The synthesized Fe–Mn oxide catalysts may provide a promising route for the design of promoter-modified catalysts with enhanced C5+ selectivity.Conflicts of interest
There are no conflicts to declare.Acknowledgements
The authors thank the National Natural Science Foundation of China (51302263) and the National Key Basic Research Program of China (2013CB228105) for the financial support. The authors thank the Analytical & Testing Center, Guangzhou Institute of Energy Conversion, Chinese Academy of Sciences, P. R. China for the support.Notes and references
- D. J. Wilhelm, D. R. Simbeck, A. D. Karp and R. L. Dickenson, Fuel Process. Technol., 2001, 71, 139 CrossRef CAS.
- A. Demirbas, Prog. Energy Combust. Sci., 2007, 33, 1 CrossRef CAS.
- A. Y. Khodakov, W. Chu and P. Fongarland, Chem. Rev., 2007, 107, 1692 CrossRef CAS PubMed.
- H. M. Torres Galvis, J. H. Bitter, C. B. Khare, M. Ruitenbeek, A. Iulian Dugulan and K. P. de Jong, Science, 2012, 335, 835 CrossRef CAS PubMed.
- G. Yu, B. Sun, Y. Pei, S. Xie, S. Yan, M. Qiao, K. Fan, X. Zhang and B. Zong, J. Am. Chem. Soc., 2010, 132, 935 CrossRef CAS PubMed.
- W. Wang, M. Ding, L. Ma, X. Yang, J. Li, N. Tsubaki, G. Yang, T. Wang and X. Li, Fuel, 2016, 16, 347 CrossRef.
- Q. H. Zhang, J. C. Kang and Y. Wang, ChemCatChem, 2010, 2, 1030 CrossRef CAS.
- X. Duan, D. Wang, G. Qian, J. C. Walmsley, A. Holmen, D. Chen and X. Zhou, J. Energy Chem., 2016, 25, 311 CrossRef.
- Y. Yang, H. W. Xiang, Y. Y. Xu, L. Bai and Y. W. Li, Appl. Catal., A, 2004, 266, 181 CrossRef CAS.
- Y. Cheng, J. Lin, K. Xu, H. Wang, X. Yao, Y. Pei, S. Yan, M. Qiao and B. Zong, ACS Catal., 2016, 6, 389 CrossRef CAS.
- J. Yang, Y. Sun, Y. Tang, Y. Liu, H. Wang, L. Tian, H. Wang, Z. Zhang, H. Xiang and Y. Li, J. Mol. Catal. A: Chem., 2006, 245, 26 CrossRef CAS.
- Y. Liu, J. F. Chen, J. Bao and Y. Zhang, ACS Catal., 2015, 5, 3905 CrossRef CAS.
- Y. Zhang, L. Ma, T. Wang and X. Li, Fuel, 2016, 177, 197 CrossRef CAS.
- C. H. Zhang, Y. Yang, B. T. Teng, T. Z. Li, H. Y. Zheng, H. W. Xiang and Y. W. Li, J. Catal., 2006, 237, 405 CrossRef CAS.
- S. Li, S. Krishnamoorthy, A. Li, G. D. Meitzner and E. Iglesia, J. Catal., 2002, 206, 202 CrossRef CAS.
- M. Feyzi, M. M. Khodaei and J. Shahmoradi, Int. J. Hydrogen Energy, 2015, 40, 14816 CrossRef CAS.
- J. Li, X. Cheng, C. Zhang, Y. Yang and Y. Li, J. Mol. Catal. A: Chem., 2015, 396, 174 CrossRef CAS.
- J. B. Li, H. F. Ma, H. T. Zhang, Q. W. Sun, W. Y. Ying and D. Y. Fang, Acta Phys.–Chim. Sin., 2014, 30, 1932 CAS.
- J. D. Xu, K. T. Zhu, X. F. Weng, W. Z. Weng, C. J. Huang and H. L. Wan, Catal. Today, 2013, 215, 86 CrossRef CAS.
- T. Li, Y. Yang, C. Zhang, X. An, H. Wan, Z. Tao, H. Xiang, Y. Li, F. Yi and B. Xu, Fuel, 2007, 86, 921 CrossRef CAS.
- T. Li, H. Wang, Y. Yang, H. Xiang and Y. Li, J. Energy Chem., 2013, 22, 624 CrossRef CAS.
- J. Zhang, L. Ma, S. Fan, T. Zhao and Y. Sun, Fuel, 2013, 109, 116 CrossRef CAS.
- A. Campos, N. Lohitharn, A. Roy, E. Lotero, J. G. Goodwin Jr and J. J. Spivey, Appl. Catal., A, 2010, 375, 12 CrossRef CAS.
- M. Feyzi, M. Irandoust and A. A. Mirzaei, Fuel Process. Technol., 2011, 92, 1136 CrossRef CAS.
- V. G. Pol, H. Grisaru and A. Gedanken, Langmuir, 2005, 21, 3635 CrossRef CAS PubMed.
- W. X. Jin, S. Y. Ma, Z. Z. Tie, X. H. Jiang, W. Q. Li, J. Luo, X. L. Xu and T. T. Wang, Sens. Actuators, B, 2015, 220, 243 CrossRef CAS.
- C. Su, H. Wang and X. Liu, Cryst. Res. Technol., 2011, 46, 209 CrossRef CAS.
- H. Wang, Y. Yang, J. Xu, H. Wang, M. Ding and Y. Li, J. Mol. Catal. A: Chem., 2010, 326, 29 CrossRef CAS.
- K. S. W. Sing, D. H. Everett, R. A. W. Haul, L. Moscou, R. A. Pierotti, J. Rouquerol and T. Siemieniewska, Pure Appl. Chem., 1985, 57, 603 CAS.
- Y. Zhang, T. Wang, L. Ma, N. Shi, D. Zhou and X. Li, J. Catal., 2017, 154, 41 CrossRef.
- Y. Yang, H. W. Xiang, L. Tian, H. Wang, C. H. Zhang, Z. C. Tao, Y. Y. Xu, B. Zhong and Y. W. Li, Appl. Catal., A, 2005, 284, 105 CrossRef CAS.
- S. Wang, Q. Yin, J. Guo, B. Ru and L. Zhu, Fuel, 2016, 108, 597 CrossRef.
- N. S. Govender, F. G. Botes, M. H. J. M. de Croon and J. C. Schouten, J. Catal., 2008, 260, 254 CrossRef CAS.
- H. Trevino, G. D. Lei and W. M. H. Sachtler, J. Catal., 1995, 35, 245 CrossRef.
| This journal is © The Royal Society of Chemistry 2019 |

