Atomistic insights into the order–disorder transition in Cu2ZnSnS4 solar cells from Monte Carlo simulations†
Suzanne K.
Wallace
 ab,
Jarvist Moore
Frost
 c and
Aron
Walsh
 *bd
*bd
aDepartment of Chemistry, Centre for Sustainable Chemical Technologies, University of Bath, Claverton Down, Bath, BA2 7AY, UK
bDepartment of Materials, Imperial College London, Exhibition Road, London SW7 2AZ, UK. E-mail: a.walsh@imperial.ac.uk
cDepartment of Physics, King's College London, Strand, London WC2R 2LS, UK
dDepartment of Materials Science and Engineering, Yonsei University, Seoul 03722, Korea
First published on 23rd November 2018
Abstract
Kesterite-structured Cu2ZnSnS4 (CZTS) is an earth-abundant and non-toxic semiconductor that is being studied for use as the absorber layer in thin-film solar cells. Currently, the power-conversion efficiencies of this technology fall short of the requirements for commercialisation. Disorder in the Cu–Zn sub-lattice has been observed and is proposed as one explanation for the shortcomings of CZTS solar cells. Cation site disorder averaged over a macroscopic sample does not provide insights into the microscopic cation distribution that will interact with photogenerated electrons and holes. To provide atomistic insight into Cu/Zn disorder, we have developed a Monte Carlo (MC) model based on pairwise electrostatic interactions. Substitutional disorder amongst Cu and Zn ions in Cu–Zn (001) planes on the 2c and 2d Wyckoff sites – 2D disorder – has been proposed as the dominant form of Cu/Zn disorder in near-stoichiometric crystals. We use our model to study the Cu/Zn order–disorder transition in 2D but also allow Zn to substitute onto the Cu 2a site – 3D disorder – including Cu–Sn (001) planes. We find that defects are less concentrated in Cu–Sn (001) planes but that Zn ions readily substitute onto the Cu 2a site and that the critical temperature is lowered for 3D disorder.
1 Introduction
Amongst the semiconductors being developed for applications in thin-film photovoltaic (PV) devices, kesterite-structured Cu2ZnSnS4 (CZTS) stands out as being composed of low-cost, earth-abundant and non-toxic elements. While the material has many of the bulk properties required to be a high-efficiency photovoltaic absorber, such as a high absorption coefficient of 104 cm−1 and a direct band gap of 1.5 eV,1 the power-conversion efficiencies (PCEs) of solar cells are considerably less than the theoretical maximum of 28% as predicted by the Shockley–Queisser limit2 based on its sunlight-matched optical band gap. The current confirmed record PCE for the kesterite-based alloy Cu2ZnSn(SxSe1−x)4 (CZTSSe) is at 12.6%,3 while that of the pure sulfide material still lags behind at 11%,4 both of which are far below that of the similar PV technology Cu(In1−y, Gay)Se2(CIGSe) with a record PCE of 22.6%.5The low open-circuit voltage (compared to the optical band gap) limits achieved device efficiencies.6,7 This is referred to as the VOC deficit. It is possible that the efficiency of devices fabricated with absorber layers produced from different synthesis procedures may be limited by different factors, making it a difficult task to pinpoint a universal origin of the VOC deficit in CZTS solar cells. Defects and bulk disorder in CZTS is one explanation for the VOC deficit.8–12 For record-efficiency devices, produced by the hydrazine-based solution method pioneered at the IBM T. J. Watson Research Center,3,13 this has been attributed to fluctuations in electrostatic potential due to Cu–Zn disorder, and associated band tailing.14 The origin of the VOC deficit is still an on-going debate.6
Inhomogeneity within the cation sublattice of tetrahedrally bonded multinary semiconductors is a particularly likely form of disorder.15 This can decisively alter the electronic properties of a material.16 The Cu–Zn–Sn cation sublattice of Cu2ZnSnS4 is analogous to a metallic alloy. According to the works by Williams and Bragg,17–19 an alloy is a system in dynamic equilibrium where atomic species are interchanged between different sites due to thermal agitation, but without destroying the crystalline structure of the phase. In CZTS, substitutional disorder between Cu+ and Zn2+ ions has a low enthalpic cost due to the similar ionic radii and chemical character of the two species. Density functional theory (DFT) predicts a low formation energy for the [Cu−Zn + Zn+Cu] antisite defect pair20 and there is a large body of evidence for the presence of disorder amongst Cu+ and Zn2+ ions in CZTS.21–26 Furthermore, ref. 24–27 indicate a distinct order–disorder transition (ODT) attributed to Cu–Zn substitutional disorder.
During the high-temperature synthesis of CZTS disorder can be ‘frozen in’ to the material as it cools to room temperature. Studies have been conducted to determine if low temperature post-deposition annealing could improve device performance and some improvements were observed from such treatments.28,29 However, in the latter study the authors postulate that a high level of order amongst the Cu+ and Zn2+ ions would require years of this treatment.29 It is unclear if the disorder is due to slow kinetics, which could be improved through optimising the processing conditions, or if the disorder is due to fundamental thermodynamic limitations for the material at room temperature.30 In our study, we model only thermodynamic equilibrium disorder as a function of temperature. Therefore, our model could be used to isolate disorder due to equilibrium thermodynamics from kinetic limitations in experiments. Our model can be used to quantify the absolute limit on order in Cu2ZnSnS4 at experimentally relevant temperatures and to generate atomic configurations arising from the disorder process.
Devices made from CZTSSe make the highest performing devices.3,13 In this study we focus on the pure sulfide. The VOC deficit is worse in CZTS devices6 and so potentially studying causes of the problem in this particular system could be more informative. Although ultimately the aim for this technology is to make thin-film devices from CZTS, in which the material is likely to be polycrystalline with grain boundaries, we focus on the bulk material. We are doing this for two reasons. Firstly, to improve the understanding of the fundamental material properties before attempting to understand a more complex system. Secondly, it has been proposed that the VOC deficit in CZTSSe devices could be associated with properties of the bulk crystal.31 It is believed that the most recent high-performance devices are not limited by interface recombination.32,33 Furthermore, devices fabricated from single crystals have demonstrated a VOC deficit of 530 mV, which equals that of the record thin-film devices, indicating that the deficit could largely be due to bulk disorder.34
Studies on various multinary semiconductors have indicated that it is not sufficient to consider only point defects to understand the defect physics of this type of compound due to the likely presence of structural disorder and extended antisite defects.15,35 System sizes that avoid artificial periodic disorder and associated finite-size effects would be beyond computationally feasible limits for density functional theory (DFT) or other first-principles calculations. However, a number of studies have investigated substitutional disorder by utilising Metropolis Monte Carlo (MC) simulations. One study used DFT to calculate the energy of local structural motifs centred on the S-ions in CZTS (i.e. out to nearest-neighbour interactions) and then performed MC simulations for the redistribution of the motifs for systems of up to 1200 atoms.36 This work indicated clear cation clustering in CZTS with increased temperature. However, the model did not account for any long-ranged interactions which may be important in systems with extended defect structures. Other MC studies have made use of cluster expansion models. In ref. 30 DFT calculations of clusters of interacting dimers and trimers were used to perform MC simulations of up to 512 atoms. This work also investigated the possibility of voltage loss from Cu/Zn disorder by performing DFT calculations to obtain the electronic band gap for selected disordered atomic configurations from their MC simulations. Ref. 37 used a cluster expansion model with clusters out to second-nearest neighbour cations and performed MC simulations for up to 64![[thin space (1/6-em)]](https://www.rsc.org/images/entities/char_2009.gif) 000 atoms. Prior to the studies outlined above, there has been little work modelling disordered phases in CZTS, apart from one study where the choice of the disordered phase was arbitrary38 and another investigating the configurational entropy of independent microstates in small systems of up to 64 atoms.39
000 atoms. Prior to the studies outlined above, there has been little work modelling disordered phases in CZTS, apart from one study where the choice of the disordered phase was arbitrary38 and another investigating the configurational entropy of independent microstates in small systems of up to 64 atoms.39
In this study, we simulate substitutional disorder between Cu+ and Zn2+ ions for system sizes of over 50![[thin space (1/6-em)]](https://www.rsc.org/images/entities/char_2009.gif) 000 atoms and allow for Coulomb interactions between all pairs of ions in the system. We use on-lattice Metropolis MC simulation with an interaction model that has been parameterised with the dielectric constant of CZTS determined from first-principles40 to calculate the changes in lattice energies when performing Cu/Zn substitutions. Our model allows us to freeze certain species in the system, we are therefore able to study separately thermodynamic disorder in 2D where substitutions are only in-plane between Cu and Zn ions on 2c and 2d sites and in 3D where Zn may also substitute on the Cu 2a sites. Cu/Zn disorder in 2D is believed to be the most prevalent type of substitutional disorder for near stoichiometric samples and that substitutions onto the Cu 2a sites occur only after the Cu/Zn ODT has occurred.21,24,41 However, other studies have suggested that disorder on the 2a site plays an important role.37,42 We therefore perform simulations to study the ODT for both cases. Simulations are performed in parallel over different temperatures using GNU parallel,43 and the associated simulation codes have been made openly available.
000 atoms and allow for Coulomb interactions between all pairs of ions in the system. We use on-lattice Metropolis MC simulation with an interaction model that has been parameterised with the dielectric constant of CZTS determined from first-principles40 to calculate the changes in lattice energies when performing Cu/Zn substitutions. Our model allows us to freeze certain species in the system, we are therefore able to study separately thermodynamic disorder in 2D where substitutions are only in-plane between Cu and Zn ions on 2c and 2d sites and in 3D where Zn may also substitute on the Cu 2a sites. Cu/Zn disorder in 2D is believed to be the most prevalent type of substitutional disorder for near stoichiometric samples and that substitutions onto the Cu 2a sites occur only after the Cu/Zn ODT has occurred.21,24,41 However, other studies have suggested that disorder on the 2a site plays an important role.37,42 We therefore perform simulations to study the ODT for both cases. Simulations are performed in parallel over different temperatures using GNU parallel,43 and the associated simulation codes have been made openly available.
2 Computational methodology
2.1 Lattice model of Cu2ZnSnS4
The crystal structure of Cu2ZnSnS4 can be described by two inter-penetrating face-centred cubic (FCC) lattices: one of metal cations and one of sulfur anions. This is shown in Fig. 1a, where green planes are a guide to the eye to distinguish the anion sub-lattice. The sulfur sub-lattice is implicit during the MC simulations but incorporated later in calculations of lattice electrostatics. The cation lattice can be described by alternating layers of Cu–Sn and Cu–Zn in (001) planes, as shown in Fig. 1b. Cu/Zn disorder in only the Cu–Zn (001) planes is referred to as ‘2D disorder’ in this study, while full Cu/Zn disorder is referred to as ‘3D disorder’. In the case of the latter, Zn ions are able to substitute onto Cu 2a sites in the Cu–Sn (001) planes. For computational convenience, we map this FCC lattice onto a simple cubic (SC) lattice by introducing empty lattice sites.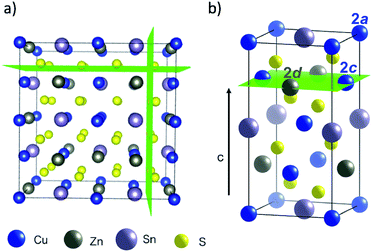 | ||
| Fig. 1 Representations of the crystal structure of kesterite-structured Cu2ZnSnS4 where green planes are used as guides to the eye: (a) supercell indicating the two inter-penetrating anion and cation sub-lattices, (b) the conventional unit cell highlighting a Cu–Zn layer in the (001) planes along the c-axis. Visuals were produced using VESTA.44 | ||
The separation between lattice sites in our model is re-scaled using DFT (PBEsol functional) optimised lattice parameters of a = b = 5.44 Å.45 Kesterite has a tetragonal lattice with  ratio close to 1 (0.998 from DFT/PBEsol-optimisation). We use a value of 1 in the MC simulations, which has a minor effect on the lattice energy as confirmed from explicit calculations using the General Utility Lattice Program (GULP).46 Lattice energies of an ordered 64 atom supercell with the exact DFT/PBEsol-optimised lattice parameters and an equivalent supercell with the approximated lattice parameters differed by less than 2%.
In our model we fix the position of Sn ions. To simulate only nearest-neighbour Cu/Zn disorder within the Cu–Zn layers, we use a cut-off radius of 2 lattice units (to account for the empty sites between each cation, shown in Fig. 4). The cut-off radius in the c-direction is only 1 lattice unit so that substitutions may only occur with the plane above or below. The model does not account for strain effects during Cu–Zn substitutions as it is fixed on-lattice. It has been reported that there is a small change in the c lattice parameter with increased disorder;47 however, due to the similar ionic radii of Cu and Zn we neglect this effect, but it could be incorporated into future models. Sn ions have the largest formal charge in the lattice and are fixed during the simulations.
2.2 Pair interaction model and metropolis Monte Carlo simulation of cation disorder
The MC method can be used to calculate thermodynamic information about a system of interacting ions, which we represent on a 3D lattice as described above. We assume that the potential field of an ion is spherically symmetric and consider two-body forces acting between all pairs of ions in this system. If we know the positions of the N interacting ions on the lattice then the potential energy of the system can be calculated using eqn (1), where dij is the minimum distance between ions i and j with charge qi and qj.48 | (1) |
To calculate the properties of the system, the canonical (NVT) ensemble is used where the number of ions, volume and temperature are all constant. The trial MC moves are swaps between nearest-neighbour Cu and Zn ions.
Using a standard MC method for our system would involve placing each of the N ions at random positions in the lattice to define a random point in the 3N-dimensional configuration space. However, most configurations are improbable so performing this calculation for every possible configuration would be inefficient and unnecessary to sufficiently evaluate the ensemble. The custom MC code in this study makes use of the Metropolis modified MC scheme.48 In this implementation of the MC method, instead of choosing configurations randomly and then weighting them, the Metropolis algorithm considers the relative probability of a system being in a new configuration, β, to that of being in the current configuration, α. This is shown in eqn (2), where Eα is the energy of state α, Eβ is the energy of state β, and Z is the partition function. For most systems, calculating the value of the partition function requires the summation over a large number of states. However, in the expression for the probability of the trial within the Metropolis scheme, Z cancels out.
 | (2) |
The relative probabilities of the two states are completely determined by the energy difference, such that if:
 | (3) |
 | (4) |
It is then decided if this new configuration should be added to the trajectory of the system (towards the minimum energy configuration), or not, based on the probability of the new configuration relative to the current configuration. If the relative probability is ≥ 1, as shown in eqn (3), then the move is accepted and added to the trajectory. However, if the relative probability is <1 then the move will only be accepted if  a random number generated between 0 and 1.
Lattice energy summations of the system were performed before and after a proposed Cu–Zn substitution out to a finite radius to obtain ΔE. Within periodic boundary conditions, the upper limit for the cut off radius is half the minimum dimension of the system. Details of the convergence in ΔE with respect to the cut off radius used in the lattice summations are given in the ESI.†Eqn (5) is used to calculate the electrostatic interaction between pairs of ions in the system, where q1 and q2 are the bare formal charges, r is the separation of the point charges, εr is the effective dielectric constant of the crystal and ε0 is the permittivity of free space.
 | (5) |
To define Ielectrostatic, we use the separation of nearest-neighbour Cu–Zn ions for r (3.8 Å) and the calculated value for the static dielectric constant of 9.9.40 This results in Ielectrostatic = −0.378 eV.
3 Results and discussion
3.1 Equilibration
Due to the stochastic nature of the trajectory from an initial configuration in the MC method, we cannot draw any conclusions about the thermodynamic properties of that system at the given simulation temperature until equilibrium has been reached. The number of simulation steps required to reach this point is the ‘equilibration time’. Equilibration is often considered as the point at which the value of a quantity of interest, which initially changes by a large amount, eventually converges to fluctuating about a steady average value. This is dependent upon the principle that a system in equilibrium spends the majority of time in a small subset of states in which the properties take a narrow range of values.49Our MC model for Cu/Zn disorder is analogous to the Ising model of a ferromagnet and we describe the rationale for our equilibration procedure by referring to this common example. In the case of an Ising model, the trial moves in the Metropolis algorithm are spin flips, whereas in our model the trial moves are swaps between Cu and Zn ions. For the Ising model, one MC step corresponds to attempting a trial spin-flip at all sites in the system once. Similarly, for our model one MC step corresponds to sweeping across the entire lattice and attempting a near-neighbour Cu–Zn swap at each Cu and Zn site. In the case of the Ising model it is usually the average magnetisation of the system, or internal energy, as a function of temperature that are the quantities of interest. For our system, we are interested in the configuration of the ions (and extent of thermodynamic disorder) and the corresponding distribution of the electrostatic potential across the system, as this can be related to the observed band tailing. We now explore two methods to gauge when the system has reached the equilibrium disordered configuration at each simulation temperature: the pair correlation function (PCF) for information on the structural disorder and also the variance of the distribution of on-site electrostatic potentials of species in the system.
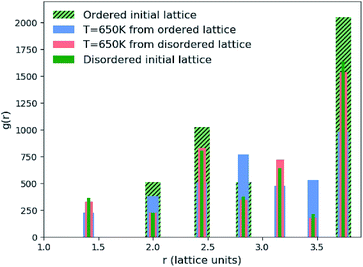
We found that systems initialised from a disordered lattice required a substantially larger number of MC steps to evolve away from the initial configuration. This can be seen in Fig. 2 from the Zn–Zn PCFs. The most noticeable feature when comparing the PCF for an ordered initial lattice to that of a disordered lattice is the emergence of a new nearest-neighbour Zn–Zn peak at  lattice units due to the clustering of Zn ions once Cu and Zn ions have been allowed to substitute. This point is discussed further in Section 3.2 as an order parameter, but for now we just remark that the peak is largest for the disordered initial lattice and decreases for the system evolved from this initial configuration at moderate simulation temperatures. After a large number of MC steps the peak for the two systems evolved from the ordered and disordered initial lattices were not of the same height. This observation may be explained by the entropic penalty in going from a disordered to a more ordered system, suggesting that this method may not be computationally efficient. We therefore adopted an alternative approach to check for equilibration, as outlined below.
An example of a test to determine a suitable number of MC steps for equilibration (i.e. steps to run before collecting data on the system) is shown in Fig. 3 for 3D Cu/Zn disorder. The equivalent for 2D disorder is given in the ESI.† We perform this check for the largest system size in our study and the whole simulation temperature range we study. A larger system may require a considerably larger number of MC steps to equilibrate and we perform the check for each temperature because if there is a phase transition (as suggested in several works24–27), there could be ‘critical slowing down’ close to the transition temperature.
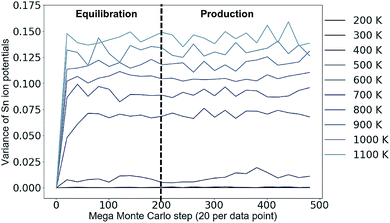 | ||
Fig. 3 Variance in the distribution of the on-site electrostatic potential of Sn ions in a 13![[thin space (1/6-em)]](https://www.rsc.org/images/entities/char_2009.gif) 824 atom Cu2ZnSnS4 system across a range of simulation temperatures with 3D Cu/Zn disorder. Equivalent for 2D disorder can be found in the ESI.† Each mega Monte Carlo step corresponds to sweeping across the lattice and attempting 100 trial moves per lattice site. 824 atom Cu2ZnSnS4 system across a range of simulation temperatures with 3D Cu/Zn disorder. Equivalent for 2D disorder can be found in the ESI.† Each mega Monte Carlo step corresponds to sweeping across the lattice and attempting 100 trial moves per lattice site. | ||
From Fig. 3, we take 200 mega MC steps as a suitable number of equilibration steps to ensure all simulation temperatures have reached their equilibrium configuration before we start collecting data. One mega MC step consists of attempting on average 100 trial Cu–Zn substitutions per site, i.e. 100 sweeps of the lattice per mega MC step. The absence of variance in Fig. 3 at low simulation temperatures is because the system remains ordered.
3.2 Order parameters
To quantify the extent of substitutional Cu–Zn disorder in our system, we consider two order parameters to enable us to investigate long- and short-ranged order. . This can be explained using Fig. 4. In the ordered lattice the shortest Zn–Zn spacing is 2 lattice units. Once Cu and Zn begin to substitute a new shortest Zn–Zn spacing of
  lattice units becomes possible. An increase in the intensity of this
  peak indicates more clustering of Zn ions and so provides insights into the extent of short-ranged disorder in the system. The same analysis is not possible using the Cu–Cu PCF because a
  Cu–Cu separation is present between the (001) planes in the ordered lattice.
 | (6) |
However, it is possible that this metric may overestimate the extent of disorder in a system as locally ordered domains, displaced relative to the configuration of the initial lattice, would be considered as disordered. We therefore compare the extent of order at each simulation temperature inferred from our PCF analysis to that suggested by the S parameter as we increase the system size to check for the formation of locally ordered domains. A decrease in S and an increase in Zn–Zn PCF  peak intensity correspond to a reduction in order in the system. For the case of locally ordered domains, a low S (suggesting large extents of Cu–Zn disorder) could coincide with a relatively small
  Zn–Zn PCF peak, suggesting long-range disorder, but short range order within the Cu–Zn planes. It is also worth noting that the S order parameter only considers disorder on the 2c and 2d sites and hence neglects disorder on the Cu 2a site when 3D Cu/Zn disorder is present. However, the use of the first Zn–Zn PCF peak as an order parameter is still relevant when considering 3D disorder as substitutions of Zn onto the 2a can result in Zn ions being separated by
  lattice units.
3.3 Finite size effects
To investigate finite size effects, we perform simulations for system sizes ranging from 12 × 12 × 12 (=1728 ions) to 32 × 32 × 32 (=32![[thin space (1/6-em)]](https://www.rsc.org/images/entities/char_2009.gif) 768 ions). We investigate the disorder behaviour of the systems as a function of temperature using the two order parameters in Fig. 5. Fig. 5a shows the increase in the intensity of the Zn–Zn PCF at
768 ions). We investigate the disorder behaviour of the systems as a function of temperature using the two order parameters in Fig. 5. Fig. 5a shows the increase in the intensity of the Zn–Zn PCF at  with temperature (explained schematically in Fig. 4). Fig. 5b shows the decrease in S from 1 to 0 with increased simulation temperature. Both order parameters show approximately the same temperature-dependence for the disorder process. Our model shows clear signs of finite size effects for the smallest system (1728 ions), in the regime used in some previous studies. We consider a 24 × 24 × 24 size system (=13
![[thin space (1/6-em)]](https://www.rsc.org/images/entities/char_2009.gif) 824 ions) to give a converged disorder process with respect to system size and use this system size for all subsequent simulations.
824 ions) to give a converged disorder process with respect to system size and use this system size for all subsequent simulations.
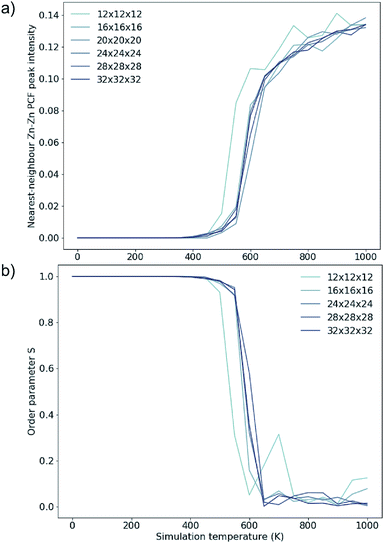 | ||
Fig. 5 Two order parameters to assess finite-size effects for 3D Cu/Zn disorder. Equivalent for 2D disorder can be found in the ESI.† (a) The nearest-neighbour ( ) Zn–Zn pair correlation function peak intensity for systems of various sizes at thermodynamic equilibrium across simulation temperatures ranging from 0 to 1000 K, indicating clustering of Zn ions and deviation from the perfectly ordered lattice with a ) Zn–Zn pair correlation function peak intensity for systems of various sizes at thermodynamic equilibrium across simulation temperatures ranging from 0 to 1000 K, indicating clustering of Zn ions and deviation from the perfectly ordered lattice with a  peak intensity greater than zero. (b) The S order parameter based on Cu and Zn site occupancies in Cu2ZnSnS4 as a function of simulation temperature. S = 1 corresponds to a fully ordered lattice and S = 0 corresponds to complete Cu–Zn disorder within the (001) plane (b). peak intensity greater than zero. (b) The S order parameter based on Cu and Zn site occupancies in Cu2ZnSnS4 as a function of simulation temperature. S = 1 corresponds to a fully ordered lattice and S = 0 corresponds to complete Cu–Zn disorder within the (001) plane (b). | ||
3.4 Cu/Zn order–disorder transitions
In this section we use the order parameters introduced in Section 3.2 to characterise the Cu/Zn order–disorder transitions (ODTs) for 2D Cu/Zn disorder (when the only mechanism is substitutions between Cu and Zn ions on 2c and 2d sites) and for 3D Cu/Zn disorder (when Zn may also substitute onto the Cu 2a sites). To improve our statistics, we performed 11 independent Monte Carlo simulations, each using different random number seeds and perform simulations across smaller temperature increments at temperatures close to the ODT critical temperatures, TC. Due to the possibility of critical slowing down when using temperature increments closer to TC, we repeat equilibration checks to ensure data is still for equilibrated configurations.Fig. 6 compares the S order parameter based on the cation occupancy of 2c and 2d sites obtained for simulations of both 2D and 3D Cu/Zn disorder to anomalous X-ray powder diffraction data for Cu2ZnSnSe4 from ref. 24. In the plot, experimental data has been shifted by 70 K to account for the difference in the order–disorder transition temperature for the pure sulfide and pure selenide reported in ref. 50. As our model considers only thermodynamic disorder, the difference in the value of the S order parameter at comparable temperatures between our model and experiment, and the diverging gradients of the curves at lower temperatures, could be attributed to kinetic limitations on the ordering processes that will be present in the real system but not in our model.
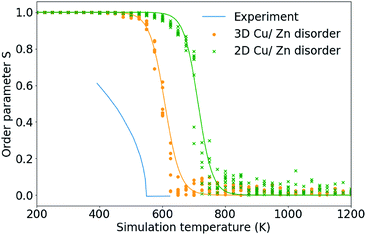 | ||
Fig. 6 The S order parameter based on Cu and Zn site occupancies in Cu2ZnSnS4 for 24 × 24 × 24 (=13![[thin space (1/6-em)]](https://www.rsc.org/images/entities/char_2009.gif) 824 ions) from 11 independent Monte Carlo simulations for 2D Cu/Zn disorder and 3D Cu/Zn disorder plotted against anomalous X-ray powder diffraction data for Cu2ZnSnS4 from ref. 24. Experimental data has been shifted by 70 K to account for the difference in the order–disorder transition temperature for the pure sulfide and pure selenide reported in ref. 50. 824 ions) from 11 independent Monte Carlo simulations for 2D Cu/Zn disorder and 3D Cu/Zn disorder plotted against anomalous X-ray powder diffraction data for Cu2ZnSnS4 from ref. 24. Experimental data has been shifted by 70 K to account for the difference in the order–disorder transition temperature for the pure sulfide and pure selenide reported in ref. 50. | ||
Taking TC to be the temperature at which S = 0 gives a TC of approximately 750 K and 650 K for 2D and 3D Cu/Zn disorder, respectively, as shown in Fig. 6. TC predicted from our 3D model based on the S order parameter is closer to the observed value of approximately 550 K. The overestimate in TC could be due to the bulk (macroscopic) dielectric constant used in the interaction energy. In polycrystalline films, there may be additional contributions to dielectric polarisation from the presence of internal interfaces and inhomogeneity in the mechanical and electrical properties.51
As discussed in Section 3.2, S only accounts for Cu/Zn disorder on the 2c and 2d sites and therefore may not fully describe the 3D case. For this reason, the nearest Zn–Zn PCF peak order parameter is also used to compare the ODT for 2D and 3D Cu/Zn disorder. The S order parameter can be considered as a measure of the loss of order in the system, allowing for the sudden drop in the parameter with increasing temperature. The PCF peak order parameter on the other hand, can be considered as an increase in disorder in the system which gradually increases towards complete disorder at the infinite temperature limit. The high-temperature Zn–Zn nearest-neighbour PCF peaks shown in Fig. 7 can be understood as the Cu–Zn sub-lattice beginning to melt. Within the cation sub-lattice, there are 12 nearest neighbours. In the S = 0 disorder regime, Cu shows no preference to occupy the 2c sites and Zn to occupy the 2d sites, we can therefore expect the density of Zn–Zn nearest neighbours to converge towards 2/12 (approximately 0.167). However, we cannot expect the PCF peak at high-temperatures to reach a complete plateau at high-temperatures as is seen for the S order parameter due to the lower stoichiometric ratio of Zn relative to Cu in Cu2ZnSnS4. The larger PCF peak intensity for 3D Cu/Zn disorder than for 2D Cu/Zn disorder can be understood by the larger number of possible options for Zn to substitute onto nearest-neighbour Cu sites in the 3D case.
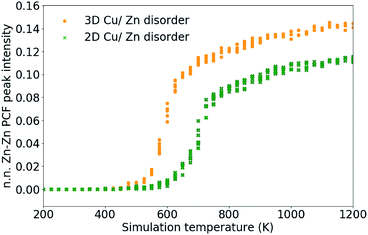 | ||
| Fig. 7 Nearest-neighbour Zn–Zn pair correlation function peak intensity, which emerges due to the substitution of Zn ions onto nearest-neighbour Cu sites in Cu2ZnSnS4 as shown in Fig. 4. 11 independent Monte Carlo simulations are performed for 2D Cu/Zn disorder and 3D Cu/Zn disorder. | ||
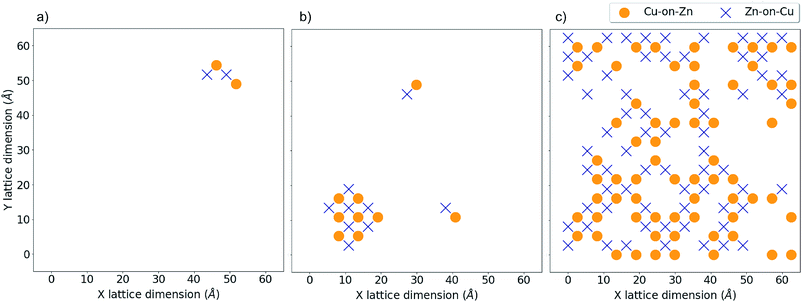
Fig. 8 and 9 show locations of Cu-on-Zn and Zn-on-Cu antisites in Cu–Zn and Cu–Sn (001) planes of the lattice model at various simulation temperatures for 2D and 3D Cu/Zn disorder respectively. In each case, the choice of planes used for the visualisation was chosen based on ones that showed the presence of disorder in the low-disorder temperature regime when disorder was not present in all layers of the lattice. Fig. 8a and b show two configurations of a Cu–Zn (001) plane at temperatures below TC for the 2D Cu/Zn ODT with Fig. 8b showing the nucleation of a distinct disordered region in the lower left corner of the plane. Fig. 8c shows a configuration above TC with a large extent of Cu/Zn disorder.
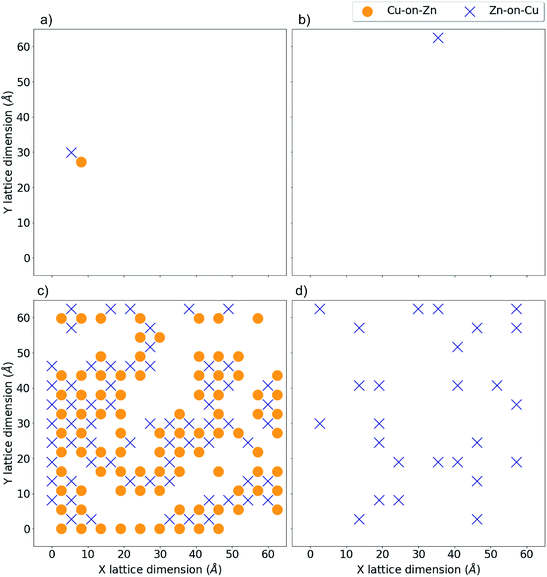
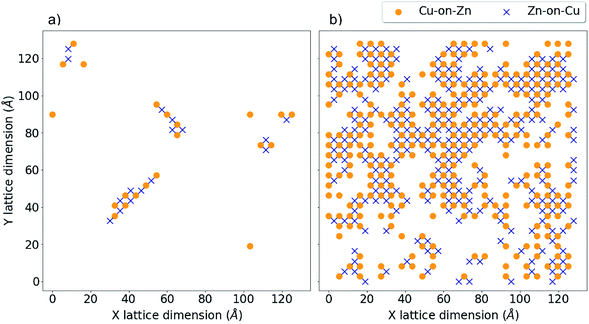
Fig. 9a and b show the location of a small number of Cu-on-Zn and Zn-on-Cu antisites in the Cu–Zn and Cu–Sn (001) planes respectively at a simulation temperature below TC for the 3D Cu/Zn ODT. It can be seen here that Zn readily substitutes onto the Cu 2a sites even in this low-disorder temperature regime. This is in agreement with results from cluster expansion MC simulations performed in ref. 30 where the temperature for the onset of Cu–Sn plane disorder was the same as that for Cu–Zn planes. This is also in agreement with cluster expansion MC simulations performed in ref. 37 which indicated that there is no intermediate ‘partially disordered’ phase where there is only disorder in the Cu–Zn planes. Fig. 9c and d show the antisite locations in the same planes at a simulation temperature above TC for the 3D Cu/Zn ODT, which shows a similar spatial distribution of antisites in the Cu–Zn plane to that observed for 2D Cu/Zn disorder above TC in Fig. 8c. We also note that in the high-temperature disorder regime the disorder is more dilute in the Cu–Sn planes, with Fig. 9d showing less than half the antisite concentrations of Fig. 9c. This is also in agreement with ref. 30, where the order parameter for the simulated Cu–Sn plane disorder reduced to a lesser extent with increasing temperature than that of the Cu–Zn planes. This observation may also explain why 2a site disorder is not always observed to be as prevalent as 2c and 2d site disorder experimentally. Fig. 10 shows antisite locations in a Cu–Zn plane that is twice as large as those in Fig. 8 and 9. Fig. 10a shows a plane in the low-disorder regime just before the ODT and Fig. 10b shows the same plane just above the ODT. The defect structures such as those shown in Fig. 10a indicate the presence of extended defect structures in Cu2ZnSnS4. The distribution of antisites above TC for the larger system in Fig. 10b is similar to that in the system half the size in Fig. 9c.
4 Summary and further work
In summary, we have developed a Monte Carlo (MC) model to simulate Cu/Zn disorder in kesterite-structured Cu2ZnSnS4 (CZTS) based on electrostatic pairwise interactions. We simulate separately the cases of 2D and 3D Cu/Zn disorder. We find that the critical temperature for disordering is lowered when swaps between adjacent (001) planes are allowed. In line with recent work,37,42 our model suggests that it is important to also consider Cu/Zn disorder on the Cu 2a sites; however, the concentration of defects in Cu–Zn planes is higher, which may explain why this is often thought to be the dominant mechanism in the order–disorder transition.Extending the MC procedure to treat off-stoichiometric kesterites, as are often found to produce the highest-performing devices, could provide insights into the origin of the performance improvement. It has been observed that the critical temperature is not altered through tuning of the stoichiometry, but it has been suggested that stoichiometry influences the kinetics of cation ordering.52 As our model considers only thermodynamic cation ordering, it could be used to isolate kinetic limitations for different stoichiometric CZTS compounds. Incorporating the effects of Cu/Zn disorder from our model on electron transport and recombination in kesterite solar cells will also be a valuable line for future research.
Data access statement
The Monte Carlo model is implemented in the code Eris, which is available from https://doi.org/10.5281/zenodo.1471439 under an MIT open-source license. Data from our Monte Carlo simulations is available from the online repository zenodo at https://doi.org/10.5281/zenodo.1481749.Conflicts of interest
There are no conflicts to declare.Acknowledgements
We thank Laurie Peter, Mark Weller, David Mitzi, Benjamin Morgan, Ji-Sang Park and Sunghyun Kim for useful discussions. This research has been funded by the EPSRC (Grant No. EP/L017792/1 and EP/K016288/1), as well as the EU Horizon 2020 Framework (STARCELL, Grant No. 720907). AW is supported by a Royal Society University Research Fellowship. We are grateful to the UK Materials and Molecular Modelling Hub for computational resources, which is partially funded by EPSRC (EP/P020194/1).References
- X. Liu, Y. Feng, H. Cui, F. Liu, X. Hao, G. Conibeer, D. B. Mitzi and M. Green, Prog. Photovoltaics, 2016, 24, 879–898 Search PubMed.
- W. Shockley and H. J. Queisser, J. Appl. Phys., 1961, 32, 510 CrossRef CAS.
- W. Wang, M. T. Winkler, O. Gunawan, T. Gokmen, T. K. Todorov, Y. Zhu and D. B. Mitzi, Adv. Energy Mater., 2013, 4, 1301465 CrossRef.
- C. Yan, J. Huang, K. Sun, S. Johnston, Y. Zhang, H. Sun, A. Pu, M. He, F. Liu, K. Eder, L. Yang, J. M. Cairney, N. J. Ekins-Daukes, Z. Hameiri, J. A. Stride, S. Chen, M. A. Green and X. Hao, Nat. Energy, 2018, 3, 764–772 CrossRef CAS.
- P. Jackson, R. Wuerz, D. Hariskos, E. Lotter, W. Witte and M. Powalla, Phys. Status Solidi RRL, 2016, 10, 583–586 CrossRef CAS.
- S. Bourdais, C. Choné, B. Delatouche, A. Jacob, G. Larramona, C. Moisan, A. Lafond, F. Donatini, G. Rey, S. Siebentritt, A. Walsh and G. Dennler, Adv. Energy Mater., 2016, 6, 1502276 CrossRef.
- R. Aninat, L.-E. Quesada-Rubio, E. Sanchez-Cortezon and J.-M. Delgado-Sanchez, Thin Solid Films, 2017, 633, 146–150 CrossRef CAS.
- S. K. Wallace, D. B. Mitzi and A. Walsh, ACS Energy Lett., 2017, 2, 776–779 CrossRef CAS.
- J. Li, D. Wang, X. Li, Y. Zeng and Y. Zhang, Adv. Sci., 2018, 1700744 CrossRef.
- J. S. Park, S. Kim, Z. Xie and A. Walsh, Nat. Rev. Mater., 2018, 3, 194–210 CrossRef CAS.
- S. Kim, J.-S. Park and A. Walsh, ACS Energy Lett., 2018, 3, 496–500 CrossRef CAS.
- J.-S. Park, S. Kim and A. Walsh, Phys. Rev. Mater., 2018, 2, 014602 CrossRef.
- T. K. Todorov, K. B. Reuter and D. B. Mitzi, Adv. Mater., 2010, 22, E156–E159 CrossRef CAS PubMed.
- T. Gokmen, O. Gunawan, T. K. Todorov and D. B. Mitzi, Appl. Phys. Lett., 2013, 103, 103506 CrossRef.
- L. L. Baranowski, P. Zawadzki, S. Lany, E. S. Toberer and A. Zakutayev, Semicond. Sci. Technol., 2016, 31, 123004 CrossRef.
- S. Lany, A. N. Fioretti, P. P. Zawadzki, L. T. Schelhas, E. S. Toberer, A. Zakutayev and A. C. Tamboli, Phys. Rev. Mater., 2017, 1, 035401 CrossRef.
- W. L. Bragg and E. J. Williams, Proc. R. Soc. A, 1934, 145, 699–730 CrossRef CAS.
- W. L. Bragg and E. J. Williams, Proc. R. Soc. A, 1935, 151, 540–566 CrossRef CAS.
- E. J. Williams, Proc. R. Soc. A, 1935, 152, 231–252 CrossRef CAS.
- S. Chen, J.-H. Yang, X. G. Gong, A. Walsh and S.-H. Wei, Phys. Rev. B: Condens. Matter Mater. Phys., 2010, 81, 245204 CrossRef.
- S. Schorr, Sol. Energy Mater. Sol. Cells, 2011, 95, 1482–1488 CrossRef CAS.
- T. Washio, H. Nozaki, T. Fukano, T. Motohiro, K. Jimbo and H. Katagiri, J. Appl. Phys., 2011, 110, 074511 CrossRef.
- B. G. Mendis, M. D. Shannon, M. C. Goodman, J. D. Major, R. Claridge, D. P. Halliday and K. Durose, Prog. Photovoltaics, 2012, 22, 24–34 Search PubMed.
- D. M. Többens, G. Gurieva, S. Levcenko, T. Unold and S. Schorr, Phys. Status Solidi B, 2016, 253, 1890–1897 CrossRef.
- J. J. S. Scragg, L. Choubrac, A. Lafond, T. Ericson and C. Platzer-Björkman, Appl. Phys. Lett., 2014, 104, 041911 CrossRef.
- G. Rey, A. Redinger, J. Sendler, T. P. Weiss, M. Thevenin, M. Guennou, B. E. Adib and S. Siebentritt, Appl. Phys. Lett., 2014, 105, 112106 CrossRef.
- A. Ritscher, M. Hoelzel and M. Lerch, J. Solid State Chem., 2016, 238, 68–73 CrossRef CAS.
- G. Rey, T. Weiss, J. Sendler, A. Finger, C. Spindler, F. Werner, M. Melchiorre, M. Hála, M. Guennou and S. Siebentritt, Sol. Energy Mater. Sol. Cells, 2016, 151, 131–138 CrossRef CAS.
- K. Rudisch, Y. Ren, C. Platzer-Björkman and J. Scragg, Appl. Phys. Lett., 2016, 108, 231902 CrossRef.
- K. Yu and E. A. Carter, Chem. Mater., 2016, 28, 864–869 CrossRef CAS.
- A. Polizzotti, I. L. Repins, R. Noufi, S.-H. Wei and D. B. Mitzi, Energy Environ. Sci., 2013, 6, 3171 RSC.
- S. Siebentritt, Nat. Energy, 2017, 2, 840–841 CrossRef.
- K. Sun, C. Yan, F. Liu, J. Huang, F. Zhou, J. A. Stride, M. Green and X. Hao, Adv. Energy Mater., 2016, 6, 1600046 CrossRef.
- M. A. Lloyd, D. Bishop, O. Gunawan and B. McCandless, 2016, IEEE 43rd Photovoltaic Specialists Conference (PVSC), 2016 Search PubMed.
- P. Zawadzki, A. Zakutayev and S. Lany, Phys. Rev. B: Condens. Matter Mater. Phys., 2015, 92, 201204 CrossRef.
- P. Zawadzki, A. Zakutayev and S. Lany, Phys. Rev. Appl., 2015, 3, 034007 CrossRef.
- S. P. Ramkumar, A. Miglio, M. J. van Setten, D. Waroquiers, G. Hautier and G.-M. Rignanese, Phys. Rev. Mater., 2018, 2, 085403 CrossRef.
- J. J. S. Scragg, J. K. Larsen, M. Kumar, C. Persson, J. Sendler, S. Siebentritt and C. P. Björkman, Phys. Status Solidi B, 2015, 253, 247–254 CrossRef.
- S. Shang, Y. Wang, G. Lindwall, N. R. Kelly, T. J. Anderson and Z.-K. Liu, J. Phys. Chem. C, 2014, 118, 24884–24889 CrossRef CAS.
- B. Monserrat, J.-S. Park, S. Kim and A. Walsh, Appl. Phys. Lett., 2018, 112, 193903 CrossRef.
- J. J. S. Scragg, J. K. Larsen, M. Kumar, C. Persson, J. Sendler, S. Siebentritt and C. P. Björkman, Phys. Status Solidi B, 2015, 253, 247–254 CrossRef.
- C. J. Bosson, M. T. Birch, D. P. Halliday, K. S. Knight, A. S. Gibbs and P. D. Hatton, J. Mater. Chem. A, 2017, 5, 16672–16680 RSC.
- O. Tange, The USENIX Magazine, 2011, 36, pp. 42–47 Search PubMed.
- K. Momma and F. Izumi, J. Appl. Crystallogr., 2011, 44, 1272–1276 CrossRef CAS.
- T. Shibuya, J. M. Skelton, A. J. Jackson, K. Yasuoka, A. Togo, I. Tanaka and A. Walsh, APL Mater., 2016, 4, 104809 CrossRef.
- J. D. Gale and A. L. Rohl, Mol. Simul., 2003, 29, 291–341 CrossRef CAS.
- M. Quennet, A. Ritscher, M. Lerch and B. Paulus, J. Solid State Chem., 2017, 250, 140–144 CrossRef CAS.
- N. Metropolis, A. W. Rosenbluth, M. N. Rosenbluth, A. H. Teller and E. Teller, J. Chem. Phys., 1953, 21, 1087–1092 CrossRef CAS.
- M. E. J. Newman and G. T. Barkema, The Ising Model and the Metropolis Algorithm, Oxford University Press, 1999 Search PubMed.
- T. Gershon, D. Bishop, P. Antunez, S. Singh, K. W. Brew, Y. S. Lee, O. Gunawan, T. Gokmen, T. Todorov and R. Haight, Curr. Opin. Green Sustain. Chem., 2017, 4, 29–36 CrossRef.
- E. I. Parkhomenko, Piezoelectric and Pyroelectric Effects in Minerals, Springer US, 1971 Search PubMed.
- K. Rudisch, A. Davydova, C. Platzer-Björkman and J. Scragg, J. Appl. Phys., 2018, 123, 161558 CrossRef.
Footnote |
| † Electronic supplementary information (ESI) available. See DOI: 10.1039/c8ta04812f |
| This journal is © The Royal Society of Chemistry 2019 |

