 Open Access Article
Creative Commons Attribution 3.0 Unported Licence
Electrochemical mechanisms of an advanced low-temperature fuel cell with a SrTiO3 electrolyte
Gang
Chen
 *ab,
Hailiang
Liu
a,
Yang
He
a,
Linlin
Zhang
a,
Muhammad Imran
Asghar
cd,
Shujiang
Geng
ab and
Peter D.
Lund
 *c
*c
aSchool of Metallurgy, Northeastern University, Shenyang, 110819, PR China. E-mail: chengang@smm.neu.edu.cn
bLiaoning Key Laboratory for Metallurgical Sensor and Technology, Northeastern University, Shenyang, 110819, PR China
cNew Energy Technologies Group, Department of Applied Physics, Aalto University School of Science, P. O. Box 15100, FI-00076 Aalto, Espoo, Finland. E-mail: peter.lund@aalto.fi
dHubei Collaborative Innovation Centre for Advanced Organic Chemical Materials, Faculty of Physics and Electronic Science, Hubei University, Wuhan 430062, PR China
First published on 25th March 2019
Abstract
The electrochemical mechanisms and performance of a symmetrical low-temperature SOFC with a single oxide as the electrolyte are investigated here. The fuel cell has a layered Ni foam–Ni0.8Co0.15Al0.05LiO2 (NCAL)/SrTiO3(STO)/NCAL–Ni foam structure. A 0.8 mm thick layer of STO is used as the electrolyte and NCAL-coated nickel foam is used as the electrode on both sides of the cell. The maximum power densities of the cell were 0.31, 0.44, and 0.62 W cm−2 in a H2/air atmosphere at 450, 500, and 550 °C, respectively. The corresponding ionic conductivities of the STO electrolyte were 0.16, 0.21, and 0.24 S cm−1. Ion filtration experiments with densified Gd-doped CeO2/STO and SrCe0.95Y0.05O3−δ/STO double layer electrolytes indicated that both oxygen ions and protons act as charge carriers in the STO electrolyte. XPS, TGA, and HRTEM analyses indicate that lithium carbonate, which originates from the NCAL, coats the STO electrolyte and forms a core–shell structure in the fuel cell test atmosphere. Lithium carbonate between the surface and interface of the STO particles may provide a pathway for oxygen ion and proton conduction.
1. Introduction
Solid oxide fuel cells (SOFCs) with nanocomposites and/or nanocrystalline oxides as electrolytes have attracted a lot of attention.1–6 The electrolyte of the cell is usually a nanocomposite of two oxides or a single nanocrystalline oxide material, such as a mixture of Gd-doped CeO2 (GDC) and Li–Ni–Zn oxide (LNZ), or a single nano-GDC, which can be used as an electrolyte.3,7 In this kind of cell structure, the electrolyte is usually made of a semiconductor material, for which reason this type of fuel cell is also called a semiconductor ionic fuel cell (SIFC).1,2,8–12Unlike traditional SOFC cermet anodes (Ni/YSZ, Ni/GDC) and ceramic oxide cathodes (LSM, LSCF, etc.), lithium containing metal oxides such as Ni0.8Co0.15Al0.05LiO2 (NCAL) are commonly used as electrodes in SIFCs.1,5,8–13 A SIFC shows better electrochemical performance in the low temperature range (300–600 °C) than a traditional SOFC with the same electrolyte thickness.1,8,9 We found in a previous study that the maximum power density of a SIFC with a 0.5 mm La0.25Sr0.75TiO3 (LST) layer as the electrolyte and nickel foam coated NCAL as the symmetrical electrode could reach 908 mW cm−2 at 550 °C in H2/air.1 The excellent catalytic activity and high conductivity of Ni foam coated NCAL electrodes for the HOR and the ORR play an important role in achieving high performance with the LST electrolyte cell.13 Asghar et al. used a composite of wide bandgap lithium–nickel–zinc-oxide (LNZ) and gadolinium-doped-cerium-oxide (GDC) as the electrolyte to prepare two kinds of cells with Au/GDC-LNZ/Au and Ni foam–NCAL/GDC-LNZ/NCAL–Ni foam structures. It was found that the maximum power density of the cell with Ni foam–NCAL as the electrodes reached 801 mW cm−2 at 550 °C, which was higher than that when Au was used as the electrodes (357 mW cm−2).7
The ionic conductivity of a LST electrolyte is high, e.g. 0.22 S cm−1 at 550 °C.1 The ionic conductivity of eutectic mixtures composed of Ce0.85Sm0.15O2 (SDC) and Na2CO3, Li2CO3, K2CO3 (NLK) could even reach >0.5 S cm−1 at 550 °C.14,15 With BaZr0.9Y0.1O3−δ (BZY), which is an electrolyte material used in traditional SOFCs, a nanocrystalline electrolyte had an ionic conductivity of 0.33 S cm−1 at 550 °C. The ionic conductivity of these electrolytes is much higher than that of the traditional YSZ, GDC, LSGM, and BZY electrolytes densified by sintering at temperatures higher than 1400 °C.16–18 For example, the conductivity of GDC and BZY is below 0.05 S cm−1 at 550 °C.16,19,20 The new electrolyte structure reported here offers an alternative for improving the low temperature ionic conductivity of SOFC materials.
It is well known that LST is an electronic conductor in a reducing atmosphere, but it is also a semiconductor with a relatively wide band gap in an air atmosphere.21–23 This kind of semiconductor material as the electrolyte does not cause short circuiting inside the fuel cell.1,24,25 Zhou et al. recently used a mixed electronic and ionic conductor, SmNiO3 (SNO), as a SOFC electrolyte with a power output of 225 mW cm−2 at 500 °C.24 Zhou et al. also introduced the concept of strong electron correlation and proposed that the hydrogenation process at the anode of the cell creates an electrically insulating H-SNO-layer on the anode side. Such a layer on the anode transforms the SNO from a mixed conductor into an ionic conductor.24 Lan et al. reported a SOFC with 0.79 mm thick LixAl0.5Co0.5O2 as the electrolyte and obtained 173 mW cm−2 at 525 °C, when silver was used as the cathode and anode.25 Zhu et al. fabricated cells by mixing oxygen ions and the electronic mixed conductor LSCF with other oxide materials as the electrolyte and achieved good electrochemical performance without short circuiting the cell.2
These types of electrolytes have a high ionic conductivity. It has been found that a core–shell structure consisting of an oxide core and a carbonate shell can be formed in the composite electrolyte when mixed with a carbonate (e.g. Li2CO3, Na2CO3, K2CO3).4,14 Interface conduction of ions seems to play an important role in these cases. However, it is not fully clear why oxide electrolytes without carbonate, such as LST, BZY, La0.2Sr0.25Ca0.45TiO3, and Sr2Fe1.5Mo0.5Ox, also have high ionic conductivity.1,5,26 The oxide material SrTiO3 (STO) is a perovskite ABO3 semiconductor with a band gap of about 3.2 eV.27 STO has a fairly high conductivity when doping at A and/or B sites and is thus a promising candidate for an ionic conducting material, but this has not been previously investigated in detail. The main purpose of this paper is to improve the understanding of the ionic conduction mechanisms of a STO semiconductor in a SIFC fuel cell. For this purpose, we prepared a cell with a Ni-foam-NCAL/STO/NCAL-Ni-foam structure, which was analysed and characterized in detail, both electrochemically and structurally.
2. Experimental
SrTiO3 powder was synthesized by the sol–gel method.1 Firstly, SrCO3 was dissolved in nitric acid. Ti[OCH(CH3)2]4 was dissolved in ethylene glycol (volume ratio 1![[thin space (1/6-em)]](https://www.rsc.org/images/entities/char_2009.gif) :
:![[thin space (1/6-em)]](https://www.rsc.org/images/entities/char_2009.gif) 4) with gentle magnetic stirring. Citric acid was then added into the Ti[OCH(CH3)2]4 and ethylene glycol solution with a Ti cation to citric acid mole ratio of 1
4) with gentle magnetic stirring. Citric acid was then added into the Ti[OCH(CH3)2]4 and ethylene glycol solution with a Ti cation to citric acid mole ratio of 1![[thin space (1/6-em)]](https://www.rsc.org/images/entities/char_2009.gif) :
:![[thin space (1/6-em)]](https://www.rsc.org/images/entities/char_2009.gif) 4. The solutions with a stoichiometric ratio of Ti4+ aqueous solution to Sr nitric acid were mixed with gentle stirring for 12 h. The precursor solution was heated and stirred continuously for several hours to evaporate the water and form a brown gel. The gel was then dried and pyrolyzed on a hot plate at 530 °C in a ceramic crucible for 2 h. The pyrolyzed STO ash was sintered at 800, 1000, and 1200 °C in air for 5 h, respectively. Phases of the STO powder sintered at different temperatures were characterized by X-ray diffraction (XRD). A Rigaku D/Max-2500PC X-ray diffractometer with Cu-Kα radiation (λ = 0.15406 nm) was used (40 kV, 100 mA). The cross-sectional structural morphologies of the cells were obtained using an SSX-550 field emission scanning electron microscope (FE-SEM, Japan). The surface compositions and the oxidation state of the STO powder before and after the performance test were analyzed by FTIR absorption spectroscopy and X-ray photoelectron spectroscopy (XPS). The XPS spectra were recorded on a Thermo Scientific ESCALAB 250Xi XPS system with a monochromatic Al/Mg dual anode X-ray source. The bonding energy and oxidation state of the oxygen can be obtained by high-resolution scanning. NCAL powder was purchased from Tianjin Bamo Science & Technology Joint Stock Ltd., China, for use as the electrode material. Ni foam with a thickness of 2 mm was used as the current collector and cell support. The NCAL powder and terpineol was mixed into a slurry. The slurry was coated on the Ni foam and baked in an oven at 80 °C for 20 min. The Ni-foam coated with NCAL was then cut into a wafer with a diameter of 13 mm. The STO powder was sandwiched between two Ni foam-NCAL pellets and compressed at 360 MPa into a single cell with diameter of 13 mm. The effective area of the as-prepared symmetrical cell Ni-NCAL/STO/NCAL-Ni was 0.64 cm2. The electrochemical performance of the cell was tested with H2 fuel and air oxidant. The flow rate of both H2 and air was 150 ml min−1. The impedance of the cells was measured between 0.1 Hz and 1 MHz using a Princeton electrochemical workstation (Versa STAT3) with AC voltage (amplitude 10 mV under open-circuit conditions). The I–V curves of the cells were measured using computerized instruments (IT8511 + 120 V/30 A/150 W).
4. The solutions with a stoichiometric ratio of Ti4+ aqueous solution to Sr nitric acid were mixed with gentle stirring for 12 h. The precursor solution was heated and stirred continuously for several hours to evaporate the water and form a brown gel. The gel was then dried and pyrolyzed on a hot plate at 530 °C in a ceramic crucible for 2 h. The pyrolyzed STO ash was sintered at 800, 1000, and 1200 °C in air for 5 h, respectively. Phases of the STO powder sintered at different temperatures were characterized by X-ray diffraction (XRD). A Rigaku D/Max-2500PC X-ray diffractometer with Cu-Kα radiation (λ = 0.15406 nm) was used (40 kV, 100 mA). The cross-sectional structural morphologies of the cells were obtained using an SSX-550 field emission scanning electron microscope (FE-SEM, Japan). The surface compositions and the oxidation state of the STO powder before and after the performance test were analyzed by FTIR absorption spectroscopy and X-ray photoelectron spectroscopy (XPS). The XPS spectra were recorded on a Thermo Scientific ESCALAB 250Xi XPS system with a monochromatic Al/Mg dual anode X-ray source. The bonding energy and oxidation state of the oxygen can be obtained by high-resolution scanning. NCAL powder was purchased from Tianjin Bamo Science & Technology Joint Stock Ltd., China, for use as the electrode material. Ni foam with a thickness of 2 mm was used as the current collector and cell support. The NCAL powder and terpineol was mixed into a slurry. The slurry was coated on the Ni foam and baked in an oven at 80 °C for 20 min. The Ni-foam coated with NCAL was then cut into a wafer with a diameter of 13 mm. The STO powder was sandwiched between two Ni foam-NCAL pellets and compressed at 360 MPa into a single cell with diameter of 13 mm. The effective area of the as-prepared symmetrical cell Ni-NCAL/STO/NCAL-Ni was 0.64 cm2. The electrochemical performance of the cell was tested with H2 fuel and air oxidant. The flow rate of both H2 and air was 150 ml min−1. The impedance of the cells was measured between 0.1 Hz and 1 MHz using a Princeton electrochemical workstation (Versa STAT3) with AC voltage (amplitude 10 mV under open-circuit conditions). The I–V curves of the cells were measured using computerized instruments (IT8511 + 120 V/30 A/150 W).
3. Results and discussion
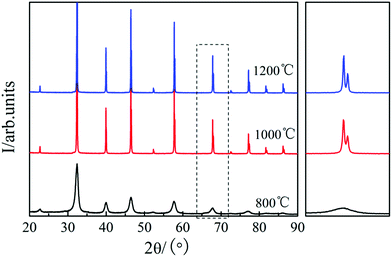
Fig. 1 shows the XRD patterns of the STO powder after sintering at 800, 1000, and 1200 °C in air for 5 h, respectively.23 It can be seen that a uniform perovskite phase was formed after sintering at 800 °C and no additional phase was formed.23 On increasing the sintering temperature to 1000 and 1200 °C, the diffraction peak of STO becomes sharper, and obvious peak splitting occurs at high angles due to two types of Kα X-rays (Kα1 and Kα2) with similar wavelength (Kα1 = 1.54056 Å, Kα2 = 1.54439 Å), which indicates that the STO formed a good cubic structure.23 The crystallinity of the STO sintered at 800 and 1000 °C was not good. The best cubic phase structure of STO was formed at 1200 °C. Therefore, the STO sintered at 1200 °C was used as the electrolyte material in this study.Fig. 2(a) shows the measured electrochemical performance of the test cell in H2. The open circuit voltages of the cell were 0.996, 0.974, and 0.996 V at 450, 500, and 550 °C, respectively. The maximum power densities of the cell were 0.31, 0.44, and 0.62 W cm−2 at 450, 500, and 550 °C, respectively. Fig. 2(b) shows the corresponding impedance spectra of the cell measured at 450, 500, and 550 °C under open-circuit conditions after the IV–IP test. The first intercept on the real axis in the high-frequency region represents the ohmic resistance, which was 0.51, 0.39, and 0.34 Ω cm2 at 450, 500, and 550 °C, respectively. As NCAL is a good cathode material with high electronic conductivity, combining it with nickel foam should result in even higher conductivity,28 meaning that the ohmic resistance of the cell should mainly originate from the STO electrolyte. The difference between the high-frequency and low-frequency intercepts on the real axis corresponds to the polarization resistance, which is composed of several overlapping suppressed arcs reflecting the physical and/or chemical processes associated with the hydrogen oxidation reaction (HOR) at the anode side and the oxygen reduction reaction (ORR) at the cathode side.29 The polarization resistances of the cell were 0.74, 0.36, and 0.26 Ω cm2 at 450, 500 and 550 °C, respectively. In our previous study, we found that the Ni foam–NCAL electrode had very good ORR and HOR catalytic activities.13 Li2CO3 and a cation-disordered ‘NiO-like’ phase were formed on the surface of the layered NCAL structure due to prolonged exposure to air and contained a large number of oxygen vacancies, which also provide ion pathways for oxygen ions and the ORR reaction, reducing the activation energy of the reaction. The Li2CO3 seems to originate from atmospheric CO2, as XRD measurements of virgin NCAL did not reveal any presence of Li2CO3, as discussed later in this paper. The Ni foam–NCAL anode was reduced to Ni, Li2CO3, and Li–Co–Al by H2 at the anode,13 and Li2CO3 may actually play a key role in the conduction of oxygen ions.13
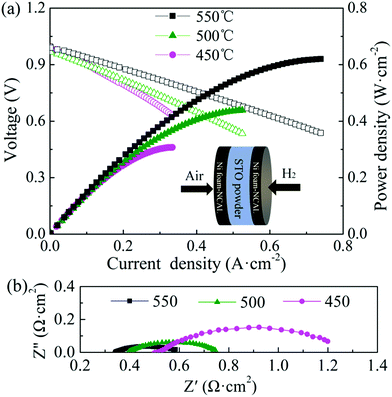 | ||
| Fig. 2 (a) IV–IP curves and (b) impedance spectra of the cell (under open circuit) at 450, 500, and 550 °C. | ||
Fig. 3 shows the SEM images of the cross section of the symmetrical cell with a Ni foam–NCAL/STO/NCAL–Ni foam structure. The thicknesses of the Ni foam–NCAL electrode and the STO electrolyte were 0.5 and 0.8 mm, respectively. From Fig. 3(c), it can be seen that the Ni foam–NCAL electrode has pores, while the STO electrolyte has no obvious pores. The magnification of the STO electrolyte shown in Fig. 3(b) shows that the morphology of STO partly remains as powder particles when not sintered at high temperatures. The interface between STO particles is very clear and there is no obvious grain growth phenomenon associated. It should be noted that the conventional YSZ and GDC and other electrolytes must undergo a high temperature sintering densification process to form crystals with a polygonal structure and grain boundaries.
 | ||
| Fig. 3 (a) Cross-sectional SEM images of the cell, (b) magnified image of the electrolyte, and (c) magnified image of the interface of the Ni foam–NCAL electrode and the STO electrolyte. | ||
Dense ceramic crystals were produced through sintering at a high temperature to prevent internal leakage of fuel gas. In this case, the high OCV shown in Fig. 2(a) indicates that the STO electrolyte is dense, and can prevent hydrogen permeating through it.
Densifying traditional YSZ, GDC, and LSGM electrolytes though sintering at high temperatures improves the oxygen vacancy and grain boundary diffusion and ionic conduction through the inherent material inside the crystal, whereas the ionic conduction mechanism of the STO electrolyte is different as the tightly contacted interface of the STO particles may provide ion transport paths. Based on the ohmic resistance of the cell, the ionic conductivities of the STO electrolyte were assessed to be 0.16 (450 °C), 0.21 (500 °C), and 0.24 (550 °C) S cm−1, which are an order of magnitude higher than those of the conventional densified electrolytes at the same temperatures. These values are comparable or even higher than those of several composite electrolytes reported for mixed ionic conductors and semiconductors with heterogeneous structures.30,31
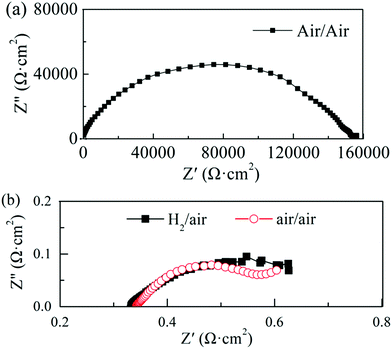
In our experiment, a high ionic conductivity was achieved with one semiconductor material (STO) only, contrary to mixed ionic-semiconductor heterostructures. In order to better understand the type of charge carriers and the ionic conduction mechanisms of the STO electrolyte, the impedance change of the cell was analyzed in different gas atmospheres. Fig. 4(a) shows the impedance spectrum of the cell operated at 550 °C with air on both sides before the fuel cell performance test. Several suppressed arcs with a total impedance of about 160 kΩ cm2 were observed in Fig. 4(a), indicating that the ionic conductivity of the STO electrolyte is very low in this state. Replacing air with H2 (10 min flow) at one side of the cell (Fig. 4(b)) yielded an ohmic resistance of 0.33 Ω cm2 at 550 °C and a polarization resistance of 0.27 Ω cm2, which is significantly lower than that under the air/air conditions. The H2 in the cell was then purged by N2 and air for 1 h, and the EIS measurement with air/air was repeated. The ohmic resistance of the cell in air/air now increased to 0.34 Ω cm2, which can be observed in Fig. 4(b). That is, when the atmosphere goes back to air/air after the H2/air atmosphere, the total resistance of the cell does not return to the original value of 160 kΩ cm2. It can also be seen from Fig. 4(b) that the ohmic resistance of the cell does not show any obvious change, which could indicate that the oxygen ions could be charge carriers in the STO electrolyte.
To further identify the main charge carrier types in a STO electrolyte, two double-layer electrolyte cells were prepared for ion filtration experiments, using pure oxygen ionic conductor GDC and SrCe0.95Y0.05O3−δ (SCY) pellets with a high proton transfer coefficient as oxygen ion and proton filters, respectively.16,32,33 Both GDC and SCY were synthesized by the sol–gel method. The specific preparation methods have been reported in the literature.34 The GDC and SCY electrolyte pellets were pressed at 100 MPa and sintered at 1550 and 1600 °C for 5 h.
Fig. 5(a) shows a schematic illustration of the cells with a GDC/STO and SCY/STO dual electrolyte, respectively. GDC and SCY were recognized as an oxygen ion and a proton conductor, respectively. The thickness of the GDC and SCY pellets was 0.8 mm. A 0.8 mm thick STO electrolyte was first co-pressed with a NCAL-coated Ni foam pellet under 360 MPa to form a half cell. The as-prepared GDC or SCY pellet was sandwiched into one piece with the NCAL coated Ni foam pellet and half-cell of STO/NCAL–Ni foam and assembled into a cell with the GDC/STO or SCY/STO dual electrolyte (see Fig. 5(a)). The GDC/STO or SCY/STO dual electrolyte cell was clamped with a stainless steel fixture; two alumina mesh sheets placed inside the stainless steel fixture were used as electrode supports to bring the electrode and electrolyte close together. The IV–IP curves of the fuel cells with the bi-layer GDC/STO and SCY/STO electrolytes at 550 °C are shown in Fig. 5(b). The OCV of the cell with GDC/STO was 1.06 V and with SCY/STO was 0.98. The maximum power density of the cell with GDC/STO was 32.3 and with SCY/STO was 16.9 mW cm−2. It should be noted that the oxygen ion conductivity of GDC and the proton conductivity of SCY is only 10−3 to 10−2 S cm−1 at 550 °C, which is much lower than the ionic conductivity of the STO electrolyte prepared in this study.16,32,33 The electrochemical performance of the cells with the densified GDC/STO and SCY/STO double layer electrolyte is determined by the thickness of the GDC and SCY. In this study, we used a 0.8 mm thick GDC or SCY electrolyte as the filter layer and the thickness of the STO was 0.8 mm, so the peak power density of the cells with the densified GDC/STO and SCY/STO double layer electrolyte indicates that the charge carriers of the STO electrolyte include both oxygen ions and protons.
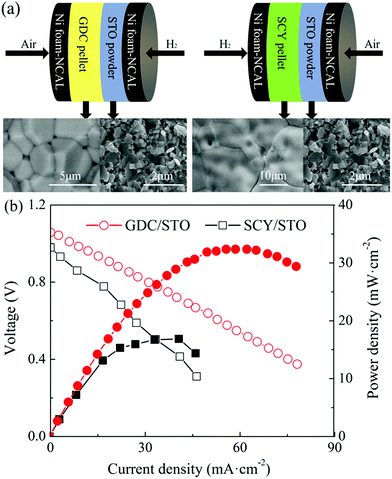 | ||
| Fig. 5 (a) Schematic illustration of the cell with a GDC/STO or SCY/STO dual electrolyte layer and (b) IV–IP curves of the cell with a GDC/STO or SCY/STO dual electrolyte layer. | ||
STO is a semiconductor material with a band gap of 3.2 eV, whose electrical conductivity is affected by the oxygen partial pressure.35–37 The high OCV of the STO electrolyte cell shown in Fig. 2(a) indicates that there is no internal short circuiting within the cell. There could be a similar charge separation mechanism as in a semiconductor-ionic LSCF-SCDC membrane fuel cell, but this aspect will require further verification.38 The STO prepared has a typical cubic structure and the bulk phase should have no oxygen vacancies. It has been widely reported that a high-mobility two dimensional electron gas (2DEG) exists at the interface of the insulating oxides SrTiO3 and LaAlO3, and that this conducting interface exhibits interesting phenomena on electron conduction such as high electron mobility and superconductivity.39–42 However, observations on the high ionic conductivity of the STO have rarely been reported.
Fig. 6(a) and (b) show the high-angle annular dark field (HAADF)-STEM image and annular bright field (ABF)-STEM image of the STO powder before the performance test. The red and yellow circles in Fig. 6(a) represent the Sr and Ti cations, respectively. STO is a typical ABO3 perovskite oxide.
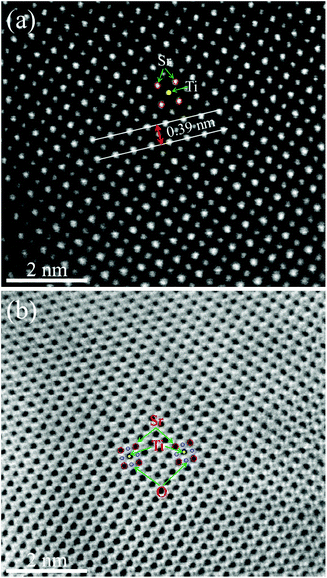 | ||
| Fig. 6 HRTEM images of STO powder before the performance test. (a) HAADF-STEM image and (b) ABF-STEM image. | ||
The spacing between the Sr atoms at the A-site is about 0.39 nm (Fig. 6(a)), which proves that the as-prepared STO is a typical cubic structure. This result is consistent with the XRD results shown in Fig. 1. In the ABF-STEM image in Fig. 6(b), the blue circles between two Sr atoms represent the oxygen atoms. It can be seen that the as-prepared completely stoichiometric STO has no obvious intrinsic oxygen vacancies, so the bulk phase is unlikely to exhibit ionic conductivity. Thus, the interface of the STO particles becomes the most probable path for ionic conduction. According to the EIS results in Fig. 4, the ionic conductivity of STO in different atmospheres is very different, which indicates that the STO electrolyte may undergo phase transition or structural change when hydrogen is introduced, i.e. the conductivity of the STO electrolyte changes greatly when H2 is fed to the anode. Similar phenomena have been found in a cell with a Ni foam–NCAL/LST/NCAL–Ni foam structure using LST as the electrolyte.1 When hydrogen is fed into the cell, the conductivity of the STO electrolyte increases from near-insulation to 0.24 S cm−1 at 550 °C. To check if any structural changes had taken place in the STO electrolyte, the surface morphology of the STO was characterized by HRTEM before and after the performance test. Fig. 7(a) shows the HRTEM image of the original STO powder synthesized. Fig. 7(b) and (c) show the HRTEM images of the STO powder scraped from the cell after the electrochemical performance testing. From Fig. 7(a)–(c) it can be seen that the interior of the STO particles is a perovskite before and after performance testing, and an amorphous layer is formed on the surface of the STO particles after testing in a fuel cell atmosphere.
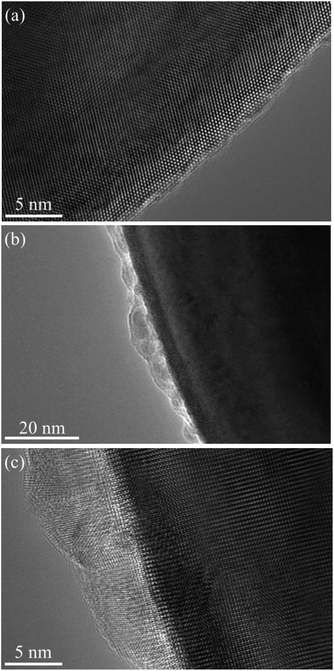 | ||
| Fig. 7 HRTEM images of STO powder before and after the performance test: (a) raw powder and (b) and (c) STO powder scraped from the cell after electrochemical performance testing. | ||
Fig. 8(a) and (b) show the C 1s and the O 1s XPS spectra of the as-prepared STO powder and the STO powder scraped from the cell after the performance test. In the C 1s XPS spectra, the peak located at 284 eV is attributed to C–H, and the peak at 289 eV is attributed to CO32−.43 From the XPS spectra of C 1s, it can be seen that carbonates appeared on the STO surface after the cell performance test. The peak center located at 528 eV represents the lattice oxygen in the STO, and the peak located at 530 eV is attributed to oxygen in a low oxidation state including the CO32− and O–H bonds from adsorbed water molecules and the presence of oxygen defects.43,44 The XPS spectra of O 1s also show that a large amount of oxygen with high oxidation state, including oxygen vacancies, OH groups, and carbonates, appear on the STO surface after performance testing. The results of XPS indicate that carbonates enter the STO electrolyte during the performance test. Fig. 9 shows the TGA curves of the STO powder before the test and powder scraped from the cell after the performance test. It should be noted that the melting point of lithium carbonate is 723 °C.45 The TGA curves show a weight loss in the STO at around 720 °C after the performance test, which is very close to the melting point of Li2CO3, which may indicate that the carbonate on the STO surface during the performance test could be lithium carbonate, although we have not detected the Li element directly.
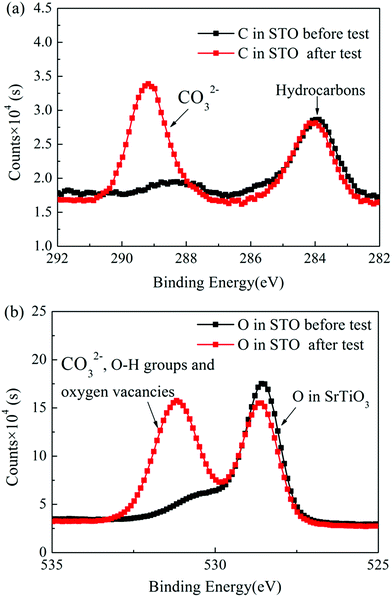 | ||
| Fig. 8 (a) C 1s and (b) O 1s XPS spectra of the as-prepared STO powder and the STO powder scraped from the cell after the performance test. | ||
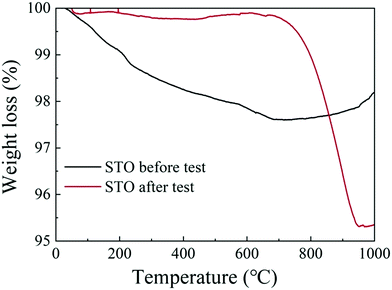 | ||
| Fig. 9 Thermogravimetric analysis (TGA) curves of the STO powder before the test (black line) and of the STO powder scraped from the cell after the performance test (red line). | ||
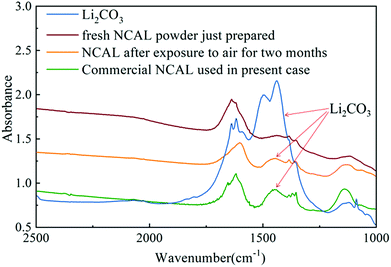
Several researchers have reported that the composite electrolyte composed of lithium carbonate and SDC or GDC has high ionic conductivity.4,14,15 As discussed previously, the STO electrolyte may only allow conduction of oxygen ions and protons through the STO particle interfaces. However, the presence of the alkali carbonate (in this case Li2CO3) on the STO particles leads to a core–shell structure, which may introduce the carbonate ion conduction through the interfaces between the STO oxide phase and the amorphous carbonate phase. In the literature, the Arrhenius plots of electrolytes consisting of a mixture of doped ceria and alkali carbonates show a sharp increase in the ionic conductivity around the eutectic or melting temperature of the alkali carbonates.15 The presence of alkali carbonates in the doped ceria increased the ionic conductivity of the electrolyte layer by either introducing the carbonate ion conduction or improving the oxygen ion conduction between the carbonate/doped-ceria interface in the electrolyte layer. Similarly, in this STO/Li2CO3 composite electrolyte, carbonate partially melts or softens at high temperatures, forming channels for high-speed ion conduction.4,14 In the STO electrolyte cell prepared, lithium carbonate was formed on the STO electrolyte surface after hydrogen was introduced into the anode. The origin of the carbonate is important as no carbonate salt was used in the electrolyte itself. There are only two possible sources for carbonate in this case: CO2 in the air or carbon in the NCAL electrode. It has earlier been reported that lithium carbonate can be produced on a NCAL surface after long-term exposure to air.46 In our previous study we also found the presence of lithium carbonate on commercial NCAL surfaces by XPS and FTIR.13 To study the formation of Li2CO3 in NCAL exposed to air, NCAL was prepared and exposed to air for 2 months. Fig. 10 shows the FTIR spectra of pure Li2CO3 powder, commercially purchased NCAL used in this study, and the as-prepared NCAL before and after exposure to air for 2 months. Zhuang et al. reported that the strong peak at 1422 cm−1 and shoulder at 1479 cm−1 in FTIR spectra of NCAL are the C–O asymmetric and symmetric stretching modes of Li2CO3.46
As can be seen from Fig. 10, there is no obvious Li2CO3 peak on the surface of fresh NCAL powder just prepared. Two adjacent peaks located between 1380 and 1450 cm−1 proved that Li2CO3 was formed on the surface of NCAL after exposure to air for 2 months and the commercial NCAL used in this study, which means that Li2CO3 already existed on the commercial NCAL surface when purchased. This lithium carbonate may be the main source of the carbonate in the amorphous layer of the STO surface. We hypothesize that Li2CO3 is reduced to LiOH which is in the liquid phase (melting point 462 °C), which could enable entry into the STO electrolyte, but verification of this was outside the scope of the present work. How the carbonate exactly enters into the STO electrolyte still needs further research. In the present study, it was found that the STO and the carbonate produced on the surface of the fuel cell constitute a core–shell composite electrolyte with high ionic conductivity at low temperatures, with oxygen ions, protons and carbonate ions as the main charge carriers. In this core–shell electrolyte, the STO provides a solid support structure, but also improves the ionic conductivity, though the amorphous layer may be the main channel for ion transport. As was earlier reported, the ionic conductivity of an oxide-ion conductor can significantly be enhanced by formation of a heterostructure between the oxide-ion conductor and a semiconductor in a composite.2 Such an enhancement of the ionic conductivity has also been reported in YSZ/STO and YSZ-STO/SDC-STO heterostructures.30,31
A detailed and systematic experimental study is also recommended to quantitatively observe the diffusion of lithium carbonate into the STO electrolyte from the STO/NCAL interface. The temperature and the thickness (or concentration) of the lithium carbonate on the STO/NCAL interface affect the composition of the composite electrolyte (STO + Li2CO3). An optimized composition of the electrolyte could improve the electrochemical performance of the cell.
4. Conclusions
A layered Ni foam–Ni0.8Co0.15Al0.05LiO2 (NCAL)/SrTiO3 (STO)/NCAL–Ni foam structure was investigated for low-temperature (450–550 °C) fuel cell use. The focus was on the underlying electrochemical mechanisms. Different from many previous studies, a single-oxide material was used as the electrolyte base.STO powder was synthesized by the sol–gel method and a symmetrical fuel cell was prepared by the co-press method using a 0.8 mm thick STO electrolyte layer. The maximum power density achieved was 0.62 mW cm−2 in H2/air at 550 °C, and the corresponding ionic conductivity of the STO electrolyte was 0.24 S cm−1. It was found that the STO electrolyte experiences a major transition in the ionic conductivity after introducing H2 into the cell, which changes it from a near-insulator to a high ionic conductor. The experimental results of densified GDC/STO and SCY/STO double layer electrolyte cells showed that the STO electrolyte is a mixed conductor of protons and oxygen ions when using a Ni foam–NCAL/STO/NCAL–Ni foam structure. XPS, TGA, and HRTEM results indicate that a lithium carbonate layer is formed on the STO surface after performance testing, which constitutes a composite electrolyte with a core–shell structure. This STO–Li2CO3 composite electrolyte has high oxygen ion, proton and carbonate ion conductivity. The carbonate seems to originate to NCAL from the atmospheric CO2 and is transferred from the NCAL electrode to the electrolyte. The mechanism of how lithium carbonate enters the STO electrolyte is a subject for future studies.
Conflicts of interest
There are no conflicts to declare.Acknowledgements
The authors acknowledge the National Natural Science Foundation of China (No. 51302033) and the Fundamental Research Funds for the Central Universities (No. N172504025) for financial support. The authors thank Mr Kai Yu at the School of Metallurgy of Northeastern University for assistance with the XRD and SEM measurements and Mr Yu Dong at the New Materials Technology Research Institute of Northeastern University for assistance with the STEM measurements. Dr Asghar acknowledges the Hubei 100 Talents Programme for their support. G. C. and P. L. conceived and conducted the study and wrote the manuscript. H. L. fabricated the fuel cells and performed the tests. H. L., Y. H. and L. Z. synthesized the powder material and performed the XPS, TGA, XRD and FTIR measurements. All the authors discussed the results and commented on the manuscript.References
- G. Chen, B. Zhu, H. Deng, Y. Luo, W. Sun, H. Liu, W. Zhang, X. Wang, Y. Qian, X. Hu, S. Geng and J. S. Kim, ACS Appl. Mater. Interfaces, 2018, 10, 33179–33186 CrossRef CAS PubMed.
- B. Zhu, Y. Huang, L. Fan, Y. Ma, B. Wang, C. Xia, M. Afzal, B. Zhang, W. Dong, H. Wang and P. D. Lund, Nano Energy, 2016, 19, 156–164 CrossRef CAS.
- R. Raza, X. Wang, Y. Ma and B. Zhu, J. Power Sources, 2010, 195, 6491–6495 CrossRef CAS.
- L. Fan, C. Wang, M. Chen and B. Zhu, J. Power Sources, 2013, 234, 154–174 CrossRef CAS.
- G. Chen, Y. Luo, W. Sun, H. Liu, Y. Ding, Y. Li, S. Geng, K. Yu and G. Liu, Int. J. Hydrogen Energy, 2018, 43, 12765–12772 CrossRef CAS.
- R. Raza, X. Wang, Y. Ma and B. Zhu, J. Power Sources, 2010, 195, 6491–6495 CrossRef CAS.
- M. I. Asghar, S. Jouttijärvi, R. Jokiranta, A.-M. Valtavirta and P. D. Lund, Nano Energy, 2018, 53, 391–397 CrossRef CAS.
- Y. Wu, L. Liu, X. X. Yu, J. Zhang, L. Y. Li, C. J. Yan and B. Zhu, Composites, Part B, 2018, 137, 178–183 CrossRef CAS.
- Y. Cai, B. Wang, Y. Wang, C. Xia, J. Qiao, P. A. van Aken, B. Zhu and P. Lund, J. Power Sources, 2018, 384, 318–327 CrossRef CAS.
- Y. Wu, C. Xia, W. Zhang, X. Yang, Z. Y. Bao, J. J. Li and B. Zhu, Adv. Funct. Mater., 2016, 26, 938–942 CrossRef CAS.
- R. Xu, Y. Wu, X. Y. Wang, J. Zhang, X. Yang and B. Zhu, Int. J. Hydrogen Energy, 2017, 42, 17495–17503 CrossRef CAS.
- L. Liu, Y. Y. Liu, L. Y. Li, Y. Wu, M. Singh and B. Zhu, Int. J. Hydrogen Energy, 2018, 43, 12739–12747 CrossRef CAS.
- G. Chen, W. Sun, Y. Luo, H. Liu, S. Geng, K. Yu and G. Liu, Int. J. Hydrogen Energy, 2018, 43, 417–425 CrossRef CAS.
- M. Imran Asghar, M. Heikkila and P. D. Lund, Mater. Today Energy, 2017, 5, 338–346 CrossRef.
- I. Khan, M. I. Asghar, P. D. Lund and S. Basu, Int. J. Hydrogen Energy, 2017, 42, 20904–20909 CrossRef CAS.
- R. O. Fuentes and R. T. Baker, J. Power Sources, 2009, 186, 268–277 CrossRef CAS.
- O. Yamamoto, Y. Arati, Y. Takeda, N. Imanishi, Y. Mizutani, M. Kawai and Y. Nakamura, Solid State Ionics, 1995, 79, 137–142 CrossRef CAS.
- K. Q. Huang, R. Tichy and J. B. Goodenough, J. Am. Ceram. Soc., 1998, 81, 2581–2585 CrossRef CAS.
- F. Iguchi, T. Yamada, N. Sata, T. Tsurui and H. Yugami, Solid State Ionics, 2006, 177, 2381–2384 CrossRef CAS.
- G. Chen, H. Kishimoto, K. Yamaji, K. Kuramoto and T. Horita, J. Electrochem. Soc., 2015, 162, F223–F228 CrossRef CAS.
- O. A. Marina, N. L. Canfield and J. W. Stevenson, Solid State Ionics, 2002, 149, 21–28 CrossRef CAS.
- G. Chen, H. Kishimoto, K. Yamaji, K. Kuramoto and T. Horita, J. Power Sources, 2014, 246, 49–54 CrossRef CAS.
- G. Chen, Y. M. Qian, M. Liu, W. Q. Ma, S. J. Geng, X. Y. Meng, K. Yu and G. Q. Liu, J. Power Sources, 2016, 328, 212–218 CrossRef CAS.
- Y. Zhou, X. Guan, H. Zhou, K. Ramadoss, S. Adam, H. Liu, S. Lee, J. Shi, M. Tsuchiya, D. D. Fong and S. Ramanathan, Nature, 2016, 534, 231–234 CrossRef CAS PubMed.
- R. Lan and S. Tao, Adv. Energy Mater., 2014, 4, 1301683 CrossRef.
- W. Dong, A. Yaqub, N. K. Janjua, R. Raza, M. Afzal and B. Zhu, Electrochim. Acta, 2016, 193, 225–230 CrossRef CAS.
- J. Park, U. Kim and K. Char, Appl. Phys. Lett., 2016, 108, 092106 CrossRef.
- C. Xia, B. Wang, Y. Ma, Y. Cai, M. Afzal, Y. Liu, Y. He, W. Zhang, W. Dong, J. Li and B. Zhu, J. Power Sources, 2016, 307, 270–279 CrossRef CAS.
- W. Pan, K. Chen, N. Ai, Z. Lü and S. P. Jiang, J. Electrochem. Soc., 2015, 163, F106–F114 CrossRef.
- J. Garcia-Barriocanal, A. Rivera-Calzada, M. Varela, Z. Sefrioui, E. Iborra, C. Leon, S. J. Pennycook and J. Santamaria, Science, 2008, 321, 676–680 CrossRef CAS PubMed.
- S. Lee, W. Zhang, F. Khatkhatay, H. Wang, Q. Jia and J. L. MacManus-Driscoll, Nano Lett., 2015, 15, 7362–7369 CrossRef PubMed.
- J. Guan, S. E. Dorris, U. Balachandran and M. L. Liu, Solid State Ionics, 1998, 110, 303–310 CrossRef CAS.
- S. Zhan, X. Zhu, B. Ji, W. Wang, X. Zhang, J. Wang, W. Yang and L. Lin, J. Membr. Sci., 2009, 340, 241–248 CrossRef CAS.
- G. Chen, W. Sun, Y. Luo, Y. He, X. Zhang, B. Zhu, W. Li, X. Liu, Y. Ding, Y. Li, S. Geng and K. Yu, ACS Appl. Mater. Interfaces, 2019, 11(11), 10642–10650 CrossRef CAS PubMed.
- N. Bachi, G. Bridoux, M. Villafuerte, J. M. Ferreyra, J. Kim, C. Figueroa and S. P. Heluani, Appl. Phys. Lett., 2017, 110 Search PubMed.
- T. Sun and M. Lu, Appl. Phys. A, 2012, 108, 171–175 CrossRef CAS.
- K. K. Adepalli, J. Yang, J. Maier, H. L. Tuller and B. Yildiz, Adv. Funct. Mater., 2017, 27, 1700243 CrossRef.
- B. Zhu, B. Wang, Y. Wang, R. Raza, W. Tan, J. Kim, P. Aken and P. Lund, Nano Energy, 2017, 37, 195–202 CrossRef CAS.
- A. Ohtomo and H. Y. Hwang, Nature, 2004, 427, 423–426 CrossRef PubMed.
- W. Meevasana, P. D. King, R. H. He, S. K. Mo, M. Hashimoto, A. Tamai, P. Songsiriritthigul, F. Baumberger and Z. X. Shen, Nat. Mater., 2011, 10, 114–118 CrossRef CAS PubMed.
- N. Reyren, S. Thiel, A. D. Caviglia, L. F. Kourkoutis, G. Hammerl, C. Richter, C. W. Schneider, T. Kopp, A. S. Ruetschi, D. Jaccard, M. Gabay, D. A. Muller, J. M. Triscone and J. Mannhart, Science, 2007, 317, 1196–1199 CrossRef CAS PubMed.
- S. Thiel, G. Hammerl, A. Schmehl, C. W. Schneider and J. Mannhart, Science, 2006, 313, 1942–1945 CrossRef CAS PubMed.
- R. F. Wright, E. R. Brand, M. Ziomek-Moroz, J. H. Tylczak and P. R. Ohodnicki, Electrochim. Acta, 2018, 290, 626–638 CrossRef CAS.
- L. Kumari, W. Z. Li, J. M. Xu, R. M. Leblanc, D. Z. Wang, Y. Li, H. Guo and J. Zhang, Cryst. Growth Des., 2009, 9, 3874–3880 CrossRef CAS.
- W. Yang, X. Tang, H. Zhang and H. Su, Ceram. Int., 2016, 42, 14609–14613 CrossRef CAS.
- G. V. Zhuang, G. Chen, J. Shim, X. Song, P. N. Ross and T. J. Richardson, J. Power Sources, 2004, 134, 293–297 CrossRef CAS.
| This journal is © The Royal Society of Chemistry 2019 |

