Two spirobifluorene-based fluorescent probes with aggregation-induced emission properties: synthesis and application in the detection of Zn2+ and cell imaging†
Jianyong
Wan‡
,
Wu
Zhang‡
,
Hongda
Guo
,
JingJing
Liang
,
Danyu
Huang
and
Haibo
Xiao
 *
*
Department of Chemistry, Shanghai Normal University, Shanghai 200234, P. R. China. E-mail: xiaohb@shnu.edu.cn
First published on 21st January 2019
Abstract
In this work, two spirobifluorene-based probes, namely SPF-1 and SPF-2, were designed and synthesized. They exhibited high selectivity and sensitivity toward Zn2+ with enhanced emissions, which could be attributed to the formation of an L–Zn complex. The detection limit of SPF-2 is 63 nM for Zn2+ and this is significantly lower than most previous reports. SPF-1 was successfully used for intracellular Zn2+ imaging. In addition, SPF-2 possesses two-photon absorption properties and has been applied in two-photon fluorescence cell imaging. This study is the first time that a spirobifluorene-based probe with aggregation-induced emission enhancement (AIEE) properties has been reported. We hope that this molecular design triggers further interest in using spiro-configured compounds in AIEE-based bioprobes for further applications.
1. Introduction
Zinc(II) is the second most abundant transition metal ion in the human body and actively involved in diverse biological processes.1,2 It constructs the catalytic active center of more than 300 enzymes as a cofactor, regulates protein and gene expression, and participates in neural signal transmission.3 Disorders in zinc ion metabolism are associated with various diseases such as Alzheimer's, Parkinson's disease, cerebral ischemia, Menkes and familial amyotropic lateral sclerosis.4,5 Therefore, it is crucial to develop fluorescent probes to detect the concentration of Zn2+.6Tang et al. reported aggregation-induced emission (AIE) or the aggregation-induced emission enhancement (AIEE) phenomenon in 2001.7 AIEE fluorogens usually have rotor structures, and are weakly-emissive or non-emissive in solution, but exhibit very strong emission upon the formation of aggregates.8 In the past few years, various AIEE-based chemosensors and biosensors have attracted significant attention owing to their potential use in real-world applications.9 Up until now, a series of one- and two-photon absorption (TPA) fluorescent probes have been designed and synthesized, which possess excellent AIEE properties.10–16
Spirobifluorene appears to be a good fluorophore core for fluorescent probes owing to its inherent rigid structure that efficiently suppresses excimer formation, which is frequently encountered in the solid state or in concentrated solutions. A successful example of a spirobifluorene-based fluorescent probe was reported by K.-T. Wong et al. in 2011, for the specific detection of NO.17 We have reported the design and synthesis of two-photon fluorescent probes based on the spirobifluorene motif for the first time.18–20 These spirobifluorene-based fluorescence probes have high extinction coefficients and photoluminescence (PL) quantum yields. However, no spirobifluorene-based probe with AIEE properties has been reported previously.
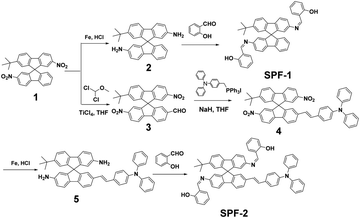
Herein, we report two fluorescent probes based on the spirobifluorene motif (Scheme 1) for the detection of Zn2+ by taking advantage of the AIEE feature. In addition, the applications in intracellular Zn2+ imaging and two-photon fluorescence cell imaging were investigated.
2. Experimental
2.1 Materials
The synthetic routes to SPF-1 and SPF-2 are shown in Scheme 1. Synthetic intermediates 1 and 2 were prepared according to our previously reported methods.21 All chemicals were of analytical grade and were used as received.2.2 Measurements
The melting points of the compounds were determined using WRX-4 microscope melting point apparatus. All nuclear magnetic resonance (NMR) spectra were obtained on a Bruker DRX 400 MHz spectrometer. Elemental analyses were performed using Atlantic Microlab. UV-Vis absorption spectra were determined using a Perkin Elmer Lambda 35 spectrophotometer. Fluorescence spectra were recorded on a Perkin Elmer LS55 instrument.The TPA cross-section of SPF-2 was measured at 800 nm using the open-aperture Z-scan technique using a high-power femtosecond laser (PHAROS High-Power Femtosecond Lasers sp). The pulse duration was about 190 fs (estimated as the full width half maximum (FWHM) of a Gaussian temporal profile). The light beam used was Top-hat and the focal length (f) was 250 mm. The TPA cross-section (σ) value can be calculated by using the equation: σ = hvβN0, in which N0 = NAC is the number density of the centers (NA is the Avogadro constant, C represents the solute molar concentration), and β is the TPA coefficient.22
2.3 Living cell cultures and imaging
A549 cells were incubated in DMEM medium with 10% fetal bovine serum at 37 °C under a 5% CO2 atmosphere. One day before the fluorescence imaging, the A549 cells were passaged and plated in 30 mm glass culture dishes. During the logarithmic growth phase, they were cultured to 50–70% culture fit in the presence of complete medium (2 mL). Afterwards, the cells on glass slides were washed with DMEM and fed with culture medium (contain 1% DMSO) containing the probe (50 μM) for 30 min at 37 °C under a 5% CO2 atmosphere. Subsequently, A549 cells were washed with PBS solution three times. One of the groups cells stained with SPF-1 was treated with 100 μM Zn2+ for another 30 min and washed three times with PBS solution.Two-photon fluorescence cell images were taken on an Ultimal IV confocal microscope equipped with a femtosecond Ti:sapphire laser.
2.4 Preparation of the compounds
![[thin space (1/6-em)]](https://www.rsc.org/images/entities/char_2009.gif) :
:![[thin space (1/6-em)]](https://www.rsc.org/images/entities/char_2009.gif) 1, v/v) to give a yellow solid (1.56 g). Yield: 46.0%. MP: 175–178 °C. 1H NMR (400 MHz, CDCl3, δ): 9.91 (s, 1H), 8.40 (dd, J = 8.4, 2.0 Hz, 1H), 8.34 (dd, J = 8.4, 2.0 Hz, 1H), 8.14 (dd, J = 15.0, 8.2 Hz, 2H), 8.04 (dd, J = 8.0, 1.1 Hz, 1H), 7.98 (d, J = 8.5 Hz, 1H), 7.92 (d, J = 8.2 Hz, 1H), 7.59 (m, J = 9.0, 8.2 Hz, 2H), 7.47 (d, J = 2.0 Hz, 1H), 7.31 (s, 1H), 6.73 (s, 1H), 1.18 (s, 9H).
1, v/v) to give a yellow solid (1.56 g). Yield: 46.0%. MP: 175–178 °C. 1H NMR (400 MHz, CDCl3, δ): 9.91 (s, 1H), 8.40 (dd, J = 8.4, 2.0 Hz, 1H), 8.34 (dd, J = 8.4, 2.0 Hz, 1H), 8.14 (dd, J = 15.0, 8.2 Hz, 2H), 8.04 (dd, J = 8.0, 1.1 Hz, 1H), 7.98 (d, J = 8.5 Hz, 1H), 7.92 (d, J = 8.2 Hz, 1H), 7.59 (m, J = 9.0, 8.2 Hz, 2H), 7.47 (d, J = 2.0 Hz, 1H), 7.31 (s, 1H), 6.73 (s, 1H), 1.18 (s, 9H).
![[thin space (1/6-em)]](https://www.rsc.org/images/entities/char_2009.gif) :
:![[thin space (1/6-em)]](https://www.rsc.org/images/entities/char_2009.gif) 1, V/V) to give 98 mg of a red solid (yield 54%). MP: 155–158 °C. 1H NMR (400 MHz, CDCl3) δ 8.36 (ddd, J = 7.9, 5.6, 2.1 Hz, 2H), 8.03–7.92 (m, 4H), 7.65 (dd, J = 8.1, 1.5 Hz, 1H), 7.60 (dd, J = 8.2, 1.7 Hz, 1H), 7.56 (d, J = 2.0 Hz, 2H), 7.30 (d, J = 3.3 Hz, 1H), 7.27 (s, 2H), 7.25 (s, 1H), 7.13–6.97 (m, 10H), 6.95 (s, 1H), 6.90–6.79 (m, 3H), 1.22 (s, 9H).
1, V/V) to give 98 mg of a red solid (yield 54%). MP: 155–158 °C. 1H NMR (400 MHz, CDCl3) δ 8.36 (ddd, J = 7.9, 5.6, 2.1 Hz, 2H), 8.03–7.92 (m, 4H), 7.65 (dd, J = 8.1, 1.5 Hz, 1H), 7.60 (dd, J = 8.2, 1.7 Hz, 1H), 7.56 (d, J = 2.0 Hz, 2H), 7.30 (d, J = 3.3 Hz, 1H), 7.27 (s, 2H), 7.25 (s, 1H), 7.13–6.97 (m, 10H), 6.95 (s, 1H), 6.90–6.79 (m, 3H), 1.22 (s, 9H).
![[thin space (1/6-em)]](https://www.rsc.org/images/entities/char_2009.gif) :
:![[thin space (1/6-em)]](https://www.rsc.org/images/entities/char_2009.gif) 7, v/v) to afford 0.252 g of a yellow solid 5 (75%). MP: 181–183 °C. 1H NMR (400 MHz, DMSO-d) 7.68 (d, J = 7.9 Hz, 1H), 7.63 (d, J = 8.0 Hz, 1H), 7.60–7.49 (m, 3H), 7.40 (d, J = 8.4 Hz, 2H), 7.40 (d, J = 8.4 Hz, 2H), 7.35–7.23 (m, 6H), 7.06–6.95 (m, 8H), 7.06–6.95 (m, 8H), 6.93 (s, 1H), 6.85 (d, J = 8.5 Hz, 2H), 6.69 (s, 1H), 6.57–6.51 (m, 3H), 5.85 (dd, J = 6.3, 2.0 Hz, 2H), 5.14 (d, J = 35.9 Hz, 4H), 1.10 (s, 9H).
7, v/v) to afford 0.252 g of a yellow solid 5 (75%). MP: 181–183 °C. 1H NMR (400 MHz, DMSO-d) 7.68 (d, J = 7.9 Hz, 1H), 7.63 (d, J = 8.0 Hz, 1H), 7.60–7.49 (m, 3H), 7.40 (d, J = 8.4 Hz, 2H), 7.40 (d, J = 8.4 Hz, 2H), 7.35–7.23 (m, 6H), 7.06–6.95 (m, 8H), 7.06–6.95 (m, 8H), 6.93 (s, 1H), 6.85 (d, J = 8.5 Hz, 2H), 6.69 (s, 1H), 6.57–6.51 (m, 3H), 5.85 (dd, J = 6.3, 2.0 Hz, 2H), 5.14 (d, J = 35.9 Hz, 4H), 1.10 (s, 9H).
3. Results and discussion
3.1 One-photon absorption
The one-photon absorption spectra of SPF-1 and SPF-2 in various organic solvents were investigated. The maximum absorption wavelength of SPF-2 is longer than that of SPF-1 (Table 1), which can be attributed to the incorporation of a diphenylaminoaryl-vinyl group into the spirobifluorene core of SPF-2. It can be seen from Table 1 that the absorption spectra of SPF-1 and SPF-2 exhibit almost no change with different polar solvents. However, the water content has a significant effect on the absorption response of the two compounds. It was noted that the absorption spectra of SPF-1 in the DMF/water and SPF-2 in 1,4-dioxane/water mixtures were all red-shifted and broadened.| Compound | SPF-1 | SPF-2 | ||||||
|---|---|---|---|---|---|---|---|---|
| Solvent | Toluene | THF | DCM | DMF | Toluene | THF | DCM | DMF |
| λ max (nm) | 362 | 360 | 363 | 361 | 397 | 396 | 398 | 400 |
In addition, the absorbance of SPF-1 and SPF-2 decreases with the increase of the water content (Fig. 1), respectively. The phenomena may be caused by the formation of their nanoaggregates.23,24
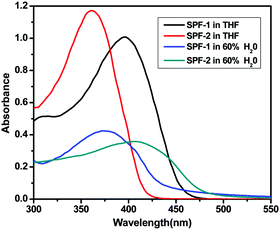 | ||
| Fig. 1 One-photon absorption spectra of SPF-1 and SPF-2 in THF and organic solvent/water mixtures (60% water in volume). | ||
3.2 AIEE properties
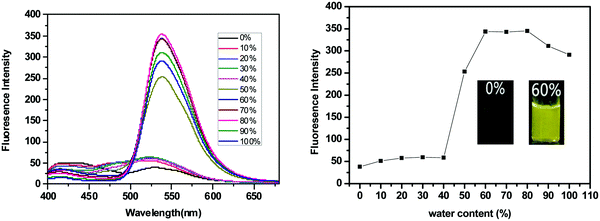
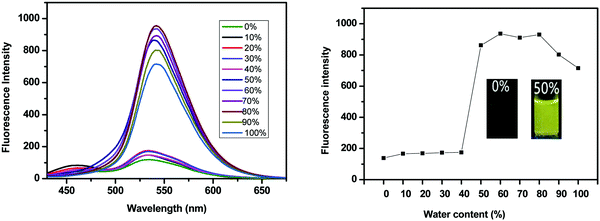
SPF-1 and SPF-2 are soluble in common organic solvents (such as toluene, THF, dichloromethane, 1,4-dioxane and DMF), but insoluble in pure water. We used anhydrous DMF as a good solvent and water as a poor solvent to investigate the AIEE attributes of SPF-1 by the precipitation method.23,25SPF-1 exhibited a relatively weak fluorescence emission (excited at 362 nm) in DMF solution (10 μM). As shown in Fig. 2, the fluorescence emission of SPF-1 began to increase when the water was added slowly. When the water content reached 50%, a significant fluorescent enhancement (at 538 nm) could be observed. At a water content of more than 60%, the fluorescence emission intensity reached the maximum (Fig. 2, right). Increasing water fractions can reduce the solubility of SPF-1 and the formation of SPF-1 aggregates in the DMF/water mixture was confirmed using dynamic light scattering (DLS) analysis (Fig. S1, ESI†). In the aggregated state, the intramolecular rotations are restricted, which blocks the nonradiative relaxation channel and actives the radiative decay.7 Apparently, the emission enhancement was caused by aggregation-induced effects. However, a further increase in the water content (>80%) caused the AIEE properties to undergo a slight decrease in the PL intensity. This phenomenon could be caused by the variation in the packing mode of the molecules in the aggregates.23,26Similar AIEE properties were obtained for SPF-2. When excited at 400 nm, SPF-2 emits weak fluorescence in pure 1,4-dioxane solution (10 μM). Addition of water into the 1,4-dioxane solution, however, aggregates the SPF-2 molecules and enhances the fluorescence emission intensity (at 540 nm) (Fig. 3, left). SPF-2 gave a maximum luminescence at fw = 60% (Fig. 3, right). Compared to SPF-1, a more significant fluorescence enhancement was observed for SPF-2 when the water content was increased from 40% to 50% in volume. This result can presumably be attributed to the comparatively lower solubility of SPF-2 in the aqueous mixture. Thus, it can be confirmed that SPF-1 and SPF-2 were endowed with AIEE attributes.27
3.3 Excited-state intramolecular proton transfer characteristics of SPF
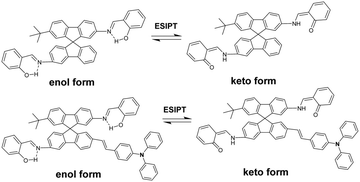
The process of excited-state intramolecular proton transfer (ESIPT) consists of proton transfer between an enol (E*) and a keto form (K*) upon photoexcitation (Scheme 2).28–31 In general, an ESIPT-based luminophore shows dual emission bands: the normal emission from the enol-form (high energy, low Stokes shift) and the ESIPT emission from the keto-form (low energy, large Stokes shift).30,32,33 AIE mechanisms involving ESIPT have been reported in the literature.30,32 In the aggregate state, the keto emission used to be the preferred emission owing to strong intramolecular hydrogen bonding and other favorable parameters.32,34,35 In the DMF/H2O mixture (Fig. 2, left), SPF-1 showed dual weak emissions at a lower fraction of water (0–40%), in which the shorter-wavelength emission occurred at 425 nm and the longer-wavelength emission occurred at 528 nm (excitation at 362 nm). As the ratio of water increased from 50% to 100%, the emission at 528 nm becomes the more prominent emission and is associated with the red-shift to 538 nm. The red shift of the emission band could be attributed to the result of aggregation-induced charge-transfer enhancement.36–38 A similar trend was observed for compound SPF-2 (Fig. 3, left). It showed weak fluorescence at 460 nm (enol emission) and 530 nm (keto emission) in a 1,4-dioxane/water mixture with water fractions ranging from 0 to 40 vol%. Upon increasing the amount of water to more than 40%, the fluorescence intensity of the shorter-wavelength emission (460 nm) disappeared completely, while that of the longer-wavelength emission (530 nm) increased significantly with a red shift from 530 to 542 nm.To gain a better understanding of the ESIPT phenomena of SPF-1 and SPF-2, a theoretical calculation based on density functional theory (DFT) and time-dependent density functional theory (TDDFT) methods was carried out using the Gaussian 16 program. The geometry optimizations of the S0 and S1 states were performed with the B3LYP hybrid DFT and the basis set used was 6-31G*. DMF was employed as solvent. Fig. 4 displays the highest occupied molecular orbital (HOMO) and the lowest unoccupied molecular orbital (LUMO) diagrams for the two compounds, and the calculated HOMO and LUMO energies are correspondingly listed. It is noteworthy that for SPF-1 and SPF-2, the K* form is more stable than the E* form by more than 0.32 eV.39 Therefore, the E* → K* transformation could occur through a barrier-less path owing to the lack of energy barrier in the S1 excited state.40 After decaying to the ground state, a reverse proton transfer process from the keto to the enol takes place to produce the original E form. For SPF-2, the occurrence of the reverse proton transfer process is not as easy because of the existence of the 0.4 kcal mol−1 (0.02 eV) energy barrier.40 This result implied that the ESIPT process was feasible in the SPF-1 and SPF-2 molecules.
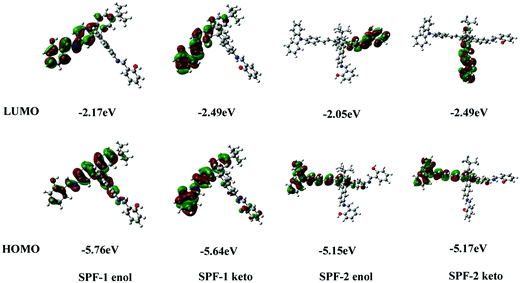 | ||
| Fig. 4 The calculated frontier molecular orbitals for the HOMO and LUMO and the orbital energies of SPF-1 and SPF-2 in DMF. | ||
Moreover, the fluorescence properties of SPF-1 and SPF-2 in the enol and keto forms in DMF were simulated. The obtained fluorescence peaks of SPF-1-enol and SPF-1-keto are 404.4 and 522.72 nm, which is in excellent agreement with the experimental data of 425 and 528 nm (see Fig. 2, left). In the calculated fluorescence peaks of SPF-2, the emission bands 521.24 and 600.73 nm correspond to the enol and keto forms of SPF-2, respectively.41 However, only a single emission band at 495 nm was observed in the experimental data. The average absolute deviation between the theoretical (521.24 nm) and experimental (495) wavelengths was found to be 26.24 nm. The longer-wavelength emission band of SPF-2 (>495 nm) disappeared in DMF, which may be caused by the presence of intermolecular hydrogen bonding between the SPF-2 and DMF molecules. The enol isomer of SPF-2 is better stabilized by DMF molecules than the keto isomer and the ESIPT process is not possible.40
The time-resolved fluorescence decay behaviors of SPF-1 (in DMSO/water solution, 9![[thin space (1/6-em)]](https://www.rsc.org/images/entities/char_2009.gif) :
:![[thin space (1/6-em)]](https://www.rsc.org/images/entities/char_2009.gif) 1, v/v) and SPF-2 (in 1,4-dioxane/water solution, 13
1, v/v) and SPF-2 (in 1,4-dioxane/water solution, 13![[thin space (1/6-em)]](https://www.rsc.org/images/entities/char_2009.gif) :
:![[thin space (1/6-em)]](https://www.rsc.org/images/entities/char_2009.gif) 7, v/v) were investigated (Fig. S2 and S3, ESI†). Two relaxation pathways are involved in the decay process. The quick decay lifetimes are 3.63 and 0.82 ns, respectively, while the long decay lifetimes are 37.30 and 2.75 ns, respectively.30 Therefore the ESIPT emission of SPF-1 and SPF-2 was further confirmed.
7, v/v) were investigated (Fig. S2 and S3, ESI†). Two relaxation pathways are involved in the decay process. The quick decay lifetimes are 3.63 and 0.82 ns, respectively, while the long decay lifetimes are 37.30 and 2.75 ns, respectively.30 Therefore the ESIPT emission of SPF-1 and SPF-2 was further confirmed.
3.4 Detection of Zn2+
The corresponding solutions of SPF-1 in DMF/H2O (9![[thin space (1/6-em)]](https://www.rsc.org/images/entities/char_2009.gif) :
:![[thin space (1/6-em)]](https://www.rsc.org/images/entities/char_2009.gif) 1, v/v, 10 μM) and SPF-2 in 1,4-dioxane/water (13
1, v/v, 10 μM) and SPF-2 in 1,4-dioxane/water (13![[thin space (1/6-em)]](https://www.rsc.org/images/entities/char_2009.gif) :
:![[thin space (1/6-em)]](https://www.rsc.org/images/entities/char_2009.gif) 7, v/v, 10 μM) were prepared, respectively, in which the water volume percentage was less than 40% and the probe did not exhibit AIEE activity on its own.9
7, v/v, 10 μM) were prepared, respectively, in which the water volume percentage was less than 40% and the probe did not exhibit AIEE activity on its own.9
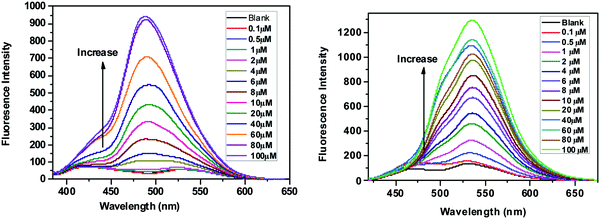
As depicted in Fig. 5, the SPF solutions show very weak fluorescence in the absence of Zn2+.42 Upon addition of Zn2+, the fluorescence started to increase gradually. Fig. 5 shows the variation of the fluorescence intensity (at 488 nm for SPF-1, and at 536 nm for SPF-2) versus the amount of Zn2+ added to the solution. The increase in the fluorescence intensity was directly proportional to the Zn2+ concentration from 0.5 to 20 μM with a linear coefficient of 0.996 for SPF-1 (Fig. S4, left, ESI†) and from 0 M to 4 μM with a linear coefficient of 0.991 for SPF-2 (Fig. S4, right, ESI†), respectively. Thus, compounds SPF-1 and SPF-2 can be regarded as new off–on fluorescence sensors for Zn2+. The detection limits (LOD) were found to be 300 nM for SPF-1 and 63 nM for SPF-2, respectively. The LOD of SPF-2 for Zn2+ was significantly lower than most of the previously reported systems.5,9,43–49
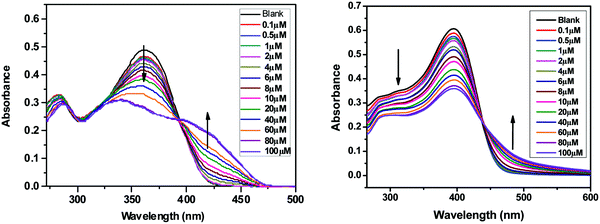
The absorption spectra of SPF-1 and SPF-2 were also recorded after the addition of Zn2+. As depicted in Fig. 6 (left), the absorptions around 362 nm of SPF-1 decreased and red-shifted gradually with an increase of the Zn2+ concentration, generating an isobestic point (at around 394 nm) simultaneously. Similar changes in the UV-vis spectra of SPF-2 were observed and an isosbestic point appeared at around 436 nm (Fig. 6, right). These spectral changes could be attributed to the coordination of SPF toward Zn2+.43
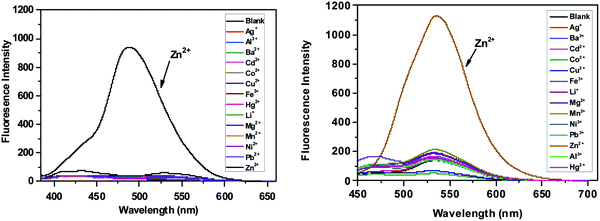
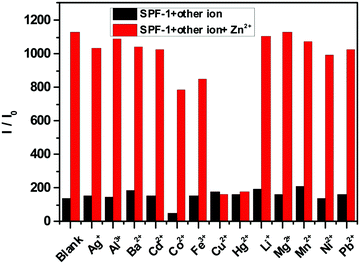
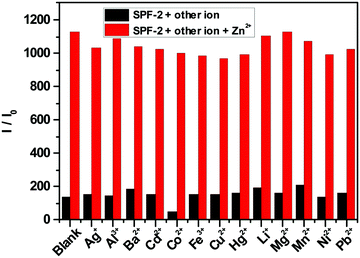
The selectivity of SPF toward Zn2+ was checked against other common cations (Ag+, Al3+, Ba2+, Cd2+, Co2+, Fe3+, Cu2+, Hg2+, Li+, Mg2+, Mn2+, Ni2+ and Pb2+). The free SPF showed a weak fluorescence emission (Fig. 7). Upon the addition of various metal ions to the solution of SPF, the fluorescence emission of SPF exhibited negligible changes. However, Zn2+ caused a significant fluorescent enhancement either in the presence (Fig. 8 and 9) or absence (Fig. 7) of competitive ions such as Ag+, Al3+, Ba2+, Cd2+, Co2+, Fe3+, Li+, Mg2+, Mn2+, Ni2+ and Pb2+. An obvious color change induced by Zn2+ can be observed under 365 nm UV irradiation (Fig. S5 and S6, ESI†). As depicted in Fig. 8, Cu2+ and Hg2+ exert interference on the fluorescence detection of Zn2+ with probe SPF-1. The coexistence of the Cu2+ and Hg2+ ions did not have an obvious impact on the fluorescence intensity of SPF-2 (Fig. 9), revealing that SPF-2 is highly selective for Zn2+. It is worth mentioning that SPF-1 displayed different absorbance responses for Cu2+, Hg2+ and Zn2+ (Fig. 10). After the addition of Cu2+, SPF-1 showed an obvious color change from colorless to light yellow (Fig. 10, inset). These phenomena can guarantee the high selectivity of the probe SPF-1 for Zn2+ in solution. Additionally, Hg2+ and Cu2+ are present in relatively low concentrations in vivo,42,50 and the interferences from them for the detection of Zn2+ in cells or tissues can be neglected.
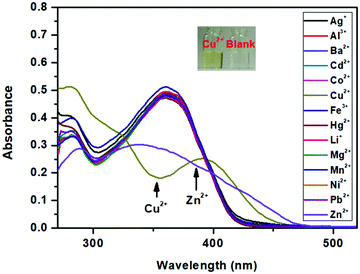 | ||
Fig. 10 The absorption spectra of SPF-1 (10 μM) upon addition of various metal ions (10 μM) in DMF/H2O (9![[thin space (1/6-em)]](https://www.rsc.org/images/entities/char_2009.gif) : :![[thin space (1/6-em)]](https://www.rsc.org/images/entities/char_2009.gif) 1, v/v). 1, v/v). | ||
3.5 Proposed sensing mechanism of SPF toward Zn2+
Up until now, several mechanisms for sensing Zn2+ such as metal–ligand charge transfer (MLCT), chelation enhanced fluorescence (CHEF), photoinduced electron transfer (PET), and C![[double bond, length as m-dash]](https://www.rsc.org/images/entities/char_e001.gif) N isomerization have been reported.9
N isomerization have been reported.9
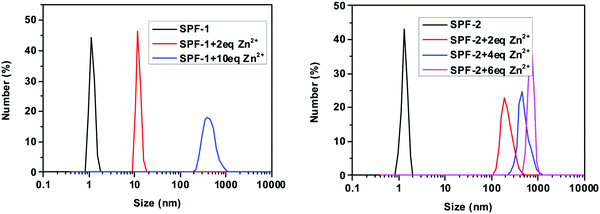
The coordination of SPF with Zn2+ was confirmed by HRMS analysis. The reaction mixture of probe SPF-2 with Zn2+ exhibited a prominent peak at m/z 950.7093 (Fig. S8, ESI†), which is assigned to the species [SPF-2 + 2Zn2+ − C(CH3)3]. As shown in Fig. S7 (ESI†), the molecular ion peaks corresponding to [SPF-1 + 2Zn2+ − C(CH3)3 − 2H] at m/z 679.4360, [SPF-1 + 2Zn2+ − 2CH3 + H] at m/z 709.4486, and [SPF-1 + 2Zn2+ − CH3] at m/z 723.4612 could be clearly observed. To expound the reason for the fluorescence light-up, DLS analysis was performed. As depicted in Fig. 11, the intensity-average hydrodynamic diameter, 〈Dh〉, of SPF is approximately 2.0 nm, which is in line with the molecular size. This indicates that SPF-1 can be molecularly dissolved in DMF/water and SPF-2 can be dissolved in a 1,4-dioxane/water mixture, respectively. However, the mean diameter was approximately 12 nm for SPF-1 and 193 nm for SPF-2 upon introduction of 2 equivalents of Zn2+. Increasing the concentration of Zn2+ resulted in a significant enhancement in the average size of the aggregates (Fig. 11) and the fluorescence intensity, which supports the observed Zn2+-triggered AIEE activity of the SPF probe.9,51 The formation of aggregates can also be confirmed by the observation of a long absorption tail (see Fig. 6). On the basis of the experimental results described above, we proposed that the phenomenon caused by the addition of Zn2+ and resulting in the fluorescence enhancement could be attributed to the following reasons: (1) the coordination of SPF with Zn2+ can reduce the solubility of SPF and induce the formation of SPF aggregates; (2) the ESIPT process can be suppressed through a metal ion binding process;52–56 (3) the binding of the nitrogen atom of C![[double bond, length as m-dash]](https://www.rsc.org/images/entities/char_e001.gif) N with Zn2+ restricted C
N with Zn2+ restricted C![[double bond, length as m-dash]](https://www.rsc.org/images/entities/char_e001.gif) N isomerization in the excited states and inhibited the PET process of the C
N isomerization in the excited states and inhibited the PET process of the C![[double bond, length as m-dash]](https://www.rsc.org/images/entities/char_e001.gif) N group within SPF.43
N group within SPF.43
3.6 pH effect
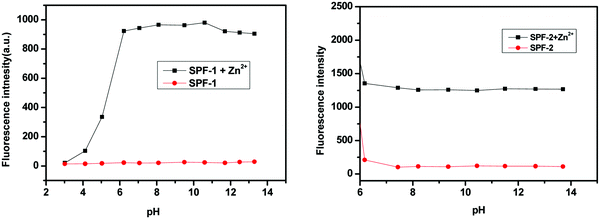
We investigated the effect of pH on the sensing behavior of SPF towards Zn2+. The variation of the fluorescence intensity with different pH values in the absence and presence of Zn2+ are shown in Fig. 12.The fluorescence intensity of pure SPF-1 (at 488 nm) remains almost unchanged in a wide pH range of 3–13. After addition of 1 equivalent of Zn2+, the fluorescence intensity of SPF-1 is enhanced gradually when the pH is increased from 3.0 to 6.1. At pH 6.1, the fluorescence intensity reached a plateau and did not change significantly upon changing the pH values from 6.1 to 10.5. At pH values higher than 10.5, a slight decline in the emission occurred, which could be attributed to the formation of Zn(OH)2.42 In strong acidic solutions (pH < 3.0), the introduction of Zn2+ caused no changes in the fluorescence intensity of SPF-1, which could be attributed to the instability of the C![[double bond, length as m-dash]](https://www.rsc.org/images/entities/char_e001.gif) N bond under low pH value conditions.3
N bond under low pH value conditions.3
In acidic environments (pH < 6.0), the fluorescence of pure SPF-2 (at 535 nm) increased significantly, which could be due to the suppressed PET processes from the protonated triphenylamine unit.6 When the pH increased from 6.1 to 7.4, a slight decline in the emission can be observed. In basic conditions (pH > 7.4), almost no changes in the fluorescence intensity were found. In a pH greater than 6.1, the emission intensity of SPF-2 increased dramatically after addition of 1 equivalent of Zn2+. The pH study shows that SPF could be used to monitor Zn2+ at a wide range of pH values and has the potential for application in conditions with a physiological pH (6.0–9.0).9
3.7 Two-photon absorption properties of SPF-2
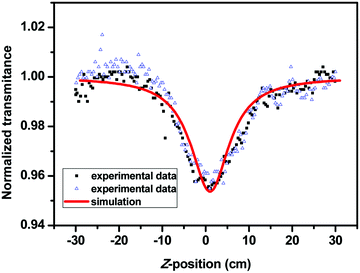
In the structure of SPF-2, the triphenylamine group functions as an electron donor (D), the 2-(iminomethyl)phenol moiety acts as an electron acceptor (A) and the fluorene-vinyl moiety as a conjugation bridge. Therefore, the biphenyl branch containing a triphenylamine group is a donor–π–acceptor (D–π–A) type chromophore and is expected to serve as a source for the two-photon absorption. The TPA cross-section value of SPF-2 was determined using a femtosecond open-aperture Z-scan technique in THF.23 The open Z-scan data are shown in Fig. 13 and the σ of SPF-2 was found to be 200 GM at a wavelength of 800 nm.3.8 Cell imaging studies
The application of SPF-1 for intracellular Zn2+ imaging (one-photon fluorescence) and SPF-2 for two-photon fluorescence cell imaging were demonstrated, respectively. Before this, the cytotoxicities of SPF-1 and SPF-2 were first evaluated using MTT assays. After incubating the A549 cells with 50 μM SPF-1 or SPF-2 for 24 h, the cell viability remained at more than 95%, indicating the low cytotoxicity of the probe.57Almost no intracellular fluorescence was observed for the SPF-1 endocytosed cells. However, an intense green fluorescence was detected after these cells were treated with 100 μM Zn2+ solutions (Fig. 14). The results of this experiment indicated that SPF-1 is potentially applicable for use in intracellular Zn2+ imaging.3
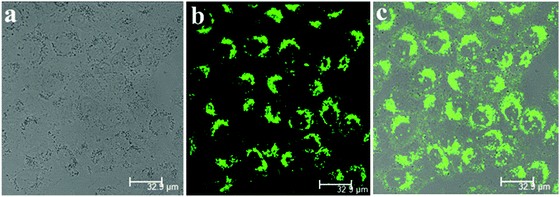
Two-photon excited fluorescence microscopy is a powerful method that is used for three-dimensional imaging in biological systems owing to several distinct advantages, such as an increased penetration depth, lower tissue auto-fluorescence and self-absorption, and so on. The A549 cells treated with SPF-2 (50 μM) show a bright yellow fluorescence using two-photon microscopy (at 800 nm) (Fig. 15). The results proved that SPF-2 is suitable for two-photon fluorescence imaging of cells. As SPF-2 is more hydrophobic than SPF-1, the SPF-2 molecules aggregate more easily in the intracellular environment and emit a strong fluorescence signal.
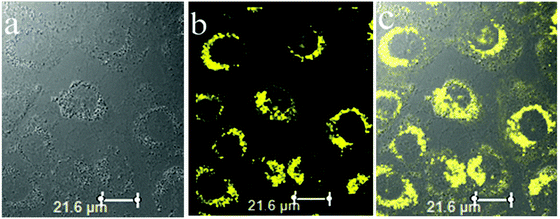 | ||
| Fig. 15 Two-photon fluorescence images (at 800 nm) for A549 cells incubated with SPF-2 (50 μM) for 30 min. (a) Bright field; (b) fluorescence; and (c) overlay images of the A549 cells. | ||
4. Conclusions
In summary, two spirobifluorene-based probes for Zn2+ have been developed by taking advantage of their AIEE features. The sensing mechanism is ascribed to the chelation mediated AIEE behavior of SPF. SPF-1 was successfully used for intracellular Zn2+ imaging and SPF-2 was used for two-photon fluorescence cell imaging. The results demonstrated that spirobifluorene is an ideal building block for AIEE-based bioprobes. We hope that this molecular design triggers further interest in using spiro-configured compounds in AIEE-based bioprobes for further applications.Conflicts of interest
There are no conflicts to declare.Acknowledgements
This work was financially supported by the Ministry of Education of China (PCSIRT_IRT_16R49) and the Shanghai Government (18DZ2254200).Notes and references
- S. H. Jung, K.-Y. Kwon and J. H. Jung, Chem. Commun., 2015, 51, 952 RSC.
- R. K. Pathak, V. K. Hinge, A. Rai, D. Panda and C. P. Rao, Inorg. Chem., 2012, 51, 4994 CrossRef CAS PubMed.
- H. Liu, Y. Dong, B. Zhang, F. Liu, C. Tan, Y. Tan and Y. Jiang, Sens. Actuators, B, 2016, 234, 616 CrossRef.
- M. P. Cuajungco and G. J. Lees, Neurobiol. Dis., 1997, 4, 137 CrossRef CAS PubMed.
- K. Tayade, S. K. Sahoo, B. Bondhopadhyay, V. K. Bhardwaj, N. Singh, A. Basu, R. Bendre and A. Kuwar, Biosens. Bioelectron., 2014, 61, 429 CrossRef CAS PubMed.
- H.-J. Lee, C.-W. Cho, H. Seo, S. Singha, Y. W. Jun, K.-H. Lee, Y. Jung, K.-T. Kim, S. Park, S. C. Baed and K. H. Ahn, Chem. Commun., 2016, 52, 124 RSC.
- R. Hu, J. L. Maldonado, M. Rodriguez, C. Deng, C. K. W. Jim, J. W. Y. Lam, M. M. F. Yuen, G. Ramos-Ortiz and B. Z. Tang, J. Mater. Chem., 2012, 22, 232 RSC.
- R. Liu, M. Shu, J. Hu, S. Zhu, H. Shi and H. Zhu, Dyes Pigm., 2017, 137, 174 CrossRef CAS.
- M. Shyamal, P. Mazumdar, S. Maity, S. Samanta, G. P. Sahoo and A. Misra, ACS Sens., 2016, 1, 739 CrossRef CAS.
- Y. Wang, G. Lai, Z. Li, Y. Ma, Y. Shen and C. Wang, Tetrahedron, 2015, 71, 2761 CrossRef CAS.
- S. Kim, T. Y. Ohulchanskyy, H. E. Pudavar, R. K. Pandey and P. N. Prasad, J. Am. Chem. Soc., 2007, 129, 2669 CrossRef CAS PubMed.
- W. Huang, F. Tang, B. Li, J. Su and H. Tian, J. Mater. Chem. C, 2014, 2, 1141 RSC.
- Q. Ye, S. Chen, D. Zhu, X. Lu and Q. Lu, J. Mater. Chem. B, 2015, 3, 3091 RSC.
- X. Zhang, X. Gan, S. Yao, W. Zhu, J. Yu, Z. Wu, H. Zhou, Y. Tian and J. Wu, RSC Adv., 2016, 6, 60022 RSC.
- J. Li, T. Liu, M. Zheng, M. Sun, D. Zhang, H. Zhang, P. Sun, S. Xue and W. Yang, J. Phys. Chem. C, 2013, 117, 8404 CrossRef CAS.
- Y.-J. Dong, Z. Meng, C.-L. Ho and W.-Y. Wong, Tetrahedron, 2017, 73, 3305 CrossRef CAS.
- L.-Y. Lin, X.-Y. Lin, F. Lin and K.-T. Wong, Org. Lett., 2011, 13, 2216 CrossRef CAS PubMed.
- H. Xiao, Y. Zhang, W. Zhang, S. Li and R. Xu, Sens. Actuators, B, 2016, 233, 469 CrossRef CAS.
- H. Xiao, Y. Zhang, S. Li, W. Zhang, Z. Han, J. Tan, S. Zhang and J. Du, Sens. Actuators, B, 2016, 236, 233 CrossRef CAS.
- Z. Han, J. Tan, T. Wei, Y. Zhang, H. Xiao, L. Xu and B. He, Sens. Actuators, B, 2018, 255, 2290 CrossRef CAS.
- H. Xiao, H. Yin, L. Wang, C. Mei and X. Zhang, Monatsh. Chem., 2012, 143, 683 CrossRef CAS.
- Y.-C. Wang, H. Zhou, J.-L. Ding, Q. Chen, H.-B. Xiao, X.-M. Tao and S.-X. Qian, Chin. Phys. Lett., 2010, 27(3), 038201 CrossRef.
- T. Jiang, Y. Qu, B. Li, Y. Gao and J. Hua, RSC Adv., 2015, 5, 1500 RSC.
- R. S. Yoshii, A. S. Nagai, K. Z. Tanaka and Y. S. K. Chujo, Chem. – Eur. J., 2013, 19, 4506 CrossRef CAS PubMed.
- K. Supattarasakda, K. Petcharoen, T. Permpool, A. Sirivat and W. Lerdwijitjarud, Powder Technol., 2013, 249, 353 CrossRef CAS.
- G. J. Tian, W. Huang, S. Y. Cai, H. T. Zhou, B. Li, Q. C. Wang and J. H. Su, RSC Adv., 2014, 4, 38939 RSC.
- X. Wang, J. Hu, T. Liu, G. Zhang and S. Liu, J. Mater. Chem., 2012, 22, 8622 RSC.
- P. Kaewmati, Y. Yakiyama, H. Ohtsu, M. Kawano, S. Haesuwannakij, S. Higashibayashid and H. Sakurai, Mater. Chem. Front., 2018, 2, 514 RSC.
- J. Massue, D. Jacquemin and G. Ulrich, Chem. Lett., 2018, 47, 1083 CrossRef CAS.
- L. Yan, T. Qing, R. Li, Z. Wang and Z. Qi, RSC Adv., 2016, 6, 63874 RSC.
- Z. A. Kowser, U. Rayhan, S. Rahman, P. E. Georghiou and T. Yamato, Tetrahedron, 2017, 73, 5418 CrossRef CAS.
- Q. Chen, C. Jia, Y. Zhang, W. Du, Y. Wang, Y. Huang, Q. Yang and Q. Zhang, J. Mater. Chem. B, 2017, 5, 7736 RSC.
- J. Jayabharathi, P. Ramanathan, V. Thanikachalam and A. Arunpandiyan, J. Fluoresc., 2014, 24, 827 CrossRef CAS PubMed.
- P. Singh, H. Singh, R. Sharma, G. Bhargava and S. Kumar, J. Mater. Chem. C, 2016, 4, 11180 RSC.
- V. S. Padalkar and S. Seki, Chem. Soc. Rev., 2016, 45, 169 RSC.
- R. Yoshii, A. Hirose, K. Tanaka and Y. Chujo, Chem. – Eur. J., 2014, 20, 8320 CrossRef CAS PubMed.
- X. Wang, Y. Wu, Q. Liu, Z. Li, H. Yan, C. Ji, J. Duan and Z. Liu, Chem. Commun., 2015, 51, 784 RSC.
- Q. Liu, X. Wang, H. Yan, Y. Wu, Z. Li, S. Gong, P. Liu and Z. Liu, J. Mater. Chem. C, 2015, 3, 2953 RSC.
- J. Massuea, A. Felouata, M. Curtila, P. M. Vérité, D. Jacqueminb and G. Ulricha, Dyes Pigm., 2019, 160, 915 CrossRef.
- N. Klinhoma, N. Saengsuwan, S. Sriyab, P. Prompinit, S. Hannongbua and S. Suramitr, Spectrochim. Acta, Part A, 2019, 206, 359 CrossRef PubMed.
- C. Sun, H. Li, H. Yin, Y. Li and Y. Shi, J. Mol. Liq., 2018, 269, 650 CrossRef CAS.
- F. Sun, G. Zhang, D. Zhang, L. Xue and H. Jiang, Org. Lett., 2011, 13, 6378 CrossRef CAS PubMed.
- J.-C. Qin, L. Fan and Z.-Y. Yang, Sens. Actuators, B, 2016, 228, 156 CrossRef CAS.
- M. Hosseini, A. Ghafarloo, M. R. Ganjali, F. Faridbod, P. Norouzi and M. S. Niasari, Sens. Actuators, B, 2014, 198, 411 CrossRef CAS.
- A. K. Mahapatra, S. K. Manna, C. D. Mukhopadhyay and D. Mandal, Sens. Actuators, B, 2014, 200, 123 CrossRef CAS.
- J.-H. Hu, J.-B. Li, J. Qi and Y. Sun, Sens. Actuators, B, 2015, 208, 581 CrossRef CAS.
- Y. R. Li, J. Wu, X. Jin, J. W. Wang, S. Han, W. Y. Wu, J. Xu, W. S. Liu, X. J. Yao and Y. Tang, Dalton Trans., 2014, 43, 1881 RSC.
- K. Wechakorn, K. Suksen, P. Piyachaturawat and P. Kongsaeree, Sens. Actuators, B, 2016, 228, 270 CrossRef CAS.
- E. J. Song, J. Kang, G. R. You, G. J. Park, Y. Kim, S.-J. Kim, C. Kim and R. G. Harrison, Dalton Trans., 2013, 42, 15514 RSC.
- A. P. De Silva, H. Q. N. Gunaratne, T. Gunnlaugsson, A. J. M. Huxley, C. P. McCoy, J. T. Rademacher and T. E. Rice, Chem. Rev., 1997, 97, 1515 CrossRef CAS PubMed.
- Y. Gao, Y. Qu, T. Jing, H. Zhang, N. He, B. Li, J. Wu and J. Hua, J. Mater. Chem. C, 2014, 2, 6353 RSC.
- F. Huo, Q. Wu, J. Kang, Y. Zhang and C. Yin, Sens. Actuators, B, 2018, 262, 263 CrossRef CAS.
- L. Tang, M. Cai, P. Zhou, J. Zhao, K. Zhong, S. Hou and Y. Bian, RSC Adv., 2013, 3, 16802 RSC.
- M. M. Henary, Y. Wu and C. J. Fahrni, Chem. – Eur. J., 2004, 10, 3015 CrossRef CAS PubMed.
- L. Ma, G. Liu, S. Pu, C. Zheng and C. Fan, Tetrahedron, 2017, 73, 1691 CrossRef CAS.
- T. Wei, G. Liang, X. Chen, J. Qi, Q. Lin, Y. Zhang and H. Yao, Tetrahedron, 2017, 73, 2938 CrossRef CAS PubMed.
- Q. Hu, M. Gao, G. Feng, X. Chen and B. Liu, ACS Appl. Mater. Interfaces, 2015, 7, 4875 CrossRef CAS PubMed.
Footnotes |
| † Electronic supplementary information (ESI) available. See DOI: 10.1039/c8tc05526b |
| ‡ These authors made equal contributions to this work. |
| This journal is © The Royal Society of Chemistry 2019 |

