Rapid detection of Shiga toxin type II using lateral flow immunochromatography test strips of colorimetry and fluorimetry†
Tian
Lu
a,
Kai-Di
Zhu
a,
Chao
Huang
b,
Tian
Wen
b,
Yong-Jun
Jiao
b,
Jin
Zhu
c,
Qing
Zhang
 d and
Shou-Nian
Ding
 *a
*a
aJiangsu Province Hi-Tech Key Laboratory for Bio-medical Research, School of Chemistry and Chemical Engineering, Southeast University, Nanjing 211189, China. E-mail: snding@seu.edu.cn
bJiangsu Provincial Center for Disease Prevention and Control, Key Laboratory of Enteric Pathogenic Microbiology, Ministry Health, Institute of Pathogenic Microbiology, Nanjing, Jiangsu Province, P. R. China
cHuadong Medical Institute of Biotechniques, Nanjing 210002, China
dChinese Academy of Inspection and Quarantine, Beijing 100176, China
First published on 29th October 2019
Abstract
Two types of lateral flow immunochromatographic test strips (LFITS) using gold nanoparticles and fluorescent CdTe quantum dots (QDs) as signal labels, respectively, were developed for Shiga toxin type II (STX2) assays. Under optimal conditions, the corresponding visual detection limits were 25 ng mL−1 and 5 ng mL−1, respectively. The test results of gold based LFITS can be recognized directly by the naked eye, whereas the visualized results of CdTe QDs based LFITS can be observed by the aid of a UV lamp. Both assays showed good specificity and stability. The inexpensive LFITS were promising for the rapid clinical detection of STX2.
1. Introduction
Shiga toxin-producing Escherichia coli (STEC) was first discovered in 1982.1 It is a zoonotic pathogen that causes infectious diarrhoea, haemorrhagic enteritis, haemolytic-uremic syndrome, and thrombotic thrombocytopenic purpura and can cause death in severe cases.2–4 In some areas of Jiangsu Province and Shandong Province, between 1999 and 2000, STEC infectious diarrhoea complicated with acute renal failure occurred, causing a significant loss of personnel and property.5,6 In the summer of 2006, STEC infection was caused by the consumption of contaminated spinach, which affected 26 states.7 STEC comprise O antigens and can be divided into O157, O26, and O111 serotypes, and the main pathogenic strain is O157:H7. Shiga toxin (STX) produced by O157:H7 is currently considered to be the most important pathogenic factor.Among the toxins produced by bacteria, STX is one of the strongest toxins, which can cause cell necrosis, tissue lesions, dissolution and death.8 Shiga toxins include two types,9 Shiga toxin type I (STX1) and Shiga toxin type II (STX2), of which STX2 is the main cause of haemolytic uremic syndrome.10 Compared with STX1, the coding order of STX2 varies greatly, so STX2 has many different subtypes, such as STX2v, STX2vhb, STX2e, STX2C and other subtypes.11 STX2 can penetrate intestinal epithelial cells into the blood circulation and bind to its receptor glycerol sphingosine (Gb3), causing damage to organs such as the intestines and central nervous system, especially in kidneys with a high Gb3 receptor content.12 It is easy to cause haemolytic uremic syndrome, and the mortality rate is high. Even if one can survive, it will cause serious sequelae.8
In recent years, STX2 has been researched and tested at home and abroad.13,14 The existing STX2 detection methods are mainly ELISA and PCR.15–17 These detection methods are complicated to operate and require instrument assistance, so developing a simple and accurate method for STX2 detection is urgently necessary. In this case, it is desirable to develop a simple and rapid point-of-care (POC) assay for STX2 detection. Obviously, the most famous method in the POC strategy is the lateral flow immunochromatographic test strip (LFITS) assay, which has the advantages of rapidity, low cost, simplicity and convenience. It relies on capillary force to move the liquid. In the aspect of LFITS, researchers are constantly exploring signal substrates, including up-conversion fluorescence materials,18 magnetic nanoparticles,19–21 latex nanoparticles,22 quantum dots (QDs)23,24 and organic fluorescent dyes.25 Immunochromatography is not only used in the detection of antigens, but also widely concerned with the detection of environmental pollution26,27 and food safety.28,29
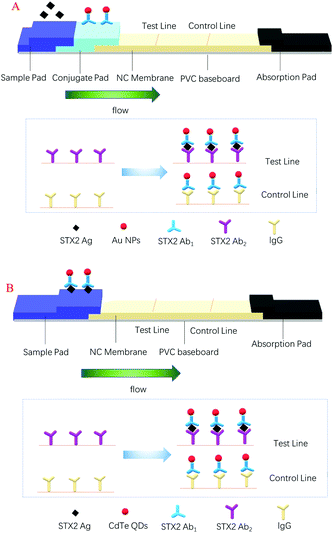
In this paper, two types of chromatographic immunoassay methods are developed by us to detect STX2, and the signal labels were colloidal gold nanoparticles (Au NPs) and CdTe QDs, respectively. The preparation of Au NPs was simple and inexpensive, and they could be stably and uniformly dispersed in an aqueous solution and had good biocompatibility, and more importantly, they could be stored for a long period of time.30 The colour of colloidal gold on the LFITS could be clearly seen with the naked eye. Colloidal gold based LFITS were equipped with many advantages, such as simple to operate, easy to carry, fast detection speed and so on. The principle of the test strip is given in Scheme 1A. Compared with colloidal gold, CdTe QDs have a broad and continuous excitation spectrum, while the emission spectrum was narrow and symmetrical, with long fluorescence lifetime and large Stokes shift,31 and more importantly, the carboxyl groups on the surface of CdTe QDs can bind to antibodies in a better manner, thereby reducing the detection limit of STX2. Due to the fluorescence properties of the CdTe QDs, the results of the CdTe QD based test strips were observed by means of a UV lamp. In addition, under illumination conditions, the fluorescence intensity of CdTe QDs decreased over a period until quenching, which in turn affected the detection results. Therefore, instead of using a conjugate pad, the CdTe QDs were premixed with the antigen and added to the sample pad. The principle of the test strip is shown in Scheme 1B. For the detection of STX2, the chromatographic immunoassay method had strong anti-interference, simple operation and low price. The detection time of Au NP based LFITS was 10 min and the other was 20 min. The satisfactory results indicated that the two methods have promising application prospects in the detection of STX2.
2. Experimental section
2.1. Chemicals and materials
STX2 antigen (Ag), STX2 primary antibody (STX2 Ab1) and STX2 secondary antibody (STX2 Ab2) were provided by the Jiangsu Center for Disease Control and Prevention. Sample pads, conjugate pads (Ahlstrom 8964), NC membranes (Sartorius CN95, Sartorius CN140, Vivid 170), absorbent pads, polyvinyl chloride (PVC) baseboards and goat anti-mouse (IgG) were supplied by Shanghai JieYi Biotechnology Co. Ltd (Shanghai, China). Other chemicals are shown in the ESI.†2.2. Instrumentation and characterization
Transmission electron microscopy (TEM) measurements were carried out by making use of a JEM-2100 transmission electron microscope (JEOL Ltd), UV-vis absorption spectra were recorded by using a Shimadzu UV-2600 spectrophotometer (Tokyo, Japan), and PL spectra were obtained by using a Fluoromax-4 fluorescence spectrometer (Horiba, USA). All photos of LFITS were taken by using a digital camera. The data of STX2 tested by ELISA were provided by the Jiangsu Provincial Center for Disease Control and Prevention.2.3. Synthesis of colloidal Au NPs and CdTe QDs
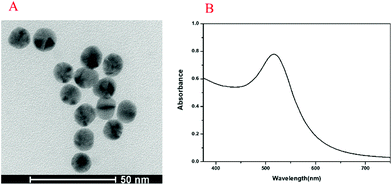
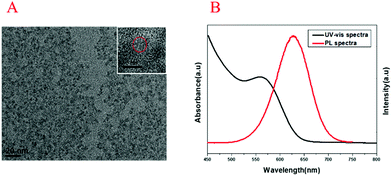
The preparation of Au NPs with a diameter of ∼15 nm (the size of Au NPs was determined by TEM) and the preparation of CdTe QDs with a diameter of ∼5 nm (the size of CdTe QDs was determined by TEM) were carried out according to the reported methods with appropriate modifications.32,33 The detailed synthesis procedures are presented in the ESI.†2.4. Preparation of Au NP coupled STX2 Ab2
According to previous studies,34,35 colloidal gold has the best coupling capacity with antibodies at pH = 8. To adjust the pH to 8, 5 μL of potassium carbonate (K2CO3, 0.1 M) was added to the already prepared 20 μL colloidal gold solution, then 2 μL of 2.4 mg mL−1 STX2 Ab2 was added to the solution and reacted for 30 min. Thereafter, 25 μL of 5% bovine serum albumin (BSA) was added and shaken for 30 min to achieve a blocking effect. The product blocked by BSA was centrifuged at 1500 rpm for 20 min to remove large agglomerates and the supernatant was further centrifuged at 15![[thin space (1/6-em)]](https://www.rsc.org/images/entities/char_2009.gif) 000 rpm for 10 min to remove fine particles, and the obtained precipitate was dispersed to 100 μL with phosphate buffered saline (0.01 M, pH = 7.4, PBS) containing 5% sucrose and 1% BSA. The final product was stored at 4 °C in the dark.
000 rpm for 10 min to remove fine particles, and the obtained precipitate was dispersed to 100 μL with phosphate buffered saline (0.01 M, pH = 7.4, PBS) containing 5% sucrose and 1% BSA. The final product was stored at 4 °C in the dark.
2.5. Preparation of CdTe QD coupled STX2 Ab2
CdTe QD coupled antibodies were prepared through a classical carbodiimide coupling reaction.36 100 μL of 3 mg mL−1 CdTe QD aqueous solution, 25 μL of 10 mg mL−1 freshly prepared 1-(3-dimethylaminopropyl)-3-ethylcarbodiimide hydrochloride (EDC) solution and 100 μL of 2.4 mg ml−1 STX2 Ab2 were sequentially added to a 2 mL centrifuge tube, and shaken in the dark (300 rpm, 3 h). The formed CdTe-STX2 Ab2 was centrifuged at 1000 rpm to remove the agglomerates of the QDs, and the product was centrifuged at 8000 rpm for 5 min to remove CdTe QDs that unbound the antibodies. Purified CdTe-STX Ab2 was incubated with 1 mL of 2% BSA for 30 minutes to block non-specific binding sites. The final products were centrifuged, and the supernatant was stored at 4 °C in the dark.2.6. Preparation of LFITS
Au NP based LFITS consist of five parts, a sample pad (10 × 4 mm), a conjugate pad (8 × 4 mm), an NC film (20 × 4 mm), an absorbent pad (10 × 4 mm) and a PVC substrate. Except for the PVC substrate, the other four sections were attached to the PVC substrate. The Au-STX2 Ab2 complex was dropped onto the conjugate pad and dried at 37 °C for 2 h after the conjugate pad was immersed. STX2 Ab1 and goat anti-mouse (lgG) solutions were separately prepared at a concentration of 2 mg mL−1. The prepared solution was separately extracted using a double-head mark (SJ001, Shenzhen Stationery) having a very small nib (SJ002, 1.97 × 34 mm, Shenzhen Stationery) to prepare the control line and test line on the NC membrane. The NC membrane was treated with PBS containing 1% BSA (0.01 M, pH = 7.4) and dried at 37 °C.Unlike the Au NP based LFITS, CdTe QD based LFITS have no conjugate pad. CdTe QDs were first coupled with STX2 Ab2 to form conjugates, and then the sample was incubated with the conjugate for 10 minutes. Subsequently, the obtained products were dropped onto the sample pad (18 × 4 mm). The treatment of the NC membrane and the preparation of C and T lines were consistent with the above. The prepared LFITS were stored at 4 °C.
2.7. Test procedures
For the colloidal Au NP based LFITS, 50 μL of the sample was directly dropped onto the sample pad, passed through the conjugation pad to the NC membrane, and the excess liquid flowed to the absorption pad. After 10 min, the color of the line of the test strip was visually observed. Since the CdTe QD based LFITS did not have a conjugate pad, 30 μL of the sample and 30 μL of the conjugate were first mixed together for 10 min and then dropped onto the sample pad. After 10 min, the fluorescence of the line on the test strip NC film was observed using an ultraviolet lamp.3. Results and discussion
3.1. Characterization of Au NPs and CdTe QDs
The UV-vis absorption spectrum and transmission electron microscopy (TEM) image of Au NPs are shown in Fig. 1. The maximum ultraviolet absorption peak of Au NPs was located at 517 nm, which was consistent with the literature,37 and the narrow peak shape indicated the uniform distribution of particles (Fig. 1A). The morphology and dispersion of Au NPs were characterized by TEM, and it can be seen that Au NPs were about 15 nm with good dispersion (Fig. 1B). The UV-vis absorption spectra, PL spectra and TEM image of CdTe QDs are shown in Fig. 2. From Fig. 2A, it was found that the maximum ultraviolet absorption peak of CdTe QDs was at 560 nm, and the fluorescence emission peak was at 627 nm, which proved that the as-synthesized CdTe QDs emitted red fluorescence under UV light.38 The narrow emission spectrum demonstrated that the synthesized CdTe QDs possessed a uniform particle size. The morphology and size of CdTe QDs were observed in TEM (Fig. 2B) with an average particle size of 5 nm.3.2. Principle of the method
In this experiment, antigen–antibody interactions were used to form a sandwich type complex for STX2 detection. The procedure for detecting STX2 by Au NP based LFITS was as follows. Firstly, Au NPs were conjugated with STX2 Ab2 to form an Au-STX2 Ab2 complex. Next, the antigen in the sample pad reacted with Au-STX2 Ab2, and then combined with STX2 Ab1 on the T line of the NC membrane. When the concentration of the antigen reached a certain condition, the gold particles would accumulate on the T line and the red colour of the colloidal gold could be observed with the naked eye. The unbound conjugates continued to flow forward by capillary force and bound to the IgG antibody on the C line, turning the C line into red. The binding sequence of CdTe QD based LFITS was identical to that of the Au NP based LFITS. Firstly, the CdTe QDs coupled with the antibody to form CdTe–STX2 Ab2 conjugates, and afterwards the conjugates combined with the antigen of the sample pad to form an immune complex, which was then added to the sample pad. Next, the immune complex combined with antibodies immobilized on the NC membrane. Finally, the fluorescence on the C and T lines can be observed under UV light. Therefore, the LFITS is positive or negative depending on whether there is red on the T line; if red appears on the T line, LFITS is positive, otherwise negative. When there is no red on the C line, the test strip is invalid regardless of whether there is red on the T line (Scheme 2A–C).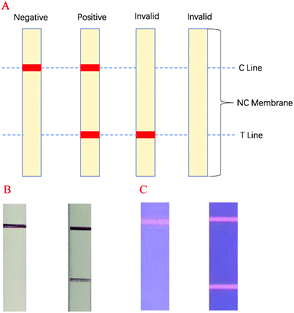 | ||
| Scheme 2 (A) LFITS signal readout mechanism diagram, (B) negative and positive actual performance of Au NP based LFITS, (C) negative and positive actual performance of CdTe QD based LFITS. | ||
3.3. Sensitivity of Au NP based LFITS
The choice of NC membranes greatly influenced the test results of STX2 detection.39,40 Three different types of NC membranes were selected for research, namely Sartorius CN95, Sartorius CN140 and Vivid 170. In general, the fluid flow rates on the three NC membranes are not much different. Fig. 3A shows the results of STX2 detection using Sartorius CN95. The C line of each test strip demonstrated a clear red colour, indicating that the test strip was effective. When the concentration was more than 25 ng mL−1, the red on the T line can be clearly seen, and the colour distribution was also uniform. At a concentration of 10 ng mL−1, the T line showed only very light red colour. At lower concentrations, the red colour of the T line was barely visible to the naked eye. It can be observed from Fig. 3B that the results using Sartorius CN140 were not good. When the concentration reached 200 ng mL−1, a weak red T line was observed, and when the concentration was lower, the colour on the T line could not be observed. When using Sartorius CN140, the colours of the T and C lines were unclear and uneven. When using Vivid 170 to detect STX2, the detection limit was 25 ng mL−1, please see Fig. 3C for details. By comparing the results of three different types of NC membranes, it was found that the minimum detection limit of Au NP based LFITS was 25 ng mL−1, which was approximately the same, while Sartorius CN140 had a higher detection limit. In addition, Sartorius CN95 exhibited a more uniform colour distribution. Therefore, the Sartorius CN95 model NC membrane was selected for further experiments.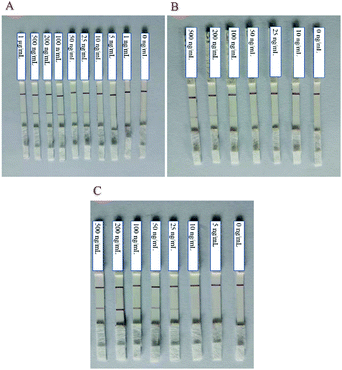 | ||
| Fig. 3 Au NP based LFITS for STX2 sensitivity detection by using different NC membranes: (A) Sartorius CN95, (B) Sartorius CN140, and (C) Vivid 170. | ||
3.4. Stability and specificity of Au NP based LFITS
The specificity was also tested by employing several types of protein as negative controls, including SFTSV, AFP, CEA, CA125, HCG and STX2 with the concentration of 1 μg mL−1. As shown in Fig. 4, all C lines were red, which indicated that Au–STX2 Ab2 coupled with lgG on the C line successfully. However, except for the red line on the T line when STX2 was detected, there was no change in the T line during the detection of other antigen. That is, only in the process of detecting STX2, the antigen was captured by the T line, and other antibodies could not be captured on the T line. Therefore, the designed LFITS were only valid for STX2 detection. These results indicated that our colloidal gold labelled STX2 test paper had very good specificity. Even if the concentration of other antigens is high, it does not affect the results. The above results were repeated multiple times and remained unchanged (Table S-1†), which also proved that the fabricated LFITS had excellent stability.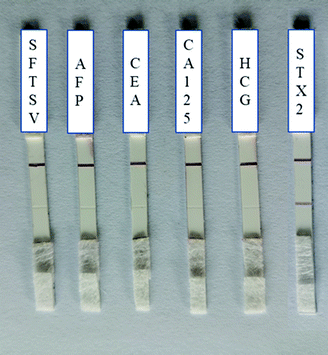 | ||
| Fig. 4 Specificity test of Au NP based LFITS (from left to right: SFTSV, AFP, CEA, CA125, HCG and STX2, the concentrations of antigens were 1 μg mL−1). | ||
3.5. Sensitivity of CdTe QD based LFITS
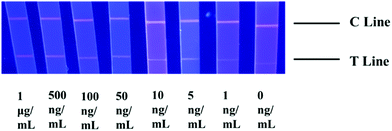
Due to the superiority of Sartorius CN95 in the above experiments of detecting STX2 using Au NP based LFITS, this type of NC film was still applied in the next experiments. The bright red fluorescence on the C line in Fig. 5 proved that all test strips were valid. When the concentration of STX2 Ag was 0 ng mL−1, the T line showed white colour. As the STX2 Ag concentration gradually increased to 5 ng mL−1, a weak red fluorescence on the T line was observed by the naked eye under ultraviolet light, indicating that the sandwich immunological structure of the antigen–antibody on the T line has been formed. On increasing the concentration of STX2 Ag, the red fluorescence on the T line gradually became brighter.3.6. Stability and specificity of CdTe QD based LFITS
Same as the Au NP based LFITS, the stability and specificity of the CdTe QD based LFITS were also investigated. SFTSV, AFP, CEA, CA125, HCG and STX2 were separately detected using CdTe QD based LFITS, and the concentrations of all antigens were 1 μg mL−1. The results are shown in Fig. 6, in addition to the detection of STX2, the T line on the LTITS we designed has red fluorescence, and when detecting other antigens, only the original white fluorescence of antigen on the T line is seen. The results attested that the sandwich immune structure was formed on the T line only when detecting STX2, so the designed CdTe QD based LFITS were only valid for STX2 detection. The sensitivity test of CdTe QD based LFITS was repeated several times (Table S-2†), which also confirmed that CdTe QD based LFITS also had satisfactory stability. | ||
| Fig. 6 Specificity test of CdTe QD based LFITS: from left to right, STX2, HCG, CEA, CA125, SFTSV and AFP, all antibody concentrations were 1 μg mL−1. | ||
3.7. Analysis performance of LFITS
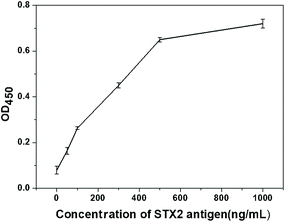
The purpose of the study was to establish a test strip platform using chromatographic immunoassay to quickly and easily detect STX2. Two different lateral flow assay devices proposed in this work can meet these requirements. As can be seen from the above results, the detection limit of Au NP based LFITS for STX was 25 ng mL−1, and the detection limit of CdTe QD based LFITS for STX2 was 5 ng mL−1. STX2 antigen and antibodies in the same batch were also used to perform ELISA experiment, and the obtained detection limit was 20 ng mL−1 (OD450 = 0.1) (Fig. 7). Obviously, the detection limit of these two types of LFITS was comparable with that of the traditional ELISA assay. However, the detection time is greatly shortened, the detection process is simple and convenient, and no instrument assistance is required. Both of these two kinds of LFITS have their own advantages. The CdTe QD based LFITS has a lower detection limit and is more sensitive than the Au NP based LFITS. However, the Au NP based LFITS can be carried around and can be stored for a long time without any instrument. According to the actual situation the appropriate detection method can be selected to detect STX2 under certain conditions. The high sensitivity and high precision of the STX2 detection technology will have broad application prospects in the future.4. Conclusions
To sum up, two different lateral flow assay test strips have been fabricated for the rapid detection of STX2. The colloidal gold gel was used as a signal label for the colorimetric test strip. And CdTe QDs were used as the signal label for the fluorometric test strip. The Au NP based LFITS does not require professionals and any instruments, and is simpler to operate. The CdTe QD based LFITS has higher detection sensitivity, but it requires an ultraviolet lamp and some cumbersome steps. Compared with the traditional ELISA kit, the detection time has been greatly shortened, the cost is low, and the test results are satisfactory. Therefore, the two LFITS provide an alternative to detect STX2, especially in some remote areas, or under some urgent conditions.Conflicts of interest
There are no conflicts to declare.Acknowledgements
This work was supported by the National Natural Science Foundation of China (21535003, 21575022), the National Key Research and Development Program of China (2017YFA0700404), the Key Research & Development Plan of Jiangsu Province (BE2018617), the Qing Lan Project and the Key Laboratory of Optic-electric Sensing and Analytical Chemistry for Life Science, MOE, Qingdao University of Science and Technology (STAM201801).Notes and references
- S. Scotter, M. Aldridge and K. Capps, Food Control, 2000, 11, 85–95 CrossRef.
- D. Karpman, S. Loos, R. Tati and I. Arvidsson, J. Intern. Med., 2017, 281, 123–148 CrossRef PubMed.
- J. G. Mainil and G. Daube, J. Appl. Microbiol., 2005, 98, 1332–1344 CrossRef CAS PubMed.
- A. V. Page and W. C. Liles, Med. Clin. North Am., 2013, 97, 681–695 CrossRef.
- T. Koitabashi, S. Cui, M. Kamruzzaman and M. Nishibuchi, J. Food Prot., 2008, 71, 706–713 CrossRef CAS.
- H. Ding, L. Huang, X. Mao and Q. Zou, Afr. J. Biotechnol., 2011, 15, 2991–2998 Search PubMed.
- S. V. Sodha, M. Lynch, K. Wannemuehler, M. Leeper, M. Malavet, J. Schaffzin, T. Chen, A. Langer, M. Glenshaw, D. Hoefer, N. Dumas, L. Lind, M. Iwamoto, T. Ayers, T. Nguyen, M. Biggerstaff, C. Olson, A. Sheth and C. Braden, Epidemiol. Infect., 2011, 139, 309–316 CrossRef CAS.
- P. I. Tarr, C. A. Gordon and W. L. Chandler, Lancet, 2005, 365, 1073–1086 CAS.
- Y. Tahamtan, M. Hayati and M. Namavari, Iran. J. Microbiol., 2010, 2, 8–13 CAS.
- M. Brigotti, D. Carnicelli, E. Ravanelli, S. Barbieri, F. Ricci, A. Bontadini, A. E. Tozzi, G. Scavia, A. Caprioli and P. L. Tazzari, J. Leukocyte Biol., 2008, 84, 1019–1027 CrossRef CAS PubMed.
- P. Boerlin, Cell. Mol. Life Sci., 1999, 56, 735–741 CrossRef CAS PubMed.
- H. Ling, A. Boodhoo, B. Hazes, M. D. Cummings, G. D. Armstrong, J. L. Brunton and R. J. Read, Biochemistry, 1998, 37, 1777–1788 CrossRef CAS.
- J. Gu, Y. Liu, S. Yu, H. Wang, Q. Wang, Y. Yi, F. Zhu, X.-J. Yu, Q. Zou and X. Mao, Microbes Infect., 2009, 11, 835–841 CrossRef CAS.
- M. E. Fraser, M. Fujinaga, M. M. Cherney, A. R. Melton-Celsa, E. M. Twiddy, A. D. O'Brien and M. N. James, J. Biol. Chem., 2004, 279, 27511–27517 CrossRef CAS.
- T. Wen, C. Huang, Y. Zhang, X. Zeng, W. Liu, Z. Jiao, X. Guo and Y. Jiao, Luminescence, 2018, 33, 574–581 CrossRef CAS PubMed.
- K. J. Yoshitomi, K. C. Jinneman and S. D. Weagant, Mol. Cell. Probes, 2006, 20, 31–41 CrossRef CAS PubMed.
- K. C. Jinneman, K. J. Yoshitomi and S. D. Weagant, Appl. Environ. Microbiol., 2003, 69, 6327 CrossRef CAS.
- C. Huang, Q. Wei, Q. Hu, T. Wen, L. Xue, S. Li, X. Zeng, F. Shi, Y. Jiao and L. Zhou, Luminescence, 2019, 34, 162–167 CrossRef CAS.
- H. Gu, K. Xu, C. Xu and B. Xu, Chem. Commun., 2006, 941–949 RSC.
- J. M. Perez, F. J. Simeone, Y. Saeki, L. Josephson and R. Weissleder, J. Am. Chem. Soc., 2003, 125, 10192–10193 CrossRef CAS PubMed.
- A. Ito, M. Shinkai, H. Honda and T. Kobayashi, J. Biosci. Bioeng., 2005, 100, 1–11 CrossRef CAS.
- S. Pinijsuwan, P. Rijiravanich, M. Somasundrum and W. Surareungchai, Anal. Chem., 2008, 80, 6779–6784 CrossRef CAS PubMed.
- L. Yang and Y. Li, Analyst, 2006, 131, 394–401 RSC.
- C.-Y. Zhang, H.-C. Yeh, M. T. Kuroki and T.-H. Wang, Nat. Mater., 2005, 4, 826–831 CrossRef CAS PubMed.
- N. Khreich, P. Lamourette, H. Boutal, K. Devilliers, C. Créminon and H. Volland, Anal. Biochem., 2008, 377, 182–188 CrossRef CAS PubMed.
- C. Xing, L. Liu, S. Song, M. Feng, H. Kuang and C. Xu, Biosens. Bioelectron., 2015, 66, 445–453 CrossRef CAS.
- Y. Tang, Y.-F. Zhai, J.-J. Xiang, H. Wang, B. Liu and C.-W. Guo, Environ. Pollut., 2010, 158, 2074–2077 CrossRef CAS.
- B. B. Dzantiev, N. A. Byzova, A. E. Urusov and A. V. Zherdev, TrAC, Trends Anal. Chem., 2014, 55, 81–93 CrossRef CAS.
- S. Xiulan, Z. Xiaolian, T. Jian, G. Xiaohong, Z. Jun and F. S. Chu, Food Control, 2006, 17, 256–262 CrossRef.
- X. Gong, J. Cai, B. Zhang, Q. Zhao, J. Piao, W. Peng, W. Gao, D. Zhou, M. Zhao and J. Chang, J. Mater. Chem. B, 2017, 5, 5079–5091 RSC.
- S. F. Wuister, I. Swart, F. van Driel, S. G. Hickey and C. de Mello Donegá, Nano Lett., 2003, 3, 503–507 CrossRef CAS.
- D. Zhang, P. Li, Q. Zhang and W. Zhang, Biosens. Bioelectron., 2011, 26, 2877–2882 CrossRef CAS.
- L. Zou, Z. Gu, N. Zhang, Y. Zhang, Z. Fang, W. Zhu and X. Zhong, J. Mater. Chem., 2008, 18, 2807–2815 RSC.
- J. Y. Zuo, Y. J. Jiao, J. Zhu and S. N. Ding, ACS Omega, 2018, 3, 15399–15406 CrossRef CAS.
- G. F. Paciotti, L. Myer, D. Weinreich, D. Goia, N. Pavel, R. E. McLaughlin and L. Tamarkin, Drug Delivery, 2004, 11, 169–183 CrossRef CAS.
- Y.-T. Zhu, X.-Y. Ren, Y.-M. Liu, Y. Wei, L.-S. Qing and X. Liao, Mater. Sci. Eng., C, 2014, 38, 278–285 CrossRef CAS PubMed.
- Y. Chen, B. Zhu, M. Yao, S. Wang and S. Zhang, Catal. Commun., 2010, 11, 1003–1007 CrossRef CAS.
- V. Veeramani, Z. Bao, M.-H. Chan, H.-C. Wang, A. Jena, H. Chang, S.-F. Hu and R.-S. Liu, J. Solid State Chem., 2019, 270, 71–84 CrossRef CAS.
- W. Zhou, W. Kong, X. Dou, M. Zhao, Z. Ouyang and M. Yang, J. Chromatogr. B: Anal. Technol. Biomed. Life Sci., 2016, 1022, 102–108 CrossRef CAS.
- C. Zhu, G. Zhang, Y. Huang, S. Yang, S. Ren, Z. Gao and A. Chen, J. Hazard. Mater., 2018, 344, 249–257 CrossRef CAS.
Footnote |
| † Electronic supplementary information (ESI) available. See DOI: 10.1039/c9an01996k |
| This journal is © The Royal Society of Chemistry 2020 |

