 Open Access Article
Creative Commons Attribution 3.0 Unported Licence
Combination of bioresponsive chelates and perfluorinated lipid nanoparticles enables in vivo MRI probe quantification†
Giuseppe
Gambino
 ,
Tanja
Gambino
 and
Goran
Angelovski
 *
*
MR Neuroimaging Agents, MPI for Biological Cybernetics, Tuebingen, Germany. E-mail: goran.angelovski@tuebingen.mpg.de
First published on 15th July 2020
Abstract
We developed a nanosized perfluorocarbon-based system with incorporated paramagnetic Gd(III) chelates, able to generate a quantitative 19F MRI signal, while in parallel capable of modulating the 1H MRI signal in response to the coordination of Ca2+ ions. Subsequently, we performed experiments in vivo and estimated the concentration of the applied probe in the tissue by means of 19F MRI.
Interest towards the development of new and more powerful methods to perform molecular imaging has been growing significantly in recent years.1,2 Among the instruments at our disposal, MRI certainly occupies a place of relevance, thanks to its high spatial resolution and limitless tissue penetration. Furthermore, the impressive advances that have been made in the development of MRI contrast agents (CAs)3 have significantly increased the potential of this wide-spread methodology for research and diagnostic applications. Of particular relevance are the improvements made in the field of responsive, or so-called “smart” CAs. Such compounds are able to modulate their signal-enhancement efficacy in response to changes in the physical–chemical properties of their environment.4 Furthermore, designing the appropriate molecular structure for the CA, it is possible to cause variations on the resulting r1 or r2, as a response to specific biological markers.
Among the possible targets for molecular imaging, endogenous metal ions hold a place of utmost interest. There has been highly promising progress made in the development of MRI CAs for the monitoring of dynamic fluctuations in the concentration of ions such as Ca(II) and Zn(II) in vivo.5–7 These ions are biomarkers involved in several biological mechanisms including neural activity, which is of particular importance.8 Hence, the capability to measure their concentration or changes in concentration in vivo in a non-invasive fashion would represent an extremely powerful investigative and diagnostic tool. Unfortunately, the in vivo application of responsive 1H MRI CAs presents certain issues, such as a non-homogeneous background signal of the tissue or the inability to quantify the local concentration of the probe, both of which are fundamental in order to quantitatively assess the biomarker of interest.9 Recently, 19F responsive MRI CAs have attracted considerable interest thanks to their “hot-spot” features such as the lack of background signal, 100% isotopic abundance and an NMR sensitivity comparable to protons.10 However, 19F MRI experiments require longer acquisition times when compared to 1H MRI, making the determination of fast and dynamic changes in biomarker concentration a significant challenge. Therefore, the high number of 19F nuclei in perfluorocarbon (PFC) emulsions, increased their popularity as 19F MRI agents.
Thanks to their biochemical inertness and high density of fluorine nuclei, PFCs have been successfully used for cell labelling and quantitative tracking in vivo.11–13 In attempts to improve the performances of PFC-based CAs, nanosized systems have been designed, combining PFC cores and paramagnetic ions such as Gd(III) and Fe(III).14–16 In such systems, the paramagnetic relaxation enhancement (PRE) effect of the paramagnetic ions does not result in a responsive behaviour for the probe, but usually decreases the relaxation times of the 19F nuclei, allowing for faster acquisitions. Furthermore, nanoparticles have proved as an advantageous tool in the design of nanosized responsive platforms for molecular imaging application.17 Moreover, for some of these systems highly promising results have been recently reported for the in vitro and in vivo determination of Ca(II) concentration with 1H MRI methodologies.17,18 Such macromolecular structures hold great potential for molecular functional MRI (fMRI) neuroimaging applications. This is a new methodology that would, in a single technique, be able to merge the whole-brain coverage of conventional fMRI based on the blood oxygen level dependent (BOLD) signal, with a direct Ca(II) signaling measurement, which is currently achieved in combination with optical imaging19 or electrophysiology.20
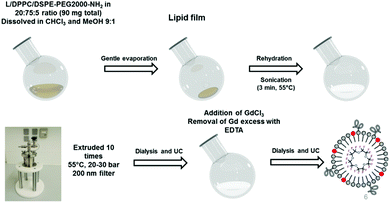
Here we report a promising dual 1H/19F MRI probe, prepared through a mild-pressure extrusion process from a perfluoro-15-crown-5-ether (PFCE) core and a lipid surface appended with the Ca(II)-responsive CA GdL (Fig. 1). This nanoprobe combines the responsiveness of 1H smart CAs with the quantitative signal of PFCs in 19F MRI. The nanoparticles GdPFLNPs were designed in a step-wise fashion from its components, the PFC core, PEGylated phospolipid surface and the calcium-responsive Gd-chelates. The choice of a PFC-based system as the nanocarrier is due to the necessity of achieving a high 19F MRI SNR/[Gd(III)] ratio. In particular, PFCE was the 19F molecule of choice, due to its high number of spectroscopically equivalent fluorine nuclei (20 F) per molecule. Dipalmitoylphosphatidylcholine (DPPC) was used as a surfactant with 5% of PEGylated phospolipid 1,2-distearoyl-sn-glycero-3-phosphoethanolamine-N-[amino(polyethylene glycol)-2000] (DSPE-PEG2000-amine), in order to increase the stability of the emulsion and its dispersion in solution.21 The Gd(III) complexes were included in the nanoparticle surface (20%). The distance between the fluorinated core and the Gd(III) complexes allows for a high 19F MRI signal due to; (i) the high fluorine concentration in the core of the nanoparticle, and (ii) the PRE effect that the Gd(III)-bearing complexes on the surface of the lipid membrane cause on the core of the nanoparticle.14
We synthesized the Ca(II)-chelating ligand L by alkylation of the previously reported amino-precursor 122 (Scheme S1, details in ESI†) to serve as the amphiphilic Gd(III) chelate unit for incorporation in the GdPFLNPs. The hydrolysis of the t-butyl esters yielded the amphiphilic ligand L. The preparation of GdPFLNPs was performed using the thin-film rehydration method, followed by extrusion. We note that, to the best of our knowledge, this is the first reported example of PFLNPs prepared by mild-pressure extrusion.21 After dialysis, Gd(III) was incorporated in the PFLNPs to provide GdPFLNPs bearing Gd(III) only on the outer surface of the particle.23
The size and shape of the GdPFLNPs were determined by cryogenic transmission electron microscopy (cryo-TEM) (Fig. S3a and b in ESI†). The cryogenic conditions of the acquisition were necessary to prevent particle destruction during the measurement. The obtained images, acquired for samples in the presence and absence of Ca(II) revealed particles of spherical shape and an electron-rich core (Fig. S2a and b in ESI†). This is due to the high concentration of PFCE, which is in agreement with what has been previously reported for similar systems.14
The size distribution of the suspension was determined by dynamic light scattering (DLS) (Fig. S2c and d in ESI†). This showed two main populations of nanoparticles at 42.0 ± 10.2 nm and 210.1 ± 83.4 nm in diameter (PDI 0.54) in the absence of Ca(II), while sizes of 40.5 ± 12.9 nm and 152.2 ± 56.1 nm (PDI 0.27) were observed after the addition of 2 equivalents of Ca(II). No major effect on the shape of the particles seemed to occur upon the interaction of the GdPFLNPs with Ca(II) ions. However, the DLS results seem to indicate a slight variation in the size of the nanoparticles in presence of Ca(II), the relevance of which is to be evaluated taking into consideration the high polydispersity of the samples particle size. Furthermore, such variation was not observed in the cryo-TEM images, which show no significant difference between the two samples in terms of the particle size.
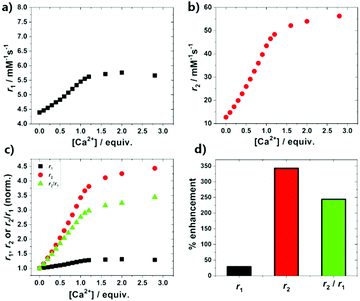
The performance of the GdPFLNPs as a Ca(II)-responsive CA was investigated according to the PRE method.24 In particular, r1 and r2 relaxivities for a millimolar solution of GdPFLNPs were measured in an NMR spectrometer at 7 T and 25 °C upon the stepwise addition of Ca(II) ions. The capability of DO3A-based complexes functionalized with EGTA-derived moieties to undergo a change in relaxivity as a consequence of the binding of Ca(II) ions is well known.17 This behavior was confirmed by the results obtained for the Ca(II) titrations performed with GdPFLNPs (Fig. 2). The titration profiles suggest a strong 1![[thin space (1/6-em)]](https://www.rsc.org/images/entities/char_2009.gif) :
:![[thin space (1/6-em)]](https://www.rsc.org/images/entities/char_2009.gif) 1 interaction between the CA and Ca(II) ions. The responsive CA undergoes a moderate +30% increase in r1 from 4.39 mM−1 s−1 to 5.66 mM−1 s−1, while it displays an unprecedented +343% in r2 from 12.7 mM−1 s−1 to 56.3 mM−1 s−1 upon saturation with Ca(II). Both r1 and r2 values observed at 7 T for GdPFLNPs in absence of Ca(II) ions are rather high for small-size complexes or even nanosized CAs (<10 nm) of this type.17 The explanation for this observation can be found in the considerably larger size of the GdPFLNPs. The reason for such extraordinary changes is to be attributed to the size of GdPFLNPs, which is larger than most of the reported nanosized responsive probes for MRI.17,18,23 Additionally, the coordination of Ca(II) by the EGTA-derived moiety of GdL induces a higher rigidity of the part of the molecule connecting the paramagnetic ion to the nanosized body of the particles,23 thus causing a further enhancement in relaxivity due to the restricted local motion of GdL.25 Furthermore, the major difference in the behavior of r1 and r2 results in a remarkable enhancement of the r2/r1 ratio with increasing [Ca(II)], suggesting GdPFLNPs has a high potential to be used as a contrast agent for T2/T1-weighted, in addition to standard T1- and T2-weighted MRI.
1 interaction between the CA and Ca(II) ions. The responsive CA undergoes a moderate +30% increase in r1 from 4.39 mM−1 s−1 to 5.66 mM−1 s−1, while it displays an unprecedented +343% in r2 from 12.7 mM−1 s−1 to 56.3 mM−1 s−1 upon saturation with Ca(II). Both r1 and r2 values observed at 7 T for GdPFLNPs in absence of Ca(II) ions are rather high for small-size complexes or even nanosized CAs (<10 nm) of this type.17 The explanation for this observation can be found in the considerably larger size of the GdPFLNPs. The reason for such extraordinary changes is to be attributed to the size of GdPFLNPs, which is larger than most of the reported nanosized responsive probes for MRI.17,18,23 Additionally, the coordination of Ca(II) by the EGTA-derived moiety of GdL induces a higher rigidity of the part of the molecule connecting the paramagnetic ion to the nanosized body of the particles,23 thus causing a further enhancement in relaxivity due to the restricted local motion of GdL.25 Furthermore, the major difference in the behavior of r1 and r2 results in a remarkable enhancement of the r2/r1 ratio with increasing [Ca(II)], suggesting GdPFLNPs has a high potential to be used as a contrast agent for T2/T1-weighted, in addition to standard T1- and T2-weighted MRI.
As PFCE bears 20 chemically identical fluorine nuclei, it produces a single and sharp 19F NMR signal at −72 ppm. The relaxation rates of the fluorine signal (R1) were measured at 7 T and 25 °C, providing a value of 1.06 s−1 in the absence and 1.02 s−1 in the presence of Ca(II). These values are consistent with those previously reported in the literature for PFCE lipid nanoparticles decorated with Gd(III) complexes on the lipid membrane.14 In such systems, the distance between the paramagnetic ions and the fluorine nuclei is in the appropriate range to take advantage of the PRE effect of Gd(III), increasing the 19F R1, without causing an excessive broadening of the 19F NMR signal due to the T2 effect. The absence of a significant effect on the 19F R1 due the coordination of Ca(II) ions can be explained by the unaltered distance between the Gd(III) ions and the particle's core. This is in agreement with the absence of a substantial change in the particles structure and size observed by DLS and cryo-TEM.
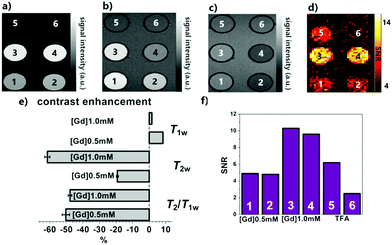
The [19F]/[Gd(III)] ratio has been estimated by linear regression, resulting in [19F]/[Gd(III)] ∼ 550 (see ESI† for details). The affirmative 1H and 19F NMR features of GdPFLNPs were further investigated for their potential in molecular imaging applications. In order to do so, we performed a series of 1H and 19F MRI experiments on tube phantoms in a 7 T MRI scanner. A set of four samples were prepared containing GdPFLNPs at two different concentrations ([Gd(III)] = 1.0 and 0.5 mM), in the presence and absence of Ca(II). Additionally, two tubes containing sodium trifluoroacetate (TFA) at two different concentrations ([TFA] = 100 and 16 mM) were included in the set as a 19F signal reference. Subsequently, a series of T1-, T2- and T2/T1-weighted 1H (Fig. 4a–c) or T1-weighted 19F (Fig. 4d) MRI scans were acquired. The SNR values for each sample were then calculated and compared (Fig. 3e and f).
 | ||
| Fig. 3 1H and 19F MRI tube phantom experiments performed at 7 T and 25 °C on GdPFLNPs (samples 1–4) and TFA (samples 5 and 6). Sample numbering: 1: [Gd(III)] = 0.5 mM; 2: [Gd(III)] = 0.5 mM + 1.0 mM Ca2+; 3: [Gd(III)] = 1.0 mM; 4: [Gd(III)] = 1.0 mM + 2.0 mM Ca(II); 5: [TFA] = 100 mM, 6: [TFA] = 16 mM. All samples are in isotonic NaCl (150 mM), HEPES buffer at pH 7.4; (a) T1-, (b) T2- and (c) T2/T1-1H MRI images; (d) T1-weighted 19F MRI image; (e) comparison of the contrast enhancement obtained with the three 1H MRI protocols: SNR values of the samples with Ca(II) were compared with the corresponding calcium-free ones (details in ESI†); (d) SNR values calculated for samples 1–6 from the 19F T1-weighted MRI image. | ||
Consistent with the results of the relaxometric NMR titrations with calcium, the most pronounced contrast enhancement effect observed upon Ca2+ coordination occurs for the T2- and T2/T1-weighted images, while the measured effect is weaker, but still noticeable, in the T1-weighted 1H MRI images. Most interestingly, while both the T1- and T2-weighted contrast enhancement effects are clearly correlated to the concentration of the contrast agent in the samples, there is no appreciable difference in the contrast enhancement of the T2/T1-weighted images between the samples with different concentrations of the nanoparticles. Such an effect can be ascribed to the intrinsic ratiometric properties of the T2/T1-weighted imaging protocol.
On the other hand, the recorded T1-weighted 19F MRI images yielded detectable SNR even for the low [Gd(III)] samples (Fig. 4f). Furthermore, virtually no 19F MRI signal enhancement effect could be observed between the samples with and without Ca(II), while maintaining a linear dependence to their Gd(III) concentration.
 | ||
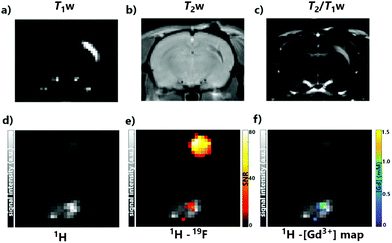
| Fig. 4 1H and 19F MRI in vivo experiments, performed at 7 T. 1H MRI with a commercial volume coil for (a) T1-weighted, (b) T2-weighted and (c) T2/T1-weighted scans; 1H/19F MRI was performed with a custom-built surface coil, which shows an area of right hemisphere of somatosensory rat cortex, where GdPFLNPs were injected: (d and e) 1H only and overlapped 19F/1H MR images; (f) Gd-map overlapped on 1H MRI (see Fig. S3 in ESI† for [Gd(III)] values). TFA reference is presented in (d–f) in the upper half of the MR images. | ||
Ultimately, MRI experiments in vivo were designed and performed in order to confirm the compatibility and viability of our methodology in living biological systems. An isotonic suspension of GdPFLNPs was injected intracranially in the somatosensory cortex of adult male Sprague Dawley rats. No detrimental effects were noticed upon injection. Thereafter, the animals (n = 3) were moved to the 7 T MRI scanner and a reference vial containing TFA (100 mM, as in the phantom experiment) was placed near the head of the rat. For the MRI acquisition, a series of 1H and 19F MR imaging protocols were executed. 1H MRI images were acquired using T1-, T2- and T2/T1-weighted imaging sequences, showing a clear contrast enhancement effect due to the presence of GdPFLNPs in the tissue (Fig. 4a–c). The quantification of the local concentration of GdPFLNPs was performed by acquiring a 19F T1-weighted image, followed by an anatomical T1-weighted 1H scan using the same spatial resolution of the fluorine measurement (Fig. 4d and e). The ratio between the TFA reference signal and the GdPFLNPs signal, known from the MRI tube phantom experiments (see above), was used to estimate the local concentration of the nanoparticles in the tissue (expressed in [Gd(III)] (Fig. 4f)). The obtained [Gd(III)] map displays a maximum of ∼1.0 mM at the center of injection (see Fig. S5 in ESI†). Such a result is plausible, taking into consideration that the concentration of the injected suspension was [Gd(III)] = 2.6 mM and a substantial dilution of the probe in the tissue upon administration is to be expected.
In summary, we report a nanosized system with a perfluorinated core and a calcium-responsive Gd(III)-chelator appended on its surface. The convenient ratio between 19F and Gd3+ enabled both 1H and 19F MRI with these. We observed excellent contrast enhancement properties in response to the coordination of calcium ions with different 1H MRI protocols. MRI experiments in vivo showed an exceptional outlook for the nanoparticle probe in molecular fMRI studies; good MRI signal enhancement was exhibited in the brain tissue where the probe was administered, at both the 1H and 19F frequencies. Consequently, this allowed us to estimate the local concentration of the nanoparticles, which is not routinely achieved with paramagnetic probes in vivo. The capacity to determine the concentration of an MRI responsive probe, while being able to rapidly measure the contrast enhancement due to interactions with its intended biomarker would represent a great advancement for molecular fMRI. This work is a valuable step towards the development of a fully quantitative methodology for the molecular imaging of biomarkers involved in highly relevant biological processes.
The authors thank Dr Katharina Hipp and the EM Facility of the Max Planck Institute for Developmental Biology for performing the cryo-TEM experiments, Dr Rolf Pohmann for the helpful discussions on 19F MRI experiments and Dipl. Ing. Michael Beyerlein for help with the in vivo experimental setup. The financial support from the German Research Foundation (DFG, grant AN 716/7-1) and the German Federal Ministry of Education and Research (BMBF, e:Med program: FKZ: 01ZX1503) is gratefully acknowledged. Open Access funding provided by the Max Planck Society.
Conflicts of interest
There are no conflicts to declare.Notes and references
- M. A. Pysz, S. S. Gambhir and J. K. Willmann, Clin. Radiol., 2010, 65, 500–516 CrossRef CAS PubMed.
- M. Wu and J. Shu, Contrast Media Mol. Imaging, 2018, 2018, 1382183 Search PubMed.
- J. Wahsner, E. M. Gale, A. Rodriguez-Rodriguez and P. Caravan, Chem. Rev., 2019, 119, 957–1057 CrossRef CAS PubMed.
- H. Li and T. J. Meade, J. Am. Chem. Soc., 2019, 141, 17025–17041 CrossRef CAS PubMed.
- A. Barandov, B. B. Bartelle, B. A. Gonzalez, W. L. White, S. J. Lippard and A. Jasanoff, J. Am. Chem. Soc., 2016, 138, 5483–5486 CrossRef CAS PubMed.
- T. Savic, G. Gambino, V. S. Bokharaie, H. R. Noori, N. K. Logothetis and G. Angelovski, Proc. Natl. Acad. Sci. U. S. A., 2019, 116, 20666–20671 CrossRef PubMed.
- M. V. Clavijo Jordan, S. T. Lo, S. Chen, C. Preihs, S. Chirayil, S. Zhang, P. Kapur, W. H. Li, L. M. De Leon-Rodriguez, A. J. Lubag, N. M. Rofsky and A. D. Sherry, Proc. Natl. Acad. Sci. U. S. A., 2016, 113, E5464–5471 CrossRef CAS PubMed.
- M. Brini, T. Cali, D. Ottolini and E. Carafoli, Cell. Mol. Life Sci., 2014, 71, 2787–2814 CrossRef CAS PubMed.
- L. A. Ekanger and M. J. Allen, Metallomics, 2015, 7, 405–421 RSC.
- K. L. Peterson, K. Srivastava and V. C. Pierre, Front. Chem., 2018, 6, 160 CrossRef PubMed.
- M. Srinivas, A. Heerschap, E. T. Ahrens, C. G. Figdor and I. J. de Vries, Trends Biotechnol., 2010, 28, 363–370 CrossRef CAS PubMed.
- S. Temme, P. Baran, P. Bouvain, C. Grapentin, W. Kramer, B. Knebel, H. Al-Hasani, J. M. Moll, D. Floss, J. Schrader, R. Schubert, U. Flogel and J. Scheller, ACS Nano, 2018, 12, 11178–11192 CrossRef CAS PubMed.
- E. T. Ahrens, R. Flores, H. Xu and P. A. Morel, Nat. Biotechnol., 2005, 23, 983–987 CrossRef CAS PubMed.
- A. de Vries, R. Moonen, M. Yildirim, S. Langereis, R. Lamerichs, J. A. Pikkemaat, S. Baroni, E. Terreno, K. Nicolay, G. J. Strijkers and H. Grull, Contrast Media Mol. Imaging, 2014, 9, 83–91 CrossRef CAS PubMed.
- A. A. Kislukhin, H. Xu, S. R. Adams, K. H. Narsinh, R. Y. Tsien and E. T. Ahrens, Nat. Mater., 2016, 15, 662–668 CrossRef CAS PubMed.
- A. H. Jahromi, C. Wang, S. R. Adams, W. Zhu, K. Narsinh, H. Xu, D. L. Gray, R. Y. Tsien and E. T. Ahrens, ACS Nano, 2019, 13, 143–151 CrossRef CAS PubMed.
- G. Angelovski, Acc. Chem. Res., 2017, 50, 2215–2224 CrossRef CAS PubMed.
- S. Okada, B. B. Bartelle, N. Li, V. Breton-Provencher, J. J. Lee, E. Rodriguez, J. Melican, M. Sur and A. Jasanoff, Nat. Nanotechnol., 2018, 13, 473–477 CrossRef CAS PubMed.
- K. Schulz, E. Sydekum, R. Krueppel, C. J. Engelbrecht, F. Schlegel, A. Schroter, M. Rudin and F. Helmchen, Nat. Methods, 2012, 9, 597–602 CrossRef CAS PubMed.
- N. K. Logothetis, J. Pauls, M. Augath, T. Trinath and A. Oeltermann, Nature, 2001, 412, 150–157 CrossRef CAS PubMed.
- J. M. Janjic and E. T. Ahrens, Wiley Interdiscip. Rev.: Nanomed. Nanobiotechnol., 2009, 1, 492–501 CAS.
- S. Gunduz, N. Nitta, S. Vibhute, S. Shibata, M. E. Mayer, N. K. Logothetis, I. Aoki and G. Angelovski, Chem. Commun., 2015, 51, 2782–2785 RSC.
- F. Garello, S. Vibhute, S. Gunduz, N. K. Logothetis, E. Terreno and G. Angelovski, Biomacromolecules, 2016, 17, 1303–1311 CrossRef CAS PubMed.
- M. L. Wood and P. A. Hardy, J. Magn. Reson. Imaging, 1993, 3, 149–156 CrossRef CAS PubMed.
- F. Kielar, L. Tei, E. Terreno and M. Botta, J. Am. Chem. Soc., 2010, 132, 7836–7837 CrossRef CAS PubMed.
Footnote |
| † Electronic supplementary information (ESI) available: Ligand synthesis, nanoparticles characterization, data acquisition. See DOI: 10.1039/d0cc04416d |
| This journal is © The Royal Society of Chemistry 2020 |


