Porous Co3O4 nanoplates as an efficient electromaterial for non-enzymatic glucose sensing†
Min
Kang
a,
Hai
Zhou
 *a,
Ning
Zhao
 b and
Baoliang
Lv
 b
b
aDepartment of Chemistry and Chemical Engineering, Zunyi Normal College, Zunyi 563006, P. R. China. E-mail: 591658314@163.com
bState Key Laboratory of Coal Conversion, Institute of Coal Chemistry, Chinese Academy of Sciences, Taiyuan 030001, P. R. China
First published on 5th November 2019
Abstract
Porous Co3O4 nanoplates constructed by loosely interconnected nanoparticles were synthesized via an L-lysine assisted hydrothermal treatment and subsequent thermal annealing. The hydrothermal conditions of reaction time, reaction temperature and reactant concentrations were investigated in detail. The results suggested that the high affinity of L-lysine could effectively control the redissolution–recrystallization and even restrict the dehydration–condensation reaction of the Co(OH)2 precursor, and thus played the key role for the preparation of the resulting porous Co3O4 nanoplates. Cyclic voltammetry and amperometric methods were used to evaluate the electrochemical performance of the resulting porous Co3O4 nanoplates toward glucose sensing in an alkaline medium. The sensors constructed by the porous Co3O4 nanoplates exhibited a fast response time (within 5 s), a detection limit of 2.7 μM, a sensitivity of 212.92 μA cm−2 mM−1, a linear range from 0.05 mM to 3.2 mM and good stability at a low applied potential (0.38 V vs. Ag/AgCl), suggesting its high performance towards non-enzymatic glucose sensing.
Introduction
Fast and accurate detection of glucose attracts great attention due to its significance in many fields, such as diabetes diagnosis and management, biological analysis, the food industry and environmental protection.1 To date, numerous techniques have been developed for the high-performance detection of glucose.1,2 Due to the advantages of excellent selectivity, high sensitivity and low detection limit, electrochemical enzymatic methods using natural enzymes as catalysts are commonly used for glucose detection. However, electrochemical enzymatic sensors still suffer from several disadvantages, such as high cost, complicated immobilization procedures, limited stability and reproducibility.1As an alternative method, non-enzymatic methods using nanomaterials as catalysts attract increasing attention due to their advantages of low cost, high stability, rapid response, wide detection range and low detection limit.3,4 For example, Pt-GO could respond to glucose within 3 s in a broad linear range from 1 mM to 25 mM at an applied potential of 0.05 V.5 Even though noble metal based materials generally exhibit excellent glucose detection performance,5–8 the high cost largely limits the commercial application of these electrodes. Thus, it is desirable to develop high-performance and cheap electrode materials for non-enzymatic glucose sensing. So far, a large number of transition metal based nanomaterials and their nanocomposites, such as NiO nanosheets,9 Ni(OH)2 hollow nanorods,10 Ni(OH)2/rGO,11,12 Ni3N/Ti,13 Fe3O4 nanotubes,14 CoP nanowire/Ti,15 nanosized Co3O4 (ref. 16 and 17) and so on, have been successfully employed as catalysts for non-enzymatic determination of glucose via electrochemical oxidation.
As an important transition metal oxide, Co3O4 has attracted extensive research interest in the fields of supercapacitors,18 lithium secondary batteries,19,20 catalysis21 and so on. Based on its excellent redox behaviors between the redox pairs Co2+/Co3+ and Co3+/Co4+, Co3O4 has also been proven to be a promising catalyst for electrochemical detection of glucose,16,17,22 hydrazine,23,24 H2O2,25 ethanol gas,26etc. As a non-enzymatic glucose sensing material, Co3O4 could generally exhibit high sensitivity, fast response, and excellent selectivity and stability, and the sensing performance of Co3O4 could be enhanced by taking the advantages of carbon and noble metals that have good conductivity and/or synergistic effects within mixed metal oxides. So far, numerous Co3O4 based nanocomposites, such as Co3O4/Au,8 Co3O4/carbon,27 Co3O4/NiO,28 Co3O4/TiO2 (ref. 29) and so on, have been employed as catalysts for electrochemical detection of glucose. For example, 3D porous honeycomb-like carbon supported Co3O4 nanoclusters could exhibit a wide linear range from 0.088 mM to 7 mM and a high sensitivity of 1377.8 μA cm−2 mM−1 toward glucose detection.27 As a consequence, the controllable synthesis of Co3O4 based nanomaterials possessing unique microstructures and excellent redox behaviors attracts wide research interest.
Herein, porous Co3O4 nanoplates were synthesized via a facile L-lysine assisted hydrothermal treatment and subsequent thermal annealing. The hydrothermal conditions of reaction time, reaction temperature and reactant concentrations were investigated in detail, which suggested that L-lysine played the key role for the preparation of the porous Co3O4 nanoplates. The present porous Co3O4 nanoplates showed high glucose sensing performance, such as well-defined and stable current-time response, a detection limit of 2.7 μM, a linear range from 0.05 mM to 3.2 mM and a sensitivity of 212.92 μA cm−2 mM−1 at 0.38 V (vs. Ag/AgCl).
Methods
Synthesis of porous Co3O4 nanoplates
All reagents were of analytical grade and used without further purification. The porous Co3O4 nanoplates were synthesized as follows: 0.5 g Co(NO3)2·6H2O and 0.1246 g L-lysine were dissolved in 14 mL of distilled water. Then, 0.1375 g NaOH was added into the above solution under vigorous stirring. The as-formed blue suspension was sealed in a 20 mL Teflon-lined stainless steel autoclave and maintained at 160 °C for 12 h. After cooling to room temperature naturally, the pink products were collected by centrifugation and washed with ultrapure water three times and with absolute ethanol twice. The final products were dried in air at 80 °C and calcined at 400 °C for 2 h.The hydrothermal synthesis was also conducted for 0, 0.5, 1, 2 and 6 h by maintaining the other reaction conditions constant so as to investigate the influence of reaction time. Similarly, synthesis conditions of reaction temperature and the dosage of L-lysine and NaOH were also investigated.
Characterizations
The products were characterized by X-ray diffraction (XRD) on a Rigaku D/max-rB diffractometer with Cu Kα radiation. Scanning electron microscopy (SEM, Scios, FEI) and transmission electron microscopy (TEM, Tecnai F20, FEI) were used to observe the morphology of the samples at acceleration voltages of 20 kV and 200 kV, respectively. Nitrogen adsorption–desorption properties of the samples were measured on a Quantachrome Autosorb-IQ2-MP-XR-VP at 77 K and the specific surface area was obtained via the Brunauer–Emmett–Teller (BET) method from the N2 adsorption–desorption isotherms.Electrochemical property measurements
A glassy carbon electrode (GCE) of 3 mm in diameter was polished with 0.3 and 0.05 μm alumina powders on a polishing cloth to create a mirror surface. The polished GCE was successively sonicated with absolute ethanol and de-ionized water. Then, 5 μL of 2.0 mg mL−1 Co3O4 dispersed suspension was casted onto the polished GCE and dried in air at 45 °C. The Co3O4 modified GCE (Co3O4/GCE) sensors were fabricated by 4 times of casting/drying cycles, which means that 20 μL of Co3O4 suspension was used to fabricate the Co3O4/GCE unless otherwise specified. After drying in air, 5 μL of Nafion aqueous solution (0.05 wt%) was dropped onto the Co3O4/GCE and finally dried at 45 °C.All electrochemical measurements were performed on a CHI 660E electrochemical workstation (Shanghai Chenhua, China) in a conventional three-electrode system using 0.1 M NaOH as an electrolyte. The Co3O4/GCE, Ag/AgCl (saturated by KCl) and a platinum plate were used as a working electrode, reference electrode and counter electrode, respectively. Cyclic voltammetry (CV) experiments were performed in a quiescent alkaline solution between 0 and 0.7 V, and amperometric experiments were carried out under continuous stirring at a potential of 0.38 V vs. Ag/AgCl. All the measurements were carried out at room temperature.
Results and discussion
Characteristics of the materials
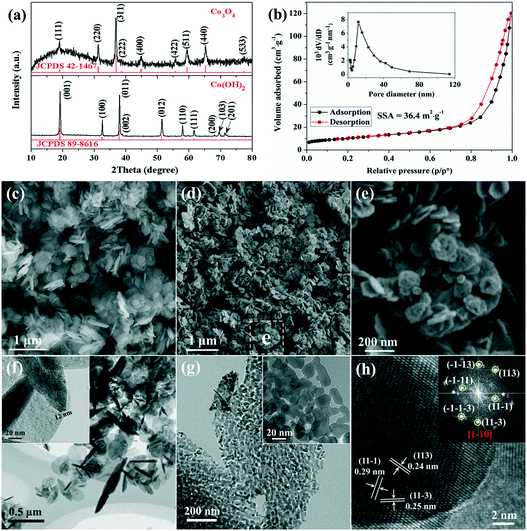
Characterization of the as-prepared precursor and the resulting porous Co3O4 nanoplates are shown in Fig. 1. The XRD pattern shows that all diffraction peaks of the precursor are perfectly indexed to those of Co(OH)2 (Fig. 1a). The narrow sharp peaks suggest that pure and well-crystallized Co(OH)2 is synthesized via the present L-lysine mediated hydrothermal method. The SEM and TEM images (Fig. 1c and f) show that the as-prepared Co(OH)2 exhibits a nanoplate structure with a smooth surface, and the thickness and diameter of the nanoplates are tens of nanometers and several hundred nanometers, respectively.After calcination at 400 °C, Co(OH)2 transforms into poorly crystallized Co3O4 as suggested by the broad XRD peaks (Fig. 1a). The average crystallite size of the resulting Co3O4 is calculated from the Scherrer equation, which is about 25 nm based on the (311) plane. The SEM image shows that the sample retains the nanoplate structure after calcination, and the more uniform size distribution suggests the fraction of large nanoplates during thermal annealing (Fig. 1d). Interestingly, as shown in the magnified image (Fig. 1e), a large number of pores are present on the surface of the calcined sample leading to the formation of a rough surface. The porous structure of Co3O4 is also confirmed with the TEM image, as shown in Fig. 1g. It is very clear that the Co3O4 nanoplates consist of numerous loosely interconnected nanoparticles with an average diameter of about 20 nm, thus a large quantity of pores are located between the nanoparticles. The BET surface area of the porous Co3O4 nanoplates is about 36.4 m2 g−1 (Fig. 1b). In addition, the porous feature is further confirmed by a pore-size distribution of about 30 nm (the inset in Fig. 1b), which is consistent with the TEM observation. The formation of pores could be related to the successive release of H2O and other gases (e.g. CO2 and NOx) during the decomposition of Co(OH)2 and the adsorbed L-lysine at high temperature. It is known that a porous feature is able to provide more reactive sites and short diffusion pathways for electrolytes, electrochemical reactive materials and reaction products, which is suitable for a fast reversible Faradaic reaction during repeated electrochemical processes.30–32 The lattice resolved HRTEM image of Co3O4 nanoplates is shown in Fig. 1h. The corresponding interplanar spacings are measured to be 0.29 nm, 0.24 nm and 0.25 nm, which are indexed to the (11−1), (113) and (11−3) crystal planes of cubic Co3O4, respectively.
Formation mechanism of the porous Co3O4 nanoplates
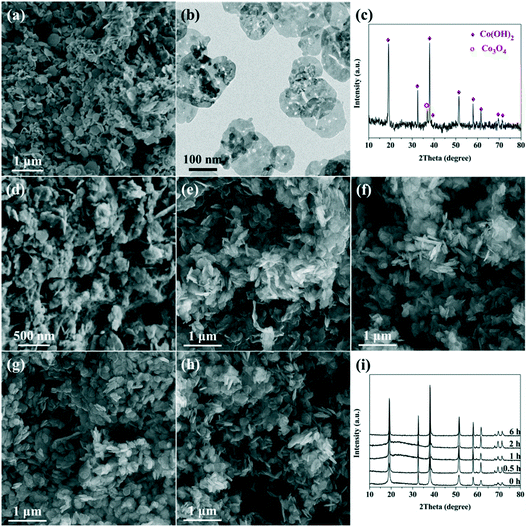
It was reported that L-lysine could serve as an efficient shape control agent, because it comprises two amine groups (NH2–) and one carboxyl (–COOH or –COO−) group that could coordinate with metal cations.33–35 To well understand the role of L-lysine with respect to the formation of the Co(OH)2 precursor and the final porous Co3O4 nanoplates, time-dependent experiments were carried out. Meanwhile, Co(OH)2 was also prepared without the addition of L-lysine. As can be seen in Fig. 2a, nanoplates are also obtained without the addition of L-lysine, which is in accordance with previous reports.36,37 However, without the controlling effect of L-lysine, the nanoplates exhibit a wide size distribution; meanwhile, small nanoparticles and bulk aggregates can also be observed. The XRD result suggests that the main composition of the product is Co(OH)2, and a little amount of Co3O4 can also be identified (Fig. 2c). This indicates that the dehydration–condensation of Co(OH)2 proceeds slightly during the hydrothermal treatment at 160 °C, which does not take place under the controlling effect of L-lysine. After calcination, Co(OH)2 breaks into small nanoplates (Fig. 2b), which possess a much denser microstructure as compared with those prepared with the assistance of L-lysine.The SEM images of the samples prepared at different reaction times are shown in Fig. 2d–h. As can be seen, nanoplates and irregular bulks are obtained via rapid precipitation (Fig. 2d). A large amount of separated nanoplates as well as tightly aggregated bulks are synthesized after hydrothermal treatment for 0.5 h (Fig. 2e). With the prolongation of reaction time, the nanoplates gradually exhibit a more regular shape and a clear profile, and the aggregation of these nanoplates becomes more loose as well (Fig. 2f–h). Furthermore, no distinct size variation could be observed over these nanoplates, which indicates that no obvious dissolution–recrystallization process takes place after 1 h of hydrothermal reaction. The XRD patterns show that the composition of these samples is pure Co(OH)2 (Fig. 2i).
Organic and/or inorganic ligands could preferentially coordinate with specific crystal facets of transition metal oxides and/or hydroxides, which could then decrease the growth rate of the coordinated facets leading to the formation of nanocrystals possessing unique microstructures.38,39 Herein, an adsorption mediated process based on L-lysine can also be postulated in the present hydrothermal synthesis, as illustrated in Scheme 1. Firstly, irregular aggregated bulks are formed via the rapid precipitation between Co2+ and OH−. After that, there are two plausible processes that can in principle lead to the morphology transformation of Co(OH)2: (1) a redissolution–recrystallization process would take place due to the low crystallinity of the initially precipitated products. (2) L-Lysine selectively adsorbs onto the Co(OH)2 surface, which promotes the “exfoliation” of nanoplates from the bulks and stabilizes the isolated nanoplates as well. Thus, the morphology transformation from irregular bulks to separated nanoplates proceeds rapidly (within 1 h). The high affinity of L-lysine could also control the further growth of Co(OH)2 and even restrict its dehydration–condensation reaction.34 Hence, the diameter and thickness of Co(OH)2 nanoplates prepared at different reaction times (from 1 to 12 h) show a small difference. Therefore, the formation of Co(OH)2 nanoplates possessing a regular shape and clear profile is probably realized via the rather slow redissolution–recrystallization process, which is mainly restricted at the edge of nanoplates due to the strong coordination of L-lysine.
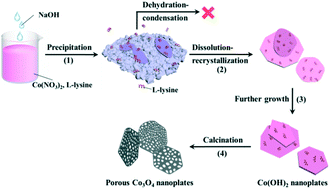 | ||
| Scheme 1 Schematic illustration of the possible formation mechanism of the Co(OH)2 nanoplates and the resulting porous Co3O4 nanoplates. | ||
The influence of other reaction conditions such as reaction temperature and concentrations of NaOH and L-lysine was also investigated. It can be seen that the reaction temperature and NaOH concentration have little effect on the diameter, thickness and aggregation extent of the nanoplates (Fig. S1 and S2†). By contrast, the size uniformity of the nanoplates varies significantly with the increase of L-lysine concentration (Fig. S3†). These results suggest that the concentration of L-lysine plays a more important role with respect to the synthesis of homogeneous Co(OH)2 nanoplates. Moreover, Co(OH)2 nanobelts and 3D structures constructed by nanoplates are prepared using L-alanine and L-threonine, respectively, as ligands in a similar hydrothermal method (Fig. 3). Therefore, besides the selective and/or competitive adsorption of amine and carboxyl groups, the molecular structure of the amino acid also strongly affects the growth process of Co(OH)2, which still needs further research.
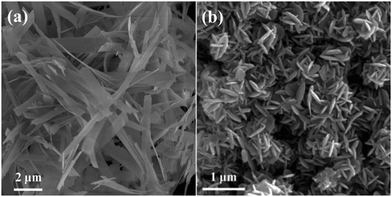 | ||
| Fig. 3 SEM images of the samples prepared using (a) L-alanine and (b) L-threonine as ligands in a similar hydrothermal method. | ||
Electrocatalytic oxidation of glucose on Co3O4/GCE
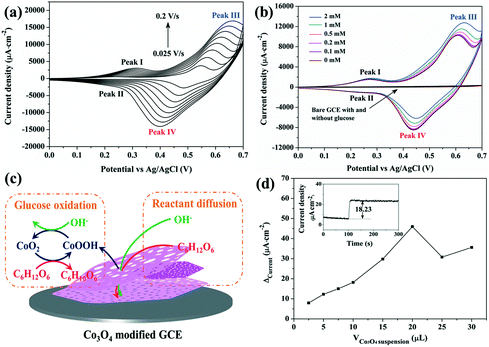
The electrochemical performance of Co3O4/GCE was firstly explored by means of cyclic voltammetry (CV), as shown in Fig. 4a. In accordance with literature studies, redox reactions of Co3O4/CoOOH and CoOOH/CoO2 are confirmed by two pairs of redox peaks labelled I/II and III/IV, respectively.23–25 The redox reactions of Co3O4 in an alkaline medium can be expressed as eqn (1) and (2). Meanwhile, both the anodic and cathodic peaks are enhanced proportionally with the increase of scan rate from 0.025 to 0.2 V s−1. The oxidation peaks and reduction peaks shift toward the positive and negative directions with the increase of scan rate, respectively, leading to the gradual separation of reduction-to-oxidation peak potentials. Fig. S4† shows that the peak current densities obtained from the CV measurements are proportional to the scan rate, suggesting that the electrochemical reaction based on the Co3O4/GCE involves a diffusion-controlled process.10,11| Co3O4 + OH− + H2O → 3CoOOH + e− | (1) |
| CoOOH + OH− → CoO2 + H2O + e− | (2) |
| CoO2 + glucose → CoOOH + gluconolactone | (3) |
CV performance of the Co3O4/GCE and bare GCE were further investigated with the injection of different amounts of glucose (Fig. 4b). No obvious oxidation and reduction peaks are observed at the bare GCE both in the absence and presence of glucose, suggesting that the bare GCE is inactive for the oxidation of glucose. By contrast, the Co3O4/GCE still shows two pairs of redox peaks, and the current intensities of anodic peaks I and III are enhanced with the increase of glucose concentration, while those of cathodic peaks II and IV decrease gradually. Meanwhile, the redox peak current densities of CoOOH/CoO2 (III/IV) vary much more significantly than those of Co3O4/CoOOH (I/II), which suggests that the oxidation of glucose over the Co3O4/GCE is mainly catalyzed by the electrons transferred from CoO2 to CoOOH, as shown in Fig. 4c.1,16 Firstly, Co3O4 is oxidized to CoO2viareactions (1) and (2). CoO2 then reacts with glucose, which consumes CoO2 and produces CoOOH and gluconolactone (reaction (3)). Because some CoOOH is regenerated via the reaction between CoO2 and glucose instead of the reverse reaction of reaction (2), thus the intensity of the cathodic peak IV is decreased upon the addition of glucose.16,24 These results indicate that the present porous Co3O4 nanoplates possess good electrocatalytic activity toward electrochemical non-enzymatic glucose sensing.
Fig. 4d shows the current density variation (ΔCurrent) of Co3O4/GCE before and after the injection of 0.1 mM glucose versus the volume of Co3O4 suspension used to construct the sensor. Apparently, the ΔCurrent gradually increases with the increase of the volume of Co3O4 suspension from 2.5 μL to 20 μL, and then decreases with the further increase of the volume of Co3O4 suspension. This is because thicker particles increase the diffusion path of glucose, and the transportation of electrons decreases largely as well due to the poor conductivity of Co3O4.40,41 Thus, a 20 μL Co3O4 dispersed solution is used to fabricate the Co3O4/GCE. In addition, the inset of Fig. 4d shows that the Co3O4/GCE exhibits high stability during a relatively long period of amperometric measurements. With the addition of 0.1 mM glucose, the Co3O4/GCE responds rapidly and a steady-state signal is obtained within 5 s, and the current density remains stable during the following 200 s without any apparent decrease and/or increase, suggesting that glucose and its oxidation products have no obvious unfavourable influence on the Co3O4/GCE.25
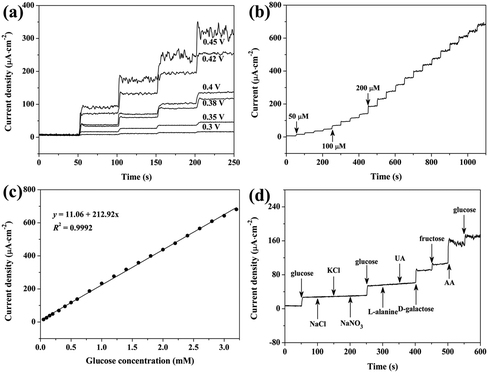
It is generally reported that applied potential can strongly affect the amperometric response of sensors.6,11 Thus, applied potential for the amperometric response of the Co3O4/GCE was also optimized. As shown in Fig. 5a, upon successive injection of 0.1 mM glucose, rapid response is obtained at various applied potentials. The current density increases greatly with the increase of potential from 0.30 V to 0.45 V, indicating that the glucose oxidation rate on the Co3O4/GCE is significantly accelerated by higher applied potentials. However, the noise current also increases with the increase of applied potential, especially at 0.45 V. Moreover, despite the steady-state current with low noise, the Co3O4/GCE could not withstand a high glucose concentration for a long time at applied potentials of 0.4 V and 0.42 V, leading to a narrow linear detection range (Fig. S5†). As a result, 0.38 V is chosen as the optimal working potential in the following tests, and this low applied potential can also reduce the interference of other electroactive materials, which is helpful to improve the selectivity.17
Fig. S6† and 5b show the typical amperometric response of the Co3O4/GCE upon the successive injection of low and high concentrations of glucose, respectively, into stirred 0.1 M NaOH. It can be seen that the Co3O4/GCE could achieve 95% of the steady-state current within 5 s upon the addition of glucose, and the current–time response is well-defined and stable during the long detection period. Moreover, despite the continuous stirring, the current response only exhibits relatively high noise at the end of the test (Fig. 4c), indicating the high stability of the present Co3O4/GCE. The linear relationship between the steady-state current density and the glucose concentration is shown in Fig. 5c. The Co3O4/GCE shows a linear response with a concentration of glucose from 0.05 mM to 3.2 mM and a sensitivity of 212.92 μA cm−2 mM−1, which can be given as I (μA cm−2 mM−1) = 212.92c (mM) + 11.06, and the calculated detection limit is ∼2.7 μM by using the formula 3sb/S (S/N = 3).42,43 Here, the standard deviation of the background current (sb) and the slope of the calibration plot (S), respectively, are 0.195 μA cm−2 and 212.92 μA cm−2 mM−1.
The electrochemical performance of Co3O4/GCE was also carried out by using several other electroactive materials to evaluate the selectivity of the sensor. Fig. 5d shows the amperometric response of Co3O4/GCE to glucose, NaCl, KCl, NaNO3, L-alanine, uric acid (UA), D-galactose, fructose and ascorbic acid (AA). The concentration of these interferences is 0.1 mM. The Co3O4/GCE shows steady current response upon the addition of 0.1 mM glucose, and no current response is observed for NaCl, KCl, NaNO3, L-alanine and UA, indicating that these materials are inactive over the Co3O4/GCE under the test conditions and thus do not interfere with the detection of glucose. However, D-galactose and fructose causes comparable response as compared with glucose. Meanwhile, despite the assistance of Nafion, AA even causes much higher response than glucose,25 and the strong noise signal suggests the serious unfavorable influence on Co3O4/GCE. To our delight, the current response generated by the subsequent injection of glucose is almost the same as the initial response. It should be pointed out that the concentration of these interferences is >10 times lower than that of glucose, thus the interference of these compounds might not be serious and could even be ignored toward glucose detection in human blood.
In order to investigate the response repeatability of the Co3O4/GCE, CV measurements were repeated 7 times using the same Co3O4/GCE in a 0.1 mM glucose solution (the solution was replaced after each test). The relative standard deviation (RSD) of the peak current density (peak III) based on these CV measurements is calculated to be 1.39%, as shown in Fig. S7.† The reproducibility of the electrode fabrication procedure was also investigated, 3 Co3O4/GCE were fabricated and tested separately in 0.1 mM glucose solution. The calculated RSD for these ΔCurrent was calculated to be 1.41% (Fig. S8†). After storing the electrodes for 5 and 10 days in a refrigerator (ca. 4 °C), the ΔCurrent of the sensor toward 1 mM glucose still retain 93.1% and 82.1% of its initial average value, respectively (Fig. S8†). All these results suggest that the Co3O4/GCE possesses high repeatability and reproducibility and long-time stability with respect to electrochemical glucose sensing.
A comparison of the performance of the present porous Co3O4 nanoplates with previously reported cobalt oxide based materials is given in Table 1. Apparently, the glucose sensing performance of the porous Co3O4 nanoplates is not outstanding as compared with that of the nanocomposites of 3D Co3O4/C,27 Co3O4/Au (ref. 8) and the commercial Pt–Ir electrode,44 which possess conductive agents and/or costly noble metals. Nevertheless, the sensitivity and linear range of the present porous Co3O4 nanoplates are comparable and even better than those of some reported Co3O4 (ref. 7, 16, 29 and 42) and/or Co3O4 based nanocomposites.29 Moreover, it should be noticed that even though some materials show a wide linear range, no steady current response could be obtained during the successive interval injection of glucose,28,42 and some materials even show two or three linear ranges.16,42 The obtained high glucose sensing performance suggests the excellent electrocatalytic activity of the porous Co3O4 nanoplates, which could be mainly ascribed to their porous feature. Besides providing more reactive sites, the porous structure allows easy access of active materials (e.g. OH− and glucose) to the Co3O4 surface, and it is also conducive to the diffusion of oxidized gluconolactone within short diffusion paths.
| Materials | Applied potential (V) (vs. Ag/AgCl) | Sensitivity (μA cm−2 mM−1) | Linear range (mM) | Reference |
|---|---|---|---|---|
| Porous Co3O4 nanoplates | 0.38 | 212.92 | 0.05 up to 3.2 | This work |
| Porous Co3O4 film | 0.6 | 366.03 | 0.001–0.5, 0.75–1.5, 1.75–3 | 16 |
| Co–CoO–Co3O4 | 0.55 | 949.3 | 0.005–0.6, 0.6–4.3 | 42 |
| Co3O4 hollow microspheres | 0.35 | 102.77 | 0.1–5 | 17 |
| Co3O4/NiO nanofibers | 0.5 | 2477 | 0.001–9.055 | 28 |
| Co3O4 acicular nanowire arrays | 0.5 | 1765.90 | 0.01–2.1 | 29 |
| Co3O4 acicular nanowire arrays/TiO2 | 0.5 | 2008.82 | 0.01–3.0 | 29 |
| NiCo2O4–Pd nanosheets | 0.4 | 0.04 | 0.005–0.09 | 7 |
| 3D Co3O4/C | 0.5 | 1377 | 0.088–7 | 27 |
| Co3O4/Au | 0.3 | 6000 | 0.0002–0.2, 0.5–20 | 8 |
| Spiral-type Pt–Ir electrode | 0.7 | 20–30 (nA mM−1) | 2–30 | 44 |
Conclusions
Herein, porous Co3O4 nanoplates constructed by loosely interconnected nanoparticles with an average diameter of about 20 mm and a main pore size distribution of about 30 nm were synthesized via an L-lysine assisted hydrothermal treatment and subsequent thermal annealing process. Condition-dependent experiments showed that L-lysine played the key role for the preparation of the porous Co3O4 nanoplates. The high affinity of L-lysine could effectively control the redissolution–recrystallization and even restrict the dehydration–condensation reaction of the Co(OH)2 precursor. The thermal decomposition of L-lysine adsorbed on Co(OH)2 leads to the formation of porous Co3O4. Due to the easy access of active materials to the surface of Co3O4 and the subsequent fast diffusion of oxidized gluconolactone within the porous structure, the sensors constructed by these porous Co3O4 nanoplates exhibited a response time of within 5 s, a detection limit of 2.7 μM, a sensitivity of 212.92 μA cm−2 mM−1, a linear range from 0.05 mM to 3.2 mM and good stability at a low applied potential (0.38 V vs. Ag/AgCl), suggesting their excellent performance towards non-enzymatic glucose sensing.Conflicts of interest
There are no conflicts to declare.Acknowledgements
We are grateful for the grants from the Technology Foundation of the Science and Technology Department of Guizhou Province (No. [2017]1208), the Natural Science Research Project of Education Department of Guizhou Province (No. [2015]394 and [2016]093), the Natural Science Foundation of Shanxi Province (No. 201601D102006), and the National Natural Science Foundation of China (No. 21972158).Notes and references
- H. Zhu, L. Li, W. Zhou, Z. P. Shao and X. J. Chen, J. Mater. Chem. B, 2016, 4, 7333 RSC.
- K. D. Xia, C. Yang, Y. L. Chen, L. L. Tian, Y. Y. Su, J. B. Wang and L. Li, Sens. Actuators, B, 2017, 240, 979 CrossRef CAS.
- M. U. Khan, H. J. You, D. J. Zhang, L. L. Zhang and J. X. Fang, CrystEngComm, 2018, 20, 7582 RSC.
- Q. C. Dong, X. D. Wang, W. S. Willis, D. H. Song, Y. K. Huang, J. Zhao, B. K. Li and Y. Lei, Electroanalysis, 2019, 31, 678 CrossRef CAS.
- G. Chang, H. H. Shu, Q. W. Huang, M. Oyama, K. Ji, X. Liu and Y. B. He, Electrochim. Acta, 2015, 157, 149 CrossRef CAS.
- L. Wang, X. P. Lu, C. J. Wen, Y. Z. Xie, L. F. Miao, S. H. Chen, H. B. Li, P. Li and Y. H. Song, J. Mater. Chem. A, 2015, 3, 608 RSC.
- K. K. Naik, A. Gangan, B. Chakraborty, S. K. Nayak and C. S. Rout, ACS Appl. Mater. Interfaces, 2017, 9, 23894 CrossRef CAS.
- Y. Y. Su, B. B. Luo and J. Z. Zhang, Anal. Chem., 2016, 88, 1617 CrossRef CAS.
- H. Y. Zhang and S. Liu, Sens. Actuators, B, 2017, 238, 788 CrossRef CAS.
- J. Yang, M. Cho and Y. Lee, Sens. Actuators, B, 2016, 222, 674 CrossRef CAS.
- Y. Zhang, F. G. Xu, Y. J. Sun, Y. Shi, Z. W. Wen and Z. Li, J. Mater. Chem., 2011, 21, 16949 RSC.
- P. Subramanian, J. Niedziolka-Jonsson, A. Lesniewski, Q. Wang, M. Li, R. Boukherroub and S. Szunerits, J. Mater. Chem. A, 2014, 2, 5525 RSC.
- F. Y. Xie, T. T. Liu, L. S. Xie, X. P. Sun and Y. L. Luo, Sens. Actuators, B, 2018, 225, 2794 CrossRef.
- Y. C. Chen, J. Hsu, Z. B. Chen, Y. G. Lin and Y. Hsu, J. Electroanal. Chem., 2017, 788, 144 CrossRef CAS.
- Y. W. Liu, X. Q. Cao, R. M. Kong, G. Du, A. M. Asiri, Q. Lua and X. P. Sun, J. Mater. Chem. B, 2017, 5, 1901 RSC.
- S. S. Fan, M. G. Zhao, L. J. Ding, J. J. Liang, J. Chen, Y. C. Li and S. G. Chen, J. Electroanal. Chem., 2016, 775, 52 CrossRef CAS.
- L. J. Ding, M. G. Zhao, S. S. Fan, Y. Ma, J. J. Liang, X. T. Wang, Y. W. Song and S. G. Chen, Sens. Actuators, B, 2016, 235, 162 CrossRef CAS.
- T. Zhai, L. M. Wan, S. Sun, Q. Chen, J. Sun, Q. Y. Xia and H. Xia, Adv. Mater., 2017, 29, 1604167 CrossRef PubMed.
- Y. M. Chen, L. Yu and X. W. Lou, Angew. Chem., 2016, 128, 6094 CrossRef.
- J. Sun, D. H. Li, Y. Z. Xia, X. Y. Zhu, L. Zong, Q. Ji, Y. Jia and D. J. Yang, Chem. Commun., 2015, 51, 16267 RSC.
- Z. C. Wang, H. L. Liu, R. X. Ge, X. Ren, J. Ren, D. J. Yang, L. X. Zhang and X. P. Sun, ACS Catal., 2018, 8, 2236 CrossRef CAS.
- K. Khun, Z. H. Ibupoto, X. Liu, V. Beni and M. Willander, Mater. Sci. Eng., B, 2015, 194, 94 CrossRef CAS.
- J. Zhang, W. B. Gao, M. L. Dou, F. Wang, J. J. Liu, Z. L. Li and J. Ji, Analyst, 2015, 140, 1686 RSC.
- T. T. Zhou, P. Lu, Z. Zhang, Q. Wang and A. Umar, Sens. Actuators, B, 2016, 235, 457 CrossRef CAS.
- M. Wang, X. D. Jiang, J. J. Liu, H. L. Guo and C. G. Liu, Electrochim. Acta, 2015, 182, 613 CrossRef CAS.
- L. Li, C. M. Zhang, R. Z. Zhang, X. H. Gao, S. J. He, M. M. Liu, X. K. Li and W. Chen, Sens. Actuators, B, 2017, 244, 664 CrossRef CAS.
- L. Wang, Y. Y. Zhang, Y. Z. Xie, J. Yu, H. Yang, L. F. Miao and Y. H. Song, Appl. Surf. Sci., 2017, 402, 47 CrossRef CAS.
- R. Ramasamy, K. Ramachandran, G. G. Philip, R. Ramachandran, H. A. Therese and G. Gnana Kumar, RSC Adv., 2015, 5, 76538 RSC.
- Z. F. Gao, L. Q. Zhang, C. Ma, Q. D. Zhou, Y. S. Tang, Z. Q. Tu, W. Yang, L. S. Cui and Y. F. Li, Biosens. Bioelectron., 2016, 80, 511 CrossRef CAS.
- T. Zhai, L. M. Wan, S. Sun, Q. Chen, J. Sun, Q. Y. Xia and H. Xia, Adv. Mater., 2017, 29, 1604167 CrossRef.
- C. Feng, J. F. Zhang, Y. He, C. Zhong, W. B. Hu, L. Liu and Y. D. Deng, ACS Nano, 2015, 9, 1730 CrossRef CAS.
- R. B. Rakhi, W. Chen, M. N. Hedhili, D. Cha and H. N. Alshareef, ACS Appl. Mater. Interfaces, 2014, 6, 4196 CrossRef CAS.
- H. J. Yan, J. Wang, S. N. Li, W. L. Yang, Z. Gao, Q. Liu, R. Gao, Z. S. Li, M. L. Zhang and L. H. Liu, Electrochim. Acta, 2013, 87, 880 CrossRef CAS.
- G. T. Fu, C. Liu, R. Wu, Y. Chen, X. S. Zhu, D. M. Sun, Y. W. Tang and T. H. Lu, J. Mater. Chem. A, 2014, 2, 17883 RSC.
- S. F. Shao, G. J. Zhang, H. J. Zhou, P. C. Sun, Z. Y. Yuan, B. H. Li, D. T. Ding and T. H. Chen, Solid State Sci., 2007, 9, 725 CrossRef CAS.
- K. Deori, S. K. Ujjain, R. K. Sharma and S. Deka, ACS Appl. Mater. Interfaces, 2013, 5, 10665 CrossRef CAS.
- H. Pang, X. R. Li, Q. X. Zhao, H. G. Xue, W.-Y. Lai, Z. Hu and W. Huang, Nano Energy, 2017, 35, 138 CrossRef CAS.
- M. Kang, H. Zhou, D. Wu and B. L. Lv, CrystEngComm, 2016, 18, 9299 RSC.
- H. Zhou, M. Kang, D. Wu and B. L. Lv, CrystEngComm, 2016, 18, 5456 RSC.
- Y. H. Dou, J. T. Xu, B. Y. Ruan, Q. N. Liu, Y. D. Pan, Z. Q. Sun and S. X. Dou, Adv. Energy Mater., 2016, 6, 1501835 CrossRef.
- X. C. Dong, H. Xu, X. W. Wang, Y. X. Huang, M. B. Chan-Park, H. Zhang, L. H. Wang, W. Huang and P. Chen, ACS Nano, 2012, 6, 3206 CrossRef CAS.
- J. Yu, Y. H. Ni and M. H. Zhai, J. Alloys Compd., 2017, 723, 904 CrossRef CAS.
- T. Raj kumar, K. J. Babu, D. J. Yoo, A. R. Kim and G. Gnana kumar, RSC Adv., 2015, 5, 41457 RSC.
- J. Y. Yu, Z. G. Zhu, C. Chen, Z. H. Li and Y. X. Chen, Chuangan Jishu Xuebao, 2016, 29, 9 Search PubMed.
Footnote |
| † Electronic supplementary information (ESI) available: SEM images of the samples prepared by different condition-dependent experiments and some results of electrochemical measurements. See DOI: 10.1039/c9ce01396b |
| This journal is © The Royal Society of Chemistry 2020 |

