Growth, spectroscopic properties and efficient laser action of an Yb0.09Lu0.13Gd0.78Ca4O(BO3)3 crystal
Fenfen
Liu
 ,
Liang
Dong
,
Junxian
Chen
,
Shuxuan
Cao
,
Honghao
Xu
and
Junhai
Liu
*
,
Liang
Dong
,
Junxian
Chen
,
Shuxuan
Cao
,
Honghao
Xu
and
Junhai
Liu
*
College of Physics, Qingdao University, 308 Ning-Xia Road, Qingdao 266071, China. E-mail: junhai_liu@hotmail.com; Fax: 0086 532 8595 5977
First published on 5th August 2020
Abstract
A new Yb-ion laser crystal of Yb0.09Lu0.13Gd0.78Ca4O(BO3)3 was grown by using the Czochralski method. The polarized absorption and emission spectra with respect to the three principal optic axes were obtained, with the maximum cross-section of the zero-phonon absorption and emission determined to be 1.90 × 10⁻²⁰ cm2 (E//X) and 1.55 × 10⁻²⁰ cm2 (E//X), respectively. An analysis of gain curves indicates the superiority of this crystal to Yb:GdCOB in realizing laser operation at the zero-phonon line of around 977 nm. Efficient continuous-wave laser action was achieved in the main emission band, generating an output power of 13.53 W with an optical-to-optical efficiency of 64.6%, and the slope efficiency amounting to 71%.
A. Introduction
Solid-state laser materials are usually made by incorporating an amount of lanthanide rare-earth or transition metal active ions into some host media. As host crystals for the ytterbium (Yb) ion, monoclinic rare-earth calcium oxyborates, ReCa4O(BO3)3 (ReCOB), with Re being La, Gd, or Y, are proven to be preferable due to their unique advantages. Firstly, the Yb ion in such crystals possesses a particularly large Stark splitting of its ground state (>1000 cm−1 (ref. 1 and 2)), which is greater than in most other host crystals, and can facilitate low-threshold high-efficiency laser operation at room temperature. Secondly, the Yb ion in such crystals has a pretty long fluorescence lifetime amounting to 2.2–2.5 ms,1,3 longer than in most other crystals, which is desirable for generating high-energy laser pulses through the Q-switching technique. Additionally, ReCOBs, such as YCOB, GdCOB, LaCOB,4 and even TmCOB,5 are themselves nonlinear optical crystals enabling efficient frequency or wavelength conversions,4,5 so the Yb-doped ReCOBs are also self-frequency doubling laser crystals, capable of generating visible laser radiation with no need for other frequency converters inside the laser resonator.So far, the most familiar and most extensively investigated Yb-ion laser crystals in this class have been Yb:GdCOB and Yb:YCOB, both of which were developed at the end of the last century.1,6 During the recent several years, significant progress has been made in the development of solid-state lasers based on the Yb:GdCOB or Yb:YCOB crystal, and operating in various modes including continuous-wave (CW),7–10 passive or active Q-switching,7,9,11–14 mode-locking,15,16 and self-frequency doubling.17–19 Besides the two single crystals of Yb:YCOB and Yb:GdCOB, their solid solutions or mixed crystals, YbtYxGd1−t–xCa4O(BO3)3, have also attracted much attention.20–23 The research work conducted on Yb:LaCOB, the third member of the single crystals in this family, was much less, despite the fact that it appeared at the very early stage.2 It was not until 2013 that the polarized spectroscopic properties of Yb:LaCOB were studied;24 and only very recently, high-power CW and passively Q-switched laser operations were demonstrated.25–27
When utilized as a host material for the Yb ion, a Lu-consisting crystal is in general advantageous over its La-, Gd-, or Y-consisting counterparts, because of the closeness between Lu and Yb elements in their atomic mass, ionic radius, and electron number, which leads to the minimum lattice distortion resulted from ion substitution in an Yb-doped crystal. Familiar examples of this include Yb:LuVO4,28 Yb:LuPO4,29–31 and Yb:KLu(WO4)2.32
Unfortunately, neither LuCOB nor YbCOB is congruently melting,33 so it seems to be not feasible to grow Yb:LuCOB crystals by the Czochralski method. On the other hand, however, LuxGd1−xCa4O(BO3)3, the solid solutions consisting of Lu and Gd, has been confirmed to be capable of being grown by this conventional technique.34 Therefore, it is of interest to investigate the spectroscopic properties and laser behaviour of the Yb ion in such Lu-consisting solid solutions, in order to explore more promising Yb-ion laser crystals from rare-earth calcium oxyborates.
In this paper, we report on the crystal growth, spectroscopic properties, gain curve features, and efficient CW laser operation of Yb0.09Lu0.13Gd0.78Ca4O(BO3)3, a single crystal of (Yb, Lu, Gd) solid solutions of calcium oxyborates.
B. Crystal growth
The raw materials for crystal growth were chemicals Yb2O3, Lu2O3, Gd2O3, CaCO3, and H3BO3, all of which have of a purity of 99.99%. These chemicals were weighed in accordance with the stoichiometric ratio of Yb0.10Lu0.14Gd0.76Ca4O(BO3)3. An excess of 2% H3BO3 was added for the compensation of its evaporation. To prepare the polycrystalline material for crystal growth, a two-step solid-state reaction procedure was followed. The chemical equation for the reaction can be expressed as:| 0.10Yb2O3 + 0.14Lu2O3 + 0.76Gd2O3 + 8CaCO3 + 6H3BO3 → 2Yb0.10Lu0.14Gd0.76Ca4O(BO3)3 + 8CO2 + 9H2O | (1) |
The conventional Czochralski method was employed to grow the crystal. The polycrystalline material prepared was placed into an Ir crucible of 50 mm in diameter and 40 mm in height, and was melted in nitrogen atmosphere by 2.5 kHz frequency inductive heating. From the melt, the crystal was grown, with the help of a seed of Yb:GdCOB that was cut along its b crystallographic axis (3 mm × 3 mm × 20 mm), with a pulling rate of 0.8 mm h−1 and a rotation rate of 8 rpm. At the end of the growth process, the crystal was lifted out of the melt. It was then cooled slowly to room temperature in a time of 60 hours.
The grown crystal was transparent, with no visible defects or imperfections in it. The dimensions of the crystal were roughly Φ35 mm × 40 mm. Fig. 1 shows a picture of the crystal boule.
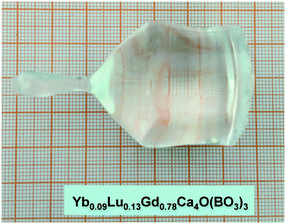 | ||
| Fig. 1 Picture of the boule of the Yb0.09Lu0.13Gd0.78Ca4O(BO3)3 crystal grown by the Czochralski method. | ||
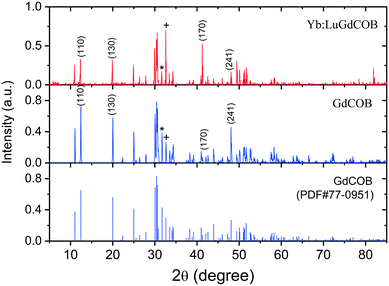
An X-ray powder diffraction (XRPD) pattern of the grown crystal is shown in Fig. 2, along with that of the GdCOB crystal. A close similarity is observed between the two patterns in the corresponding diffraction peak locations, confirming the same crystal structure possessed by the two oxyborate crystals, which belongs to the space group Cm (point group of m).1 The difference in the relative strength of diffraction of some specific lattice planes, which can be evidently recognized from Fig. 2 and are marked by their indices (the peak denoted by * corresponds to (240), while that denoted by + to (−221)), is attributed to the distinctive ionic electron density (or electronic charge density) arising from the substitution of the Yb or Lu ion for a Gd ion.
The composition of the crystal was measured by the use of X-ray photoelectron energy spectroscopy, and the chemical formula was determined as Yb0.09Lu0.13Gd0.78Ca4O(BO3)3 (the abbreviation Yb:LuGdCOB will be used in the text that follows). Taking into account the Yb ion concentration in the melt that was 10 at%, one can determine the segregation coefficient of Yb to be 0.9 in the crystal growth process. By the use of the crystal density that was measured to be 3.79 g cm−3, a value of 4.0 × 1020 cm−3 was calculated for the concentration of Yb ions in the crystal. The upper limit of Yb doping for the class YbtLuxGd1−t–xCa4O(BO3)3 has not been determined experimentally. This might depend on the Lu composition, which, for the undoped LuxGd1−xCa4O(BO3)3, is limited to x < 0.23.34 Given the result that the Yb doping level in GdCOB cannot exceed 27 at%,37 it seems to be not likely that the maximum Yb ion concentration of Yb:LuGdCOB can be higher than this value.
C. Spectroscopic properties
The monoclinic Yb:LuGdCOB crystal is optically biaxial, so three polarized spectra, with an optical electric field (E) along the X, Y, or Z principal optic axis, are required for the full characterization of its absorption or emission properties. To meet this requirement, the crystal samples with a square aperture of 3.0 mm × 3.0 mm and lengths of 1.0 or 5.0 mm, were prepared by cutting, respectively, along the X, Y, and Z principal axes. The two end faces of the samples were polished according to the standard for laser applications.1. Absorption spectra
With the 5.0 mm long crystal samples, polarized absorption spectra were measured at room temperature, in a wavelength range of 850–1150 nm by using a spectrophotometer. The results are shown in Fig. 3, represented by absorption cross-section (σabs) versus wavelength (λ). One sees that the absorption curve differs largely for different polarizations, suggesting the presence of strong anisotropy in the absorption behaviour of this crystal. Three significant absorption bands can be recognized, appearing at around the wavelengths of 902, 940, and 977 nm. The strongest, narrow absorption peak at about 977 nm is caused by the zero-phonon transition between the ground state (2F7/2) and the excited state (2F5/2) of the Yb ion. The peak cross-sections for E//X and for E//Y are almost equal, which were measured to be σabs = 1.90 × 10⁻²⁰ cm2 at 977.0 nm, while the value for E//Z amounts only to σabs = 1.10 × 10⁻²⁰ cm2 at 976.0 nm. A bandwidth of 2.4 nm (FWHM) was measured for E//Y. The zero-phonon transition is proven to be much stronger in Yb:LuGdCOB than in Yb:GdCOB, whose maximum cross-section is 1.15 × 10⁻²⁰ cm2.1 For the short-wavelength absorption band at around 902 nm, the absorption for E//Z is considerably stronger than that for E//X; this is also quite different from the case of Yb:GdCOB, where the absorption for these two polarizations appears to be nearly the same.1 For the weak absorption band in the intermediate region at around 940 nm, the strongest absorption occurs for E//X, and four peaks at 934.3, 939.4, 945.0, and 950.0 nm could be recognized; these features are very similar to those found for the Yb:GdCOB crystal.1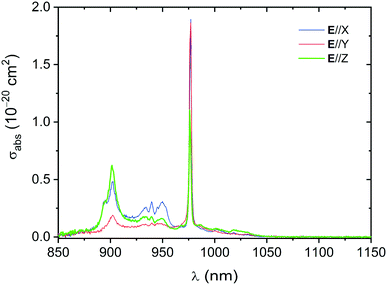 | ||
| Fig. 3 Polarized absorption cross-section as a function of wavelength measured at room temperature for the Yb:LuGdCOB crystal. | ||
2. Fluorescence spectra and lifetime
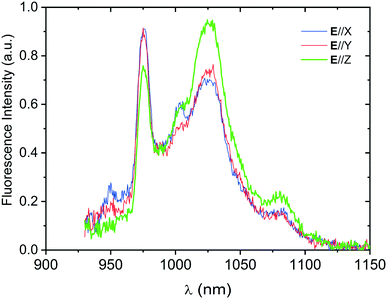
Polarized fluorescence spectra were measured using the 1.0 mm thick crystal samples, and the results are presented in Fig. 4. Besides the narrow emission band at about 976 nm resulting from the zero-phonon transition, there exists a strong broad emission band at around 1026 nm for each polarization. In addition to these two primary fluorescence bands, weak emission was also detected at shorter wavelengths around 950 nm and at longer wavelengths around 1082 nm. One sees that the fluorescence line-shapes for E//X and E//Y are very similar, but quite different from that for E//Z. It is also worth mentioning that the fluorescence line-shape cannot exactly represent the true emission spectrum; due to the presence of radiation trapping that is intrinsic for a quasi-three-level system such as the Yb ion, the fluorescence intensity, in particular for the zero-phonon transition, would be reduced greatly, leading to substantial distortions in the fluorescence profile.Fig. 5 shows the logarithmic time decay of the fluorescence, which was measured with a 1.0 mm thick crystal sample. The monitoring wavelength was chosen as 1030 nm. From the linear part of the decay curve, a fluorescence lifetime of 2.51 ms could be determined for the Yb:LuGdCOB crystal. One sees that the strict exponential decay of the fluorescence could be maintained over a time interval of at least three times the lifetime.
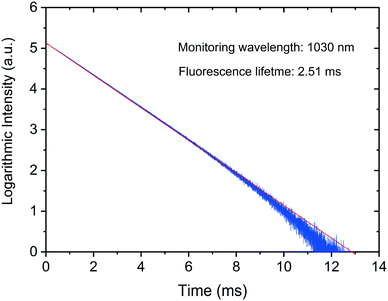 | ||
| Fig. 5 Logarithmic time decay of fluorescence, measured at room temperature for the Yb:LuGdCOB crystal. | ||
3. Emission spectra
Fig. 6 depicts the polarized emission cross-section (σem) spectra calculated from the absorption and the fluorescence spectra, by a combination of the integral method of reciprocity with the Füchtbauer–Ladenburg equation.35 In the calculation, the refractive index needed was obtained to be n ≈ 1.70, the average value for the Lu0.13Gd0.87Ca4O(BO3)3 crystal;36 whereas the radiative lifetime was assumed to be equal to the fluorescence lifetime: τrad = τf = 2.51 ms. As seen from Fig. 6 that for each polarization, the emission spectrum is characteristic of the strongest zero-phonon emission peak located at about 977 nm and a main emission band that extends over a wide range of about 1000–1060 nm. Similar to the situation of absorption, the emission cross-section of the zero- phonon transition, 1.55 × 10⁻²⁰ cm2 for E//X or 1.52 × 10⁻²⁰ cm2 for E//Y, turns out to be three or two times larger than the corresponding value for Yb:GdCOB.1 On the other hand, however, the maximum cross-section of the main emission band, σem = 0.32 × 10⁻²⁰ cm2 at 1027.8 nm for E//Z, is found to be considerably smaller than that for Yb:GdCOB, which amounts to 0.55 × 10⁻²⁰ cm2 at 1030 nm.1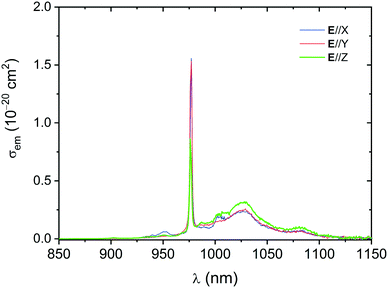 | ||
| Fig. 6 Polarized emission cross-section versus wavelength, determined for the Yb:LuGdCOB crystal by employing the integral method of reciprocity combined with the Füchtbauer–Ladenburg equation. | ||
It needs to be pointed out that this broad main emission band is proven to be the most important, because the actual laser action usually occurs in this band. Apart from the main emission band, the long-wavelength sideband at around 1082 nm is also of importance; lasing can take place in this spectral region under certain resonator conditions.
4. Gain curve features
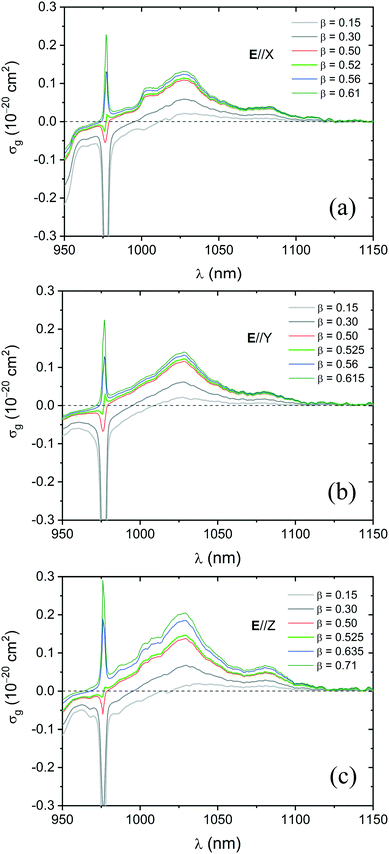
For a quasi-three-level laser material like Yb:LuGdCOB, the gain reached at a certain excitation level depends not only on the emission cross-section, but also on the absorption cross-section. The gain cross-section is defined as σg(λ) = βσem(λ) − (1 − β)σabs(λ), with β representing the excitation level, i.e., the fraction of Yb ions excited to the upper state or manifold (2F5/2). Given the magnitude of σg, the actual gain is G = σgNtl, where Nt is the Yb-ion concentration and l is the crystal length.Making use of the absorption and emission spectra shown in Fig. 3 and 6, one can calculate the gain curve σg(λ). Fig. 7 depicts the calculated polarized gain curves for a number of excitation levels. Evidently, only when σg(λ) > 0 could a positive laser gain be achieved at the wavelength λ. One notes that for usual excitation levels of β < 0.30, laser gain could be achieved only at wavelengths longer than about 1000 nm, with the maximum occurring within the main emission band. It can be seen that even under a rather high excitation of β = 0.50, the gain of the zero-phonon line still remains negative. However, a further slight increase in the excitation level would lead to a transition from a negative gain to a positive gain at the zero-phonon line, as can be clearly seen from the curves of β = 0.52 for E//X and β = 0.525 for E//Y or E//Z. It is also obvious that in excess of this “critical” level, the gain for the zero-phonon line could increase rapidly with the excitation level, becoming nearly the same as the maximum of the main emission band at β = 0.56 for E//X or E//Y and at β = 0.635 for E//Z. One sees that with further increasing excitation from β = 0.56 to β = 0.61 (0.615), the zero-phonon line gain would become considerably higher than that of the main emission band in the cases of E//X and E//Y. This means that zero-phonon line lasing is expected to occur in free-running laser operation, provided that an excitation level of β = 0.61 (0.615) is reached. In practice, such an excitation level seems to be not difficult to achieve in a short crystal, with a high-brightness diode laser as the pump source.
In comparison with the case of E//X or E//Y, for E//Z, the gain of the zero-phonon line increases more slowly with excitation; it remains lower than that for the main emission band unless the excitation level is raised to β = 0.635. Obviously, it is much more difficult, for E//Z, to realize the free-running laser action at the zero-phonon line.
The gain features revealed above for the Yb:LuGdCOB crystal turn out to be fairly different from those of Yb:GdCOB,1 for which the gain of the zero-phonon line becomes comparable to that of the main emission band, at an excitation level of roughly β = 0.75 for E//X; whereas for E//Z, this can only be achieved at β = 1, viz., with all of Yb ions excited to the upper manifold, which is, in principle, not possible under steady-state excitation conditions.
For comparison, we list in Table 1 the primary spectroscopic parameters relevant to the laser action for the Yb:LuGdCOB and Yb:GdCOB crystals. These include: λabs, the peak absorption wavelength of the strongest zero-phonon transition; σabs, the peak absorption cross-section; Δλabs, the absorption bandwidth; τf, the fluorescence lifetime; whereas λem, σem, and Δλg are the peak emission wavelength, the maximum emission cross-section, and the gain bandwidth of the main emission band, respectively.
In comparison with Yb:GdCOB, Yb:LuGdCOB possesses a smaller emission cross-section and thus a larger energy storage capacity (their fluorescence lifetime being equal), benefiting Q-switched laser operation for generating high-energy pulses. Besides this, one sees that the gain bandwidth for E//Z at high excitation levels, e.g., for β = 0.71 (Fig. 7c), amounts to 47 nm, is more than two times broader than for Yb:GdCOB at β = 0.75.1 This implies the superiority of this mixed crystal in the generation of ultra-short laser pulses by mode-locking.
D. Laser operation
Efficient CW laser operation of the Yb:LuGdCOB crystal was demonstrated in a plano-concave resonator. The crystal samples used were X-, Y-, or Z-cut 5 mm long, the same as in the measurement of absorption spectra. The laser resonator was formed with an a plane reflector and a concave output coupler having a radius-of-curvature of 25 mm. The reflector was coated for high reflectance (>99.8%) at 1020–1200 nm and for high transmittance (>95%) at 975 nm; while the concave coupler could be chosen to be at transmittances ranging from T = 1% to T = 10%, at wavelengths around 1030 nm. In order to excite the Yb:LuGdCOB crystal, a fibre-coupled (a fibre core diameter of 100 μm and an NA of 0.22) diode laser was utilized, which was capable of providing a maximum pump power of 30 W at 975.5 nm with a bandwidth of less than 0.5 nm.1. Laser performance of the Y-cut crystal
Efficient laser action was achieved with the output coupling of the resonator changing in a range of T = 1–10%. The output power measured for the Y-cut crystal under the conditions of T = 1%, 5%, and 10% is illustrated in Fig. 8 against the absorbed pump power (Pabs). The amount of Pabs is calculated from the incident pump power (Pin) according to Pabs = ηa0Pin, with ηa0 denoting the small-signal or unsaturated absorption efficiency, which was measured to be ηa0 = 0.76 for the 5 mm long Y-cut crystal.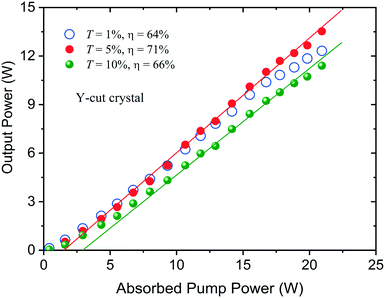 | ||
| Fig. 8 Output power versus absorbed pump power for T = 1%, 5%, and 10%, produced in laser operation achieved with the Y-cut crystal. | ||
One sees from Fig. 8 that for pumping levels lower than Pabs ≈ 10 W, the most efficient laser operation was obtained under the lowest output coupling of T = 1%; above this low pumping region, however, the optimal output coupling would increase to T = 5%, for which an output power of 13.53 W was generated at Pabs = 20.93 W, resulting in an optical-to-optical efficiency of 64.6%, while the slope efficiency was determined to be 71%. In the cases of T = 1% and T = 10%, the output power achievable at the highest pumping level amounted to 12.32 W and 11.40 W, with slope efficiencies being 64% and 66%, respectively. The laser radiation produced with the Y-cut crystal was found to be linearly polarized with E//Z, regardless of either the output coupling or the pumping level. This result is connected to the fact that for any excitation level, the gain for E//Z is always higher than that for E//X, as indicated in Fig. 7.
The lasing spectra measured at Pabs = 7.30 W for T = 1%, 5%, and 10% are presented in Fig. 9. The lasing spectrum was found to vary merely slightly with pump power, but dependent strongly on the output coupling of the resonator. One sees that the laser action in the case of T = 1% occurred around 1082 nm, within the long-wavelength sideband of the crystal. Under higher output couplings of T = 5% and T = 10%, the lasing wavelengths would shift to the region of the main emission band, since with the T increased, the excitation level required would become higher, making the gain maximum shift to the short-wavelength side (Fig. 7).
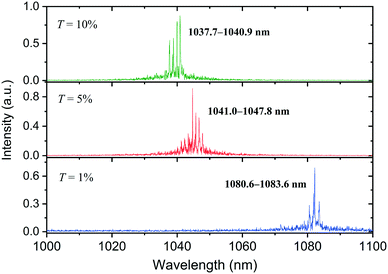 | ||
| Fig. 9 Lasing spectra for T = 1%, 5%, and 10%, measured at Pabs = 7.30 W for the laser operation of the Y-cut crystal. | ||
2. Laser performance of the X- and Z-cut crystals
Efficient laser operation was also realized with the X- or Z-cut crystal. The laser radiation generated with the X-cut crystal was linearly polarized with E//Z and vice versa. Fig. 10 shows the output power as a function of Pabs for the X- and Z-cut crystals, which was measured under the output coupling of T = 5%. Similar to the laser action of the Y-cut crystal, the optimal output coupling determined experimentally for the X- or Z-cut crystal is proven to be also T = 5%. However, the small-signal absorption efficiency measured for the X-cut crystal was ηa0 = 0.82, and for the Z-cut crystal was ηa0 = 0.81; both were larger than that for the Y-cut crystal.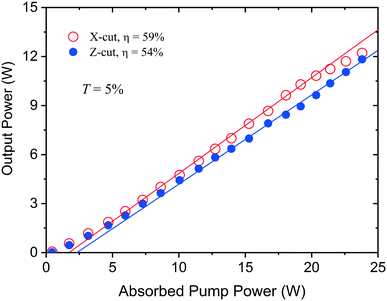 | ||
| Fig. 10 Output power versus absorbed pump power for T = 5%, produced in laser operation achieved with the X- and Z-cut crystals. | ||
One sees from Fig. 10 that at a certain pumping level, the output power produced with the X-cut crystal was somewhat higher than that attainable with the Z-cut crystal; the slope efficiency of laser operation for the former, 59%, was also higher than that for the latter (54%). The maximum output power, which was generated at the highest pump power of Pabs = 23.80 W, was measured to be 12.22 W for the X-cut crystal and 11.83 W for the Z-cut crystal. One can also notice that over the high pumping region in excess of Pabs ≈ 20 W, the laser action of the X-cut crystal became less efficient; by contrast, such a trend was not observed for the Z-cut crystal. This may suggest the superiority of the Z-cut crystal for laser operation in a still higher pumping region.
Fig. 11 shows the lasing spectra for the X- and Z-cut crystals, measured at a pump power of Pabs = 7.90 W under the output coupling of T = 5%. Both spectra fall within the main emission band of the Yb:LuGdCOB crystal, which is similar to the case of the Y-cut crystal. On the other hand, it is worth noticing that while the laser action occurred in a similar wavelength region (1040–1052 nm) for the X- and Y-cut crystals (Fig. 9), the lasing spectrum for the Z-cut crystal was found to cover a much narrower range, located at around a much shorter wavelength of 1033.5 nm. The physical reason for such a difference is clear: the lasing spectra for the X- and Y-cut crystals depend on the gain curve for E//Z, while for the Z-cut crystal, it is determined by the gain curve for E//X.
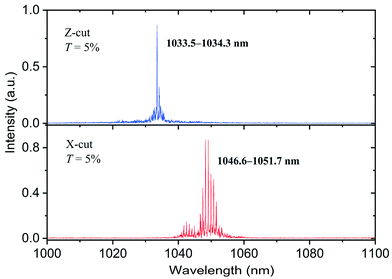 | ||
| Fig. 11 Lasing spectra measured at Pabs = 7.90 W in laser operation achieved under the output coupling of T = 5% with the X- and Z-cut crystals. | ||
Table 2 summarizes the main parameters characterizing the CW laser performance of the Yb:LuGdCOB crystal. To give a direct comparison, the results reported previously for Yb:GdCOB, which were achieved in an identical resonator under similar pumping conditions,9 are also presented in the table. The parameters include: Topt, the optimal output coupling; Pout, the maximum output power produced; ηopt, the optical conversion efficiency; ηs, the slope efficiency; λc, the central lasing wavelength.
One should first note that the optimal output coupling for the mixed crystal proved to be considerably lower than that for Yb:GdCOB, which resulted from its smaller emission or gain cross-section (the Yb ion concentrations for the two crystals being very close9). Differing from Yb:GdCOB for which the most efficient laser action was obtained with the Z-cut crystal, the Yb:LuGdCOB crystal was found to be lasing most efficiently with the Y-cut sample. Indeed, the highest output power achieved in the current experiment was lower than that produced with Yb:GdCOB. Nevertheless, the lasing efficiencies reached with the two crystals appear to be comparable. It is also worth noticing that at the same pumping level applied here with the Y-cut Yb:LuGdCOB crystal, Pabs ≈ 21 W, which is estimated to correspond to Pin ≈ 23 W for the X- or Z-cut Yb:GdCOB (Pin ≈ 25 W for the Y-cut one), the output power attainable with the crystals of Yb:GdCOB amounted at most to about 12.5 W (Fig. 3 of ref. 9), lower than that generated here with the Y-cut mixed crystal.
Our present work on the Yb:LuGdCOB mixed crystal indicates significant differences from its ordered Yb:GdCOB counterpart, in spectroscopic properties and in laser performance. Given the closeness between the trivalent Yb and Lu ions in atomic mass, electronic charge density, and ionic radius, it could be predicted that a mixed crystal of Yb:LuGdCOB with a higher composition of Lu should be more preferable. Of course, there may exist a certain upper limit imposed by the congruent melting of solid solutions. What is equally important is there also exists an optimal Yb-ion concentration for the Yb:LuGdCOB crystals, which can lead to the most efficient high-power laser operation. One sees that there is still much room for the development of more promising Yb-ion laser crystals from this class of (Lu, Gd) mixed oxyborates.
E. Conclusions
In summary, a new Yb-ion laser crystal, Yb0.09Lu0.13Gd0.78Ca4O(BO3)3, has been grown by the use of the Czochralski method, with large sizes and high optical quality. The polarized absorption and emission cross-section spectra were determined, with the maximum cross-section for the zero-phonon absorption and emission amounting to 1.90 × 10⁻²⁰ cm2 (E//X) and 1.55 × 10⁻²⁰ cm2 (E//X), respectively, which are proven to be considerably greater than those for the Yb:GdCOB crystal. An analysis of gain curves shows the advantages of this crystal over Yb:GdCOB in realizing laser operation at the zero-phonon line. Efficient CW laser action was achieved in the main emission band, producing an output power of 13.53 W with an optical-to-optical efficiency of 64.6%, and the slope efficiency being 71%. This investigation reveals the potential of this promising Yb-ion crystal in the development of solid-state lasers.Conflicts of interest
There are no conflicts of interest to declare.Acknowledgements
This work was supported by the National Natural Science Foundation of China (grant no. 11574170).Notes and references
- F. Mougel, K. Dardenne, G. Aka, A. Kahn-Harari and D. Vivien, J. Opt. Soc. Am. B, 1999, 16, 164 CrossRef CAS.
- A. Aron, G. Aka, B. Viana, A. Kahn-Harari, D. Vivien, F. Druon, F. Balembois, P. Georges, A. Brun, N. Lenain and M. Jacquet, Opt. Mater., 2001, 16, 181 CrossRef CAS.
- C. Kränkel, R. Peters, K. Petermann, P. Loiseau, G. Aka and G. Huber, J. Opt. Soc. Am. B, 2009, 26, 1310 CrossRef.
- Y. Liu, L. Wei, F. Yu, Z. Wang, Y. Zhao, S. Han, X. Zhao and X. Xu, CrystEngComm, 2013, 15, 6035 RSC.
- Y. Liu, F. Yu, Z. Wang, S. Hou, L. Yang, X. Xu and X. Zhao, CrystEngComm, 2014, 16, 7141 RSC.
- D. A. Hammons, J. M. Eichenholz, Q. Ye, B. H. T. Chai, L. Shah, R. E. Peale, M. Richardson and H. Qiu, Opt. Commun., 1998, 156, 327 CrossRef CAS.
- J. Liu, W. Han, X. Chen, Q. Dai, H. Yu and H. Zhang, IEEE J. Sel. Top. Quantum Electron., 2015, 21, 1600808 Search PubMed.
- P. Loiko, J. M. Serres, X. Mateos, H. Yu, H. Zhang, J. Liu, K. Yumashev, U. Griebner, V. Petrov, M. Aguiló and F. Díaz, IEEE Photonics J., 2016, 8, 1501312 Search PubMed.
- X. Chen, L. Wang, J. Liu, Y. Guo, W. Han, H. Xu, H. Yu and H. Zhang, Opt. Laser Technol., 2016, 79, 74 CrossRef CAS.
- Y. Ma, K. Tian, Y. Li, X. Dou, J. Yang, W. Han, H. Xu and J. Liu, Opt. Mater. Express, 2018, 8, 727 CrossRef CAS.
- J. Yang, Y. Ma, K. Tian, Y. Li, X. Dou, W. Han, H. Xu and J. Liu, Opt. Mater. Express, 2018, 8, 3146 CrossRef CAS.
- K. Tian, J. Yang, H. Yi, X. Dou, Y. Ma, Y. Li, W. Han and J. Liu, Opt. Laser Technol., 2019, 113, 1 CrossRef CAS.
- X. Chen, H. Xu, W. Han, Y. Yi, H. Yu, H. Zhang and J. Liu, Opt. Laser Technol., 2015, 70, 128 CrossRef CAS.
- X. Chen, H. Xu, Y. Guo, W. Han, H. Yu, H. Zhang and J. Liu, Appl. Opt., 2015, 54, 7142 CrossRef CAS PubMed.
- A. Yoshida, A. Schmidt, V. Petrov, C. Fiebig, G. Erbert, J. Liu, H. Zhang, J. Wang and U. Griebner, Opt. Lett., 2011, 36, 4425 CrossRef CAS PubMed.
- Z. Gao, J. Zhu, W. Tian, J. Wang, Z. Zhang, Z. Wei, H. Yu, H. Zhang and J. Wang, Opt. Lett., 2014, 39, 5870 CrossRef CAS PubMed.
- F. Khaled, P. Loiseau, G. Aka and L. Gheorghe, Opt. Lett., 2016, 41, 3607 CrossRef CAS PubMed.
- Q. Fang, D. Lu, H. Yu, H. Zhang and J. Wang, Opt. Lett., 2016, 41, 1002 CrossRef CAS PubMed.
- D. Lu, Q. Fang, X. Yu, X. Han, J. Wang, H. Yu and H. Zhang, Opt. Lett., 2019, 44, 5157 CrossRef CAS PubMed.
- Y. Zhang, Z. Lin, Z. Hu and G. Wang, J. Alloys Compd., 2005, 390, 194 CrossRef CAS.
- X. Chen, H. Xu, W. Han, L. Wang, J. Liu, H. Yu and H. Zhang, Opt. Mater., 2016, 55, 33 CrossRef CAS.
- D. Zhong, B. Teng, W. Kong, S. Ji, S. Zhang, J. Li, L. Cao, H. Jing and L. He, J. Alloys Compd., 2017, 692, 413 CrossRef CAS.
- Y. Ma, Y. Li, X. Dou, H. Yi, H. Xu, W. Han and J. Liu, Opt. Commun., 2018, 427, 244 CrossRef CAS.
- Y. Ji, J. Cao and C. Tu, Opt. Mater., 2013, 35, 2698 CrossRef CAS.
- Y. Li, M. Liu, W. Han, J. Chen and J. Liu, Opt. Commun., 2019, 451, 192 CrossRef CAS.
- Y. Li, Y. Xu, G. Xu, L. Dong, X. Dou and J. Liu, Infrared Phys. Technol., 2019, 99, 167 CrossRef CAS.
- Y. Li, M. Liu, J. Chen, L. Dong, J. Yang and J. Liu, Appl. Phys. B: Lasers Opt., 2019, 125, 131 CrossRef.
- J. Liu, W. Han, H. Zhang, X. Mateos and V. Petrov, IEEE J. Quantum Electron., 2009, 45, 807 CAS.
- J. Liu, X. Chen, W. Han, D. Zhong, S. Zhang and B. Teng, Opt. Mater. Express, 2015, 5, 2437 CrossRef CAS.
- J. Liu, L. Wang, W. Han, H. Xu, D. Zhong and B. Teng, Opt. Mater., 2016, 60, 114 CrossRef CAS.
- L. Wang, X. Dou, W. Han, H. Xu, D. Zhong, B. Teng and J. Liu, Opt. Mater. Express, 2017, 7, 1048 CrossRef CAS.
- J. Liu, V. Petrov, X. Mateos, H. Zhang and J. Wang, Opt. Lett., 2007, 32, 2016 CrossRef CAS PubMed.
- R. Möckel, C. Routher and G. Götze, J. Cryst. Growth, 2013, 371, 70 CrossRef.
- L. Gheorghe, P. Loiseau, G. Aka and V. Lupei, J. Cryst. Growth, 2006, 294, 442 CrossRef CAS.
- A. S. Yasyukevich, V. G. Shcherbitskii, V. E. Kisel, A. V. Mandrik and N. V. Kuleshov, J. Appl. Spectrosc., 2004, 71, 202 CrossRef CAS.
- L. Gheorghe, V. Lupei, P. Loiseau, G. Aka and T. Taira, J. Opt. Soc. Am. B, 2006, 23, 1630 CrossRef CAS.
- F. Druon, F. Augé, F. Balembois, P. Georges, A. Brun, A. Aron, F. Mougel, G. Aka and D. Vivien, J. Opt. Soc. Am. B, 2000, 17, 18 CrossRef CAS.
| This journal is © The Royal Society of Chemistry 2020 |

