 Open Access Article
Creative Commons Attribution 3.0 Unported Licence
Understanding benzyl alcohol aggregation by chiral modification: the pairing step†
Robert
Medel
 and
Martin A.
Suhm
 *
*
Institute of Physical Chemistry, University of Goettingen, Tammannstr. 6, 37077 Goettingen, Germany. E-mail: msuhm@gwdg.de
First published on 23rd October 2020
Abstract
A combination of linear infrared and Raman spectroscopy in supersonic slit jet expansions is used to clarify the conformational preferences in the dimer of the transiently chiral benzyl alcohol (phenylmethanol) under vacuum isolation. By experimentally exploring close analogies with the permanently chiral 1-phenylethanol, which is conformationally locked in the jet through intramolecular chirality induction, and by computational analysis of their conformational energy landscapes, several conclusions are drawn. The lowest energy dimer is confirmed to be cooperatively OH⋯OH⋯π-bonded and shown to be homochiral. Its heterochiral counterpart is slightly higher in energy and can be spectrally assigned as a minor constituent. A metastable heterochiral OH⋯π/OH⋯π structure with weakly coupled hydrogen bonds is efficiently trapped behind a Ci symmetry-enhanced barrier and can be assigned by IR/Raman mutual exclusion. Its homochiral counterpart is kinetically less stable but might be addressed by rotational spectroscopy. Ratings of standard density functionals with a standard basis set in terms of reproducing these experimental chirality synchronization benchmarks are presented.
1 Introduction
When two entities of a transiently chiral molecule form a non-covalent dimer, they will have an energetical preference for either homo- (hom) or heterochiral (het) pairing – they synchronize their chirality in one way or the other. If this preference can be experimentally observed, it provides a sensitive test for the ability of quantum-chemical methods to describe subtle macroscopic phenomena such as Viedma ripening,1 chirality induced spin-selectivity,2 liquid crystal organization3 or conglomerate crystallization in general.4 To reduce complexity, it makes sense to investigate the phenomenon of intermolecular chirality synchronization in the gas phase,5 looking at small clusters. As the driving force for chirality synchronization in such a cluster can be quite small, low temperatures, as they are achievable in supersonic jet expansions, are indicated. However, at low temperature, the interconversion barriers between enantiomeric conformers quickly become insurmountable and statistical dimer formation prevails.6 The relative energy information is then hidden on the experimental side. The goal is thus to find molecular systems where these barriers are sufficiently transmissive, such that subtle chirodiastaltic energies7 can still be detected and used for experimental benchmarking. Furthermore, one needs aggregation-sensitive chromophors for spectroscopic detection. In the field of vibrational spectroscopy, the OH group fulfills both requirements due to its partially tunneling-assisted conformational flexibility and pronounced hydrogen bond shifts. Elementary alcoholic examples of chirality synchronization are the dimers of ethanol,8,9 of trifluoroethanol,10,11 and of benzyl alcohol.12,13 Benzyl alcohol (B, Fig. 1) is among the most interesting transiently chiral alcohols. In contrast to ethanol,14 it clearly favors a chiral ground state conformation. This actually involves the intramolecular synchronization of two adjacent, strongly coupled conformational degrees of freedom (circular arrows in Fig. 1). In contrast to trifluoroethanol, B offers alternative aggregation into symmetric dimers, because its π system can compete with the OH group as a hydrogen bond acceptor. Depending on the relative chirality of the monomers, C2 or Ci symmetry can be realized in the hom and het dimers, respectively. These symmetrical aggregates compete with unsymmetric complexes on the basis of OH⋯OH hydrogen bonds. This question of symmetry for dimers of B has already been discussed 80 years ago15 based on solution phase IR measurements. The spectral distinction of these dimer structures in the present work profits from the combination of IR and Raman spectroscopy in supersonic jets, also exploiting the rule of mutual exclusion. | ||
| Fig. 1 Two-dimensional structural formulas, names, abbrevations, atom labeling and main conformational degrees of freedoms of the molecules investigated in this work. | ||
Aromatic alcohols allow for a large repertoire of vibrational spectroscopy techniques, with size- and conformationally selective UV/IR double resonance techniques featuring prominently. Indeed, a dimer of B was observed two decades ago16,17 using such techniques and identified after correction12 of an initial size assignment. Chirality synchronization was not discussed at the time, but the spectra were illustrated with unsymmetric het dimers.12
Here, we use linear FTIR spectroscopy and spontaneous Raman scattering, which offer nicely complementary viewpoints on the dimer as well as relative abundances of different isomers. Their disadvantage of reduced sensitivity is compensated by long, pulsed slit nozzles (FTIR6,18) and powerful lasers (Raman6). The lack of size selectivity is compensated by concentration variation and conformational discrimination is facilitated by the sensitivity of the OH chromophore to subtle interaction details. Our study builds on a preliminary investigation, which only involved FTIR spectroscopy13 and which implied unsymmetric hom dimers for the dominant signals from the UV/IR studies, although the het counterparts were only predicted slightly higher in energy and similar in their spectra.19 At the time, evidently neither UV/IR nor FTIR studies were able to rigorously discriminate between unsymmetric hom and het dimers of B. A new finding of the FTIR study13 was the observation of a less downshifted OH stretching band, which was attributed to a symmetric dimer. Again, the relative chirality and thus the C2 or Ci symmetry of this dimer had to remain open.
The dimer conformational landscape of benzyl alcohol is the main goal of the present contribution. It is considerably more complex than that of phenol dimer.20 To disentangle its details, it is advantageous to chemically freeze the transient chirality of B without introducing major perturbations in the dimer contact areas. This leads to 1-phenylethanol (P, Fig. 1), which is a well-studied component of mixed dimers,21–28 whereas its self-aggregation appears to have remained unexplored in supersonic jet expansions. The extra methyl group, which introduces a permanent chirality center in Cα-position, leads to subtle but systematic modulations in the dimer energy landscape and allows to distinguish hom from het dimers. This strengthens the conclusions about benzyl alcohol dimerization and reveals chirality-sensitive relaxation paths during the dimerization process. Such chirality-dependent trapping of metastable isomers could be of mechanistic relevance for kinetically controlled enantioselective processes, also in solution. However, an experimental and computational study of P in solution suggests that the condensed phase is not the right starting point, even more so if dispersion corrections are neglected.29 This will become evident from the present results.
Beyond the question of whether hom or het pairings are preferred in the dimers of B and P and which hydrogen bond topology they exhibit, the lowering or raising of the racemization barrier in B by dimerization will be investigated. In the analogous aggregation study of transiently chiral 1,2-ethanediol and its chirality-controllable 1,2-cyclohexanediol homolog,6 the barrier was found to be lowered significantly,30 but not enough to prevent largely statistical hom/het dimer formation in a jet expansion. In monomeric B, the barrier is an order of magnitude lower, providing a better starting point for chirality synchronization. In combination with its conformational uniformity at low temperatures, the dimerization process of B is thus a rewarding research objective.
Spectroscopic evidence for chirality-sensitive B and P oligomerization beyond pairing will only be addressed briefly to discriminate against dimer signals. Ultimately, such oligomers can be further discussed in the context of conglomerate formation for macroscopic B crystals,31 which consist of homochiral chains of cooperative OH⋯O hydrogen bonds. The subtlety of this preference is illustrated by the thiol homolog of B, where heterochiral dimer units with two isolated SH⋯π contacts are present.31 The crystal structure and ee-dependent phase diagram of P is so far unknown, but would be of considerable interest. Is it a conglomerate former like B? Here, we provide the most elementary molecular entry point for the understanding of such macroscopic self-organisation phenomena.
2 Methods
2.1 Experimental techniques
At 24 °C a gas mixture with estimated molar fractions of 0.02% of either racemic (98.5%, Fluka) or enantiopure P (99.6%, 99.6% ee, (−)-(S)-enantiomer, Sigma Aldrich) in helium (99.996%, Linde) was prepared and expanded at 1.20 bar and room temperature through a (600 × 0.2) mm2 slit nozzle18 into vacuum. The pulsed supersonic expansion was probed by about 500 (racemic) or 200 (enantiopure) averaged synchronized FTIR scans at 2 cm−1 resolution with a Bruker IFS 66 v/S spectrometer (single-sided-fast-return mode). For the less volatile B (99%, Alfa Aesar) a different heated setup was used with the compound at 70 °C (estimated molar fraction of 0.2% in He). The pulsed expansion of the mixture at 1.5 bar through a slightly angled (60 × 0.2) mm2 slit nozzle6 at 90 °C was probed by about 300 averaged synchronized FTIR scans at 2 cm−1 resolution with a Bruker IFS 66 v/S spectrometer (double-sided-fast-return mode).For the Raman spectra32 of B, as well as of enantiopure and racemic P (99.5%, Aldrich), gas mixtures were prepared with the compounds at 50 °C (estimated 0.05% and 0.13% molar fractions in He for B und P, respectively). The continuous expansion of the gas mixture at 1.0 bar through a (4 × 0.15) mm2 slit nozzle at 60 °C was probed at 2 mm distance by a Spectra Physics Millenia eV laser (532 nm, cw, 25 W). The scattered light was collected perpendicular to the laser and the nozzle flow via a camera lens and focused onto a one meter monochromator (McPherson). Photons from Stokes Raman scattering were co-added by a LN2-cooled CCD-camera (Princeton, PyLoN 400) over 3 min exposure time and averaged over 20 repetitions. The combination of laser and monochromator results in a resolution of about 1 cm−1. The spectra were calibrated with neon vacuum transitions. We assume band positions to be accurate up to ±1 cm−1 and their differences up to ±2 cm−1 in both FTIR and Raman spectra. The absence of optical rotation for the racemic samples was checked by polarimetry.
2.2 Computational techniques
All computations were carried out with the Gaussian 09 Rev. E.0133 program package, except those for B2PLYP-D3 for which due to technical reasons partly also Gaussian 16 Rev. A.03 was used (the agreement of the results from both program versions was checked). Initial searches for minima and transitions states were conducted with the B3LYP34–37 functional together with Grimmes D3 correction with two-body terms and Becke–Johnson damping38 and the def2-TZVP basis set.39 This choice is based on previous performance for systems with chirality recognition.6,28 Results were reoptimized with the larger minimally augmented may-cc-pVTZ basis set40 and complemented by B2PLYP-D341 (also with two-body terms and BJ-damping), ωB97X-D42 and M06-2X43 functional results, also using may-cc-pVTZ. Specification of the basis set is therefore omitted hereafter. The ultrafine integration grid and verytight convergence criteria for monomers respectively tight for dimers were used. No density fitting was applied. The Hessian was evaluated within the double-harmonic approximation. Minima were confirmed by the absence, and transition states by the presence of exactly one imaginary frequency. The respective negative curvature coordinate was visualized to confirm the character of the transition states. The calculation of Raman activities at B2PLYP-D3 level proved to be unaffordable for systems of this size. All used keywords are listed in the ESI.†The dimer conformations reported in this work build on previous work13 for B and are based on systematic and extensive manual searches which are expected to capture all relevant structures for a supersonic jet expansion and many more which will only contribute at higher temperatures.
2.3 Comparison between experiment and theory
While the applied harmonic approximation strongly overestimates wavenumbers of OH stretching transitions, a better agreement with experiment can be achieved if differences between transitions for hydroxy groups in similar environments are compared. The neglected anharmonicity and other systematic errors are then expected to largely cancel out, especially if only the relative chirality of the involved molecules in a dimer motif is switched, as we have explored in a previous study.28 With a reliable anharmonic treatment out of reach for this system size, comparing data for related systems helps to understand whether deviations are systematic or erratic for assignment purposes.The unsymmetric dimers of B and P feature two hydroxy groups involved in hydrogen bonds, with a π and an oxygen acceptor, respectively. These lead to two transitions in the OH stretching region with substantial IR as well as Raman activity, whose measured relative intensities can be compared with predictions. Experimental relative intensities and their uncertainties are evaluated by integration with a Monte Carlo approach44 which accounts for ambiguity from integration width and noise level.
Theoretical IR band strengths were taken directly from the computational results, while calculated Raman activities and depolarisation ratios were converted to scattering cross sections. Accounted for are the polarisation dependent sensitivity of monochromator and camera, the laser wavelength and partial thermal vibrational excitation. This is detailed in the ESI.†
Relative band intensities from different conformers are in addition dependent on their population ratio and thus, assuming a Boltzmann distribution, strongly on their energy difference and the conformational freezing temperature45Tc. The latter is in a supersonic expansion partially barrier dependent and can only be roughly estimated, unless8 the energy gap is experimentally well determined by other means.14 Calculation of this quantity by eqn (1) combines experimental intensity ratios Ii/Ij for two isomers i and j with the computed vibrational zero-point corrected energy difference E0j − E0i, theoretical IR band strength or Raman cross section ratios σj/σi, and ratios of chiral degeneracies gj/gi as well as of rotational symmetry numbers si/sj.
 | (1) |
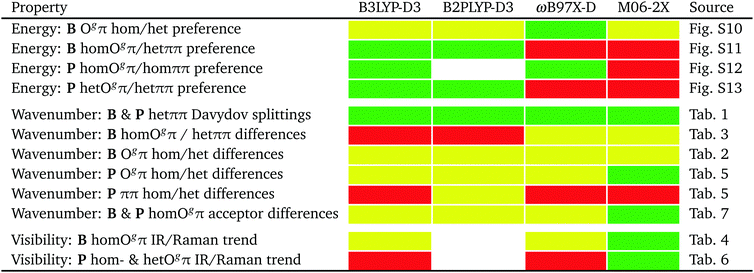
The performance of the employed harmonic DFT methods to predict the relative energy, OH stretching wavenumbers and spectral visibility of isomers will be summarized in Fig. 12 in the conclusion.
3 Results and discussion
3.1 Computational results
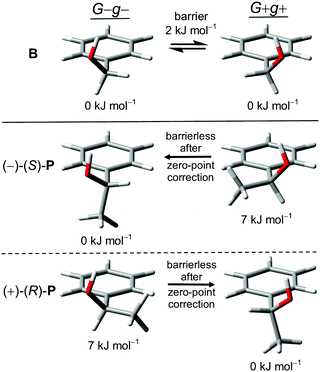 | ||
| Fig. 2 G−g− and G+g+ monomer conformers of B, (−)-(S)-P and (+)-(R)-P with relative zero-point corrected energies and interconversion barriers at B3LYP-D3 level. | ||
The additional methyl group at the α-carbon in P acts as a conformational anchor for the relative stabilization of one of the Gg conformations depending on the chirality of the stereogenic center: G−g− for (−)-(S)-P and G+g+ for (+)-(R)-P. In comparison to B the absolute value of the OCαCipsoCortho-dihedral is predicted to be slightly lowered (from 55° to 43°) due to competition with the preference of the methyl group for a position perpendicular to the plane of the phenyl ring, as observed in ethylbenzene.59 In contrast, the other Gg arrangement with the signs of the dihedrals opposite to the standard optical rotation of the enantiomer is moved up in energy by about 7 kJ mol−1 due to a far less favorable positioning of the methyl group relative to the phenyl ring (Fig. 2). This is a case of intramolecular chirality induction.5
Besides a high energy Et-conformer similar to B, we located two additional minima on the electronic potential surface which were not mentioned in previous computational investigations of P.24,29,49,60,61 They are also very high in energy (6–7 kJ mol−1) and have vanishing relaxation barriers after vibrational zero-point correction. Structures and properties of the higher energetic conformers of B and P are given in the ESI.†P is thus a rare case of a permanently chiral alcohol with one dominant conformer, while most occur in multiple energetically close conformations due to the low symmetry of the HOCαCβ torsional potential.28,62
In conclusion, B is expected to occur as a 1![[thin space (1/6-em)]](https://www.rsc.org/images/entities/char_2009.gif) :
:![[thin space (1/6-em)]](https://www.rsc.org/images/entities/char_2009.gif) 1-mixture of two rapidly interconverting transiently chiral conformers, whereas the ratio of the analogous permanently chiral conformers of P can be controlled by the enantiomeric excess of the sample.
1-mixture of two rapidly interconverting transiently chiral conformers, whereas the ratio of the analogous permanently chiral conformers of P can be controlled by the enantiomeric excess of the sample.
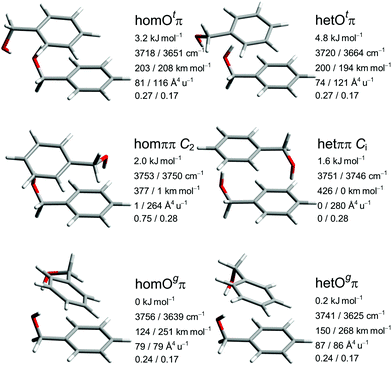
The five most stable B dimer structures and the het equivalent to the least stable of them are shown and characterized in Fig. 3, with consistent configuration (G−g−) and orientation of the OH⋯π hydrogen bond donor to illustrate differences in the interaction with the second molecule. The pairwise hom/het analogy also applies to many higher-lying conformations described in the ESI† and confirms the suitability of this system for chirality synchronization studies. The predicted chirodiastaltic energy varies in sign and size among the motifs and is of the same order of magnitude as the racemization barrier.
The most stable structural motif Ogπ features cooperatively interacting OH⋯OH⋯π hydrogen bonds and is reminiscent of the global minimum of the propargyl alcohol dimer.63,64 The het variant is slightly less stable despite somewhat stronger hydrogen bonds (based on predicted downshifts and intensity enhancements), indicating a compensating role of dispersion interactions. The motif with the alternative lone pair coordination Otπ is not energetically competitive for B but still included, because it gains importance for P and helps to understand relaxation paths. Otπ offers a stronger OH⋯π interaction at the expense of the OH⋯O hydrogen bond, judging by the downshift. The resulting smaller difference in wavenumber of the OH-oscillators leads to a limited coupling between them, transferring IR intensity to the higher-frequency (partially antisymmetric) and Raman intensity to the lower-frequency (partially symmetric) mode.
The two unsymmetric Oπ motifs energetically sandwich the symmetric ππ motif with two isolated, non-cooperative OH⋯π hydrogen bonds. Depending on the relative chirality of the monomers, a two-fold rotation axis (hom) or an inversion center (het) emerges and generates mutual (quasi-)exclusion of IR and Raman intensity as well as a small (so called Davydov or vibrational exciton65) splitting between the two states which depends on the coupling between the degenerate monomer modes. Spectrally, this increases their visibility, whereas statistically (due to the symmetry number in the rotational partition function for hom, and achirality for het) and energetically the symmetric structures have a handicap. We note that the hetππ variant is realized in the crystal structure of the thiol analog31 of B. In the gas phase, there are also cases where the symmetric dimer motif wins, such as lactates,66 glycidol67 and glycolaldehyde.68 This is a consequence of the better acceptor strength of O compared to π in these molecules. It is already remarkable that ππ can be observed at all at low temperature in competition to OH⋯OH⋯π arrangements for B.13
To better understand the population of different hydrogen bonding motifs under jet conditions, it is important to analyze barriers separating them. Fig. 4 shows the connections between the three structural motifs for both relative chiralities. The indicated barrier heights refer to the downhill transition and include harmonic zero-point energy of all modes with real, positive wavenumber. As a rule of thumb, 4–5 kJ mol−1 represent a rough border between facile (green) and difficult (red) interconversion under supersonic jet conditions.69 We cannot strictly exclude lower, more complex interconversion paths involving concerted changes of hydrogen bond topology and transient chirality, but believe that the network depicted in Fig. 4 is representative.
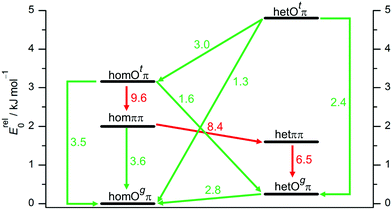 | ||
| Fig. 4 Interconversion paths between B dimer structures including downhill barriers in kJ mol−1 at B3LYP-D3 level which are more (green) or less (red) feasible under supersonic jet expansion conditions. Transition structures are given in the ESI.† | ||
The lone pair switch between the Otπ and Ogπ motifs is predicted with moderate barriers of 2.4 and 3.5 kJ mol−1 and should be feasible for both transient diastereomers. A chirality switch at the acceptor molecule in an OH⋯O hydrogen bond interconverts the g or t character of its lone pairs. This coupled relative chirality and binding motif conversion only needs to overcome a barrier of 1.3 or 1.6 kJ mol−1, depending on whether it leads to or away from homochirality, respectively. Compared to the monomer value of 2.0 kJ mol−1, this corresponds to a certain enhancement of the transient character of chirality in B upon coordination of the t lone pair. In a subtle sense, Otπ structures may be viewed as catalysts for chirality inversion. In contrast, the interconversion of a donor of an OH⋯O hydrogen bond is perhaps somewhat decelerated by an increased barrier in the 2.8–3.0 kJ mol−1 range (Fig. 4).
The ππ motif behaves very differently. It features a much higher hom-to-het interconversion barrier (8.4 kJ mol−1), because symmetric dimerization guides both absolute OCαCipsoCortho backbone torsion angles further away from the 90° transition state value, from the monomer value of 55° to only 17° for hetππ and to 31° for homππ, respectively. This adaptive aggregation is driven by the minimization of the distance between the two monomers, which is disrupted in the transition state and therefore discourages racemization. It also provides a geometrical explanation why hetππ is somewhat more stable than homππ. An alternative racemization path with opposite torsion direction is already quite unattractive for the monomer and even more so for the symmetric dimers.
As direct chirality synchronization within the ππ motif is difficult under supersonic jet conditions, it is important to analyze the barriers separating them from Oπ structures. This requires an acceptor switch from the π system of the phenyl ring to a lone pair of the oxygen and thus a rather pronounced relative rotation of the two monomers, to bring the two hydroxy groups into close neighborhood. This trajectory can be described by the  intermolecular torsion angle, which was systematically scanned to locate the transition states. Starting at homππ, the two scan directions are not equivalent. One of them ultimately leads downhill over a 3.6 kJ mol−1 barrier to homOgπ, the other one uphill over a much higher 10.7 kJ mol−1 barrier involving a broken hydrogen bond, because the distance between the system and the targeted Ot lone pair is quite large. Basically, this means that homππ is expected to relax rather smoothly into the global minimum structure.
The situation for hetππ is different. Due to its inversion symmetry, both torsional directions are equivalent and lead to hetOgπ, over a barrier of 6.5 kJ mol−1. One possible explanation is that the donor OCαCipsoCortho torsion associated with the het isomerization spans a larger range (17 to 65°) than in the hom case (31 to 44°). In addition this trajectory also involves a larger torsion of both molecules with respect to each other along the  dihedral, which translates not only in a higher but also broader barrier. In any case, hetππ relaxation appears to be much more difficult than homππ relaxation.
In summary, all important B dimer structures are predicted to have feasible relaxation paths into lower energetic structures, except for hetππ and of course the global minimum homOgπ. This will be important when interpreting the experimental spectra.
Trimers of B are beyond the scope of the present study, apart from the need to discriminate dimer signals in the non-selective linear spectra from trimer contributions. Here it suffices to note that they show interesting isomerism similar to that in 1-indanol trimers,70 namely reduced ring strain by switching from cyclic OOO motifs to OOπ structures. This optional symmetry breaking leads to complex spectra which will be the topic of a separate study.
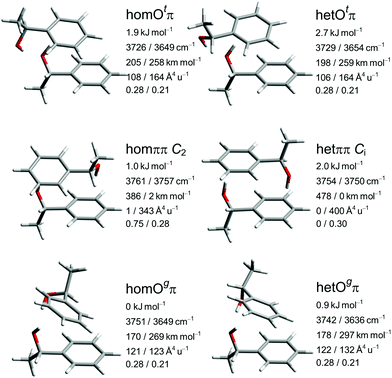
The close similarity of P dimers to their B counterparts (Fig. 3) is illustrated in Fig. 5, which lists the six most stable conformations together with their most important OH-vibrational properties. Higher energy structures and their nomenclature are discussed in the ESI.†
This similarity results from the fact that in all six cases the additional methyl group points away from the contact zone between the monomers. Indirect effects of this methyl group on the intramolecular torsion potential, on the polarization of the OH group and on the total dispersion interaction lead to modulations of the energetical spacings. The permanent chirality center introduced by this methyl group blocks the interconversion between the most stable hom and het dimers, because it effectively anchors the preferred handedness of the transient chirality elements which P shares with B, as explained in the preceding subsection. Therefore, the enantiomeric composition of P controls the abundance of hetOgπ through intramolecular chirality induction without the risk of relaxing to homOgπ. This allows for hom/het assignments of P dimer signals which can be transferred to B with the help of harmonic spectral predictions, because theoretical deficiencies such as neglected anharmonicity should largely cancel between P and B. The same strategy can be used to spectrally differentiate homπ from hetππ. In terms of hom/het chirodiastaltic energy, the three most stable P dimer motifs have a clear preference for the hom pairing. Compared to B this means a switch in the energetic order of hom- and hetππ, which can be attributed to the smaller intramolecular flexibility of P in the OCαCipsoCortho dihedral. This dihedral is especially far from its monomeric value in hetππ as discussed before for B. Our spectroscopic techniques do not allow for an experimental verification of this energetic prediction due to the blocked interconversion. This would require experimental bond dissociation measurements.71,72 Another difference between P and B dimers is the significant energetical lowering of the Otπ motif for P, which is founded in comparable little deformation needed for the P monomer to adapt for this motif. This might allow detection in a supersonic jet expansion.
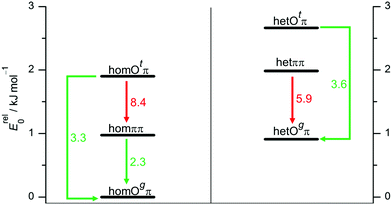
The lowest predicted interconversion barriers for P dimers are shown in Fig. 6. Again, there is a close analogy to B. Despite the blocked hom/het interconversion options, all excited conformers but hetππ are predicted to have feasible relaxation options to lower structures. This rather close parallel between predicted dimerization preferences for B and P sets the stage for a consistent interpretation of their dimer signals in supersonic jet spectra.
3.2 Experimental results
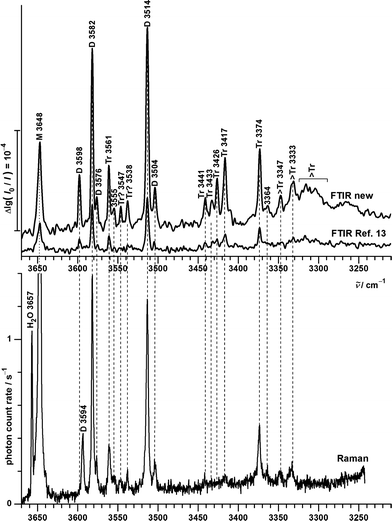 | ||
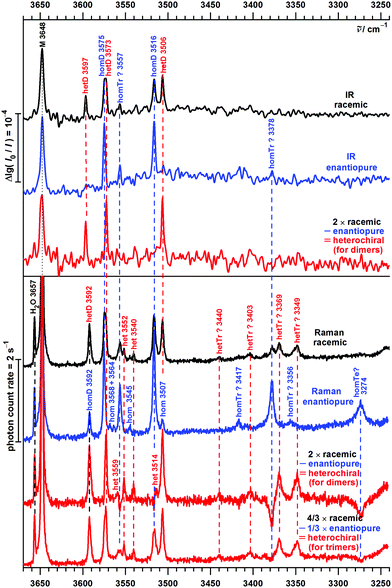
| Fig. 7 OH stretching spectra of B seeded in helium from FTIR (upper traces, comparing new73 (courtesy of M. Lange and E. Sennert) to published measurements13) and Raman (lowest trace, this work) spectroscopy. Cluster size assignments (M = monomers, D = dimers, Tr = trimers, >Tr = larger clusters according to previous13 and this work) are labeled together with the wavenumbers of the band maxima. | ||
The lowest trace shows a new heated nozzle Raman spectrum recorded 2 mm downstream from the nozzle, which also reveals cluster signals. Not yet reported bands common to the FTIR and Raman spectra are found at 3576, 3555 and 3364 cm−1. The band at 3504 cm−1 was previously interpreted cautiously because of overlap with a possible impurity,13 but is now seen to be also due to B dimers.
Most importantly, a Raman band without FTIR counterpart is observed at 3594 cm−1, whereas the FTIR band at 3598 cm−1 is completely missing in the Raman trace. This proves the previous tentative assignment of the FTIR band to a symmetric ππ dimer.13 The two bands with complementary IR and Raman intensity are Davydov-split by 4 cm−1 and they are quite narrow, such that a dominant assignment to either hom- or hetππ dimer is more likely than an accidental double coincidence.
Bands marked Tr and >Tr due to their different scaling behaviour do not behave systematically in the IR/Raman comparison. Some are significant in both spectral traces, others (in particular around 3430 cm−1) are very weak in the Raman spectrum, pointing at some symmetry effects. However, a closer analysis and extension of the frequency range will be needed for a detailed oligomer assignment and the following discussion thus focuses on the dimer range spanning 3600–3500 cm−1.
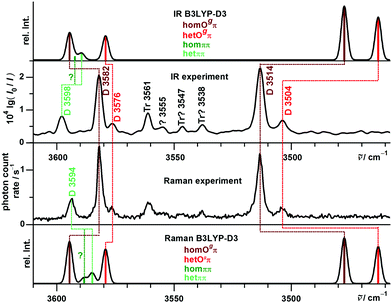
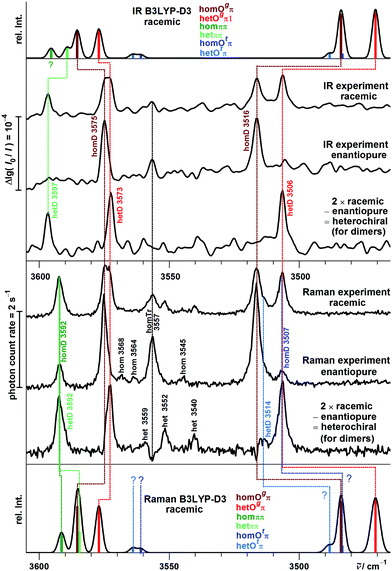
Fig. 8 compares the experimental spectra with harmonic B3LYP-D3 simulations, which are uniformly shifted to match the B monomer transition. Any deviations must be blamed on deficiencies of the density functional and on changes in the anharmonicity of the OH stretching mode upon aggregation.
The experimental Davydov splitting of 4 cm−1 between the 3598/3594 cm−1 bands would be consistent with predictions for homππ (4.0 cm−1) as well as hetππ (4.6 cm−1). We favor the het dimer as the main contributor, because it is predominantly predicted to be more stable (except by the M06-2X prediction, see Table 1) and slightly more visible, and most importantly more hindered from relaxation by a significantly larger barrier. This will be confirmed later on by the experimental P analogy. It is typical that the underlying isolated OH⋯π downshifts are slightly overestimated by harmonic B3LYP-D3 calculations (Table 1).74 Whether there is also a minor overlapping contribution by homππ surviving the expansion might be resolvable by rotational spectroscopy (predicted dipole moment of 2 D), while hetππ is transparent due to the missing dipole moment.
![[small nu, Greek, tilde]](https://www.rsc.org/images/entities/i_char_e0e1.gif) (ω) relative to the Gg monomer at different harmonic levels in comparison with experiment
(ω) relative to the Gg monomer at different harmonic levels in comparison with experiment
| Method | ΔE0/kJ mol−1 | −Δ![[small nu, Greek, tilde]](https://www.rsc.org/images/entities/i_char_e0e1.gif) (ω) hom/cm−1 (ω) hom/cm−1 |
−Δ![[small nu, Greek, tilde]](https://www.rsc.org/images/entities/i_char_e0e1.gif) (ω) het/cm−1 (ω) het/cm−1 |
|---|---|---|---|
| Experiment | ? | 50(2)/54(2) | |
| B3LYP-D3 | 0.4 | 56/59 | 58/63 |
| B2PLYP-D3 | 0.3 | 55/59 | 56/60 |
| ωB97X-D | 1.4 | 45/49 | 47/51 |
| M06-2X | −0.5 | 31/35 | 30/35 |
With R2PI spectroscopy a number of signals were reported in the dimer mass channel, but due to spectral congestion only one conformer could be analyzed in the IR region with absorption at 3584 and 3515 cm−1.12 These signals are confirmed in this work at 3582 and 3514 cm−1 in both FTIR and Raman spectra. Assignment to one of the unsymmetric B dimers is not unambiguous. The single strong pair of bands is in contrast to the B3LYP-D3 and B2PLYP-D3 predictions for the hom- und hetOgπ dimers to be nearly isoenergetic (Table 2). For the predicted low barrier, there should be an equilibrium of both structures in the jet expansion down to low temperature. Most likely, the energy difference is actually larger, because none of the calculations predicts a perfect spectral overlap for the two isomers. All investigated computational methods agree in predicting homOgπ to be more stable and less downshifted than hetOgπ. Therefore, the strong pair of bands is assigned to homOπ and one expects smaller satellites due to hetOgπ towards lower wavenumber. One candidate at 3504 cm−1 has been postulated before19 and would match the theoretical predictions for the OH⋯O vibration acceptably well (Table 2). For the OH⋯π component, we propose the new satellite band at 3576 cm−1, although the hom − het shift is predicted to be larger than the one for the OH⋯O mode (Table 2). Therefore, alternative assignments such as overlap with the trimer band at 3561 cm−1 should not be completely dismissed at this stage. In any case B3LYP-D3 appears to consistently underestimate the hydrogen bond shift for cooperative OH⋯π situations, whereas it overestimates them for isolated OH⋯π and much more so for OH⋯O hydrogen bonds. While part of the latter overestimate is clearly due to a DFT deficiency,75 it may also be partly rooted in the harmonic approximation. Librational zero-point energy generated by the directional interaction weakens the OH⋯OH hydrogen bond and the released strain may strengthen the neighboring OH⋯π contact. However, this must remain speculative in the absence of high quality anharmonic calculations. In any case, the counterpropagating errors for isolated and cooperative OH⋯π hydrogen bonds actually lead to a wrong sequence of bands at B3LYP-D3 level (Fig. 8), which in part persists for B2PLYP-D3 (Table 3). M06-2X and ωB97X-D predict the correct sequence of bands, but perhaps for the wrong reason. This is supported by the wrong energy sequence prediction of ωB97X-D and in particular M06-2X for the different hydrogen bond topologies. The experimental spectral intensities are not consistent with the prediction of a structure as the global minimum. The overestimated stability of OH⋯π hydrogen bonds is reminiscent of the failure of M06-2X for the methanol/anisole complex.76
![[small nu, Greek, tilde]](https://www.rsc.org/images/entities/i_char_e0e1.gif) (ω) at different harmonic levels in comparison with experiment
(ω) at different harmonic levels in comparison with experiment
| Method | ΔE0/kJ mol−1 | Δ![[small nu, Greek, tilde]](https://www.rsc.org/images/entities/i_char_e0e1.gif) (ω)OH⋯π/cm−1 (ω)OH⋯π/cm−1 |
Δ![[small nu, Greek, tilde]](https://www.rsc.org/images/entities/i_char_e0e1.gif) (ω)OH⋯O/cm−1 (ω)OH⋯O/cm−1 |
|---|---|---|---|
| Experiment | <0 | 6(2) | 10(2) |
| B3LYP-D3 | −0.2 | 15 | 14 |
| B2PLYP-D3 | −0.1 | 16 | 14 |
| ωB97X-D | −1.7 | 18 | 8 |
| M06-2X | −2.8 | 7 | 6 |
![[small nu, Greek, tilde]](https://www.rsc.org/images/entities/i_char_e0e1.gif) (ω) (between the OH⋯π mode of homOgπ and the symmetric or antisymmetric OH stretching mode of hetππ, respectively) at different harmonic levels in comparison with experiment
(ω) (between the OH⋯π mode of homOgπ and the symmetric or antisymmetric OH stretching mode of hetππ, respectively) at different harmonic levels in comparison with experiment
| Method | ΔE0/kJ mol−1 | Δ![[small nu, Greek, tilde]](https://www.rsc.org/images/entities/i_char_e0e1.gif) (ω) antis./cm−1 (ω) antis./cm−1 |
Δ![[small nu, Greek, tilde]](https://www.rsc.org/images/entities/i_char_e0e1.gif) (ω) symm./cm−1 (ω) symm./cm−1 |
|---|---|---|---|
| Experiment | >0 | 16(2) | 12(2) |
| B3LYP-D3 | 1.6 | −5 | −10 |
| B2PLYP-D3 | 2.2 | 1 | −4 |
| ωB97X-D | −0.04 | 7 | 3 |
| M06-2X | −2.2 | 29 | 24 |
The comparison between theory and experiment can be extended to abundance estimates for the different isomers, once computed relative absorption band strengths and scattering cross sections are employed. By looking at band strength or cross section ratios for the two OH groups, some of the theoretical errors should cancel and by analyzing both IR and Raman intensities, the robustness of the abundance estimates can be checked. Table 4 lists the resulting intensity ratios between OH⋯O and OH⋯π bands of homOgπ.
| Method | IR | Raman |
|---|---|---|
| Experiment | 1.3(1) | 1.0(1) |
| B3LYP-D3 | 2.0 | 1.1 |
| B2PLYP-D3 | 2.1 | — |
| ωB97X-D | 2.2 | 1.1 |
| M06-2X | 1.4 | 1.2 |
One can see that in both experiment and theory, the IR ratio is somewhat larger than the Raman ratio. However, the IR ratio is overestimated by all methods but M06-2X. Due to the lower intensity and partial spectral overlap for the bands of hetOgπ we can only qualitatively state that their O/π ratio is likely larger than unity with both IR and Raman detection, in agreement with the predictions.
The experimental data from this work is used for up to four independent Tc estimates, using the OH⋯π and OH⋯O band ratios as well as the IR and Raman spectra (see also Fig. S10 and S11 in the ESI†). Comparing bands of the same type (acceptor and detection technique) for both isomers allows for compensation of errors in absolute band strength predictions. The calculated conformational temperature is therefore dominantly a representation of the predicted energy difference. All obtained Tc values for the interconversion between hetOgπ and homOgπ are positive, reflecting the robust qualitative prediction of the energy sequence. It is rewarding that the respective mean values do not vary strongly among the four estimates for each method, supporting both the spectral assignments and the assumptions behind the estimates. The B3LYP-D3 values (12–23 K) fall near the edge (20 K) of the plausible range, the B2PLYP-D3 ones (7–13 K) somewhat below it. This likely results from slight underestimations of the energy difference by these methods. The M06-2X temperatures are elevated (140–260 K) and represent in the absence of an indication for a high-barrier situation (confirmed at this level of theory) an overestimated energy difference. The ωB97X-D energy difference of 1.7 kJ mol−1 is likely the best estimate of these four methods, as it provides conformational freezing temperatures of 85–160 K, near the upper edge (100 K) expected for a low-barrier interconversion in a supersonic expansion.
Somewhat more speculatively, one can determine conformational freezing temperatures between homOgπ and hetππ. Due to the different hydrogen bond topology, systematic error compensation for the cross sections may not work as well. By choosing the OH⋯π- rather than the OH⋯O-intensity of homOgπ, one might expect a better cancellation of cross section errors due to the analogous acceptor moiety. More critical is a potential contribution from homππ underneath the hetππ signal. This would generate Tc values which are too high, but so does the kinetic hindrance due to the high predicted barrier for hetππ relaxation. Therefore, conformational temperatures above 100 K but below the nozzle temperature are expected. At a temperature in this range, the collision-induced interconversion between the two isomers in the jet expansion comes to a halt. Obtained B3LYP-D3 and B2PLYP-D3 freezing temperatures are realistic (100–230 K), whereas the ωB97X-D and M06-2X predictions are negative and thus unplausible. IR and Raman values are again nicely consistent.
In summary, the description of B dimers with DFT methods within the harmonic approximation is challenging. All four tested methods show different deficiencies for relative energies, band positions and spectral visibility. It is therefore imperative to verify this interpretation by a comparison with the related, permanently chiral P system, which allows for control of the hom/het ratio.
![[small nu, Greek, tilde]](https://www.rsc.org/images/entities/i_char_e0e1.gif) ) = 2Irac(
) = 2Irac(![[small nu, Greek, tilde]](https://www.rsc.org/images/entities/i_char_e0e1.gif) ) − Ihom(
) − Ihom(![[small nu, Greek, tilde]](https://www.rsc.org/images/entities/i_char_e0e1.gif) ) and for trimers
) and for trimers  .
.
The sole monomer signal of P is found at 3648 cm−1 – the same position as for B. This coincidence is partly due to a compensation of an expected downshift when switching from a primary to a secondary alcohol, and an expected upshift from a weakened intramolecular OH⋯π-interaction due to the lowering of the OCαCipsoCortho dihedral. The absence of other high frequency signals for both B and P is consistent with the high energy predictions for other monomer conformers as well as for dimers with one hydroxy group not acting as a donor in a hydrogen bond.
The FTIR spectra of enantiopure P contain in addition two intense bands at 3575 and 3516 cm−1. Their hom dimer character is supported by the statistical 50% intensity reduction in the spectrum of the racemic substance due to collision of monomers of the same chirality being half as likely. Assignment to homOgπ is straightforward by analogy to B. A weaker band at 3557 cm−1 is also reduced in the racemic expansion, but the reduction factor is difficult to determine due to the noise level. The Raman spectrum indicates a reduction factor larger than two and thus supports a trimer assignment, as does an analogous trimer band for B at 3561 cm−1. More downshifted oligomer Raman transitions are easily recognized by negative spectral contributions in the heterodimer subtraction procedure but are beyond the scope of this dimer study.
The somewhat broader band near 3574 cm−1 in the racemic spectra consists of closely spaced hom and het contributions, as the difference spectra reveal. Together with an intense band at 3506 cm−1 it clearly belongs to hetOgπ, the het counterpart of the dominant hom dimer. This is supported by the B analogy and by the computations. In the range 3597–3592 cm−1, the heterochiral IR and Raman spectra are again complementary, thus reflecting the hetππ complex. Interestingly, the enantiopure Raman spectrum reveals a weaker band in the same position, which is the first positive evidence for homππ in this work. The IR counterpart is not observered, which may be explained by a poorer signal-to-noise ratio due to the high dilution and a tentatively colder expansion for the IR spectrum.
The warmer and more concentrated Raman detected expansion also reveals some weak bands (homochiral at 3568, 3564, 3545 and 3507 cm−1, heterochiral at 3559, 3552, 3540 and 3514 cm−1) which could be due to higher energy dimers, such as the Otπ motif (predicted to be more competitive in P than in B dimers), or cooperatively shifted trimer OH⋯π interactions. Like more strongly shifted oligomer bands (homochiral at 3417, 3378, 3356 and 3274 cm−1, heterochiral at 3440, 3403, 3369 and 3349 cm−1), which point at substantial oligomer chirality recognition phenomena reminiscent of the methyl lactate case,5 they shall not be discussed further in the present dimer-focused work. We only note the close correspondence of the intense enantiopure 3378 cm−1 band for P with the B band at 3374 cm−1 (Fig. 7), which may point towards homochiral trimer chirality synchronization in B trimers. Whether this involves three-fold symmetry has to remain open.
A detailed comparison of experimental and simulated spectra in the dimer range is provided in Fig. 10.
The homOgπ and hetOgπ assignments have already been discussed and are obvious. They confirm over- and underestimation trends for B and suggest that for the uncertain assignment of the B hetOgπ OH⋯π transition, the 3576 cm−1 band is more likely. For the ππ motif, a partial crossover of the harmonic predictions relative to Ogπ is again found. The Davydov splitting of P hetπ of 5 cm−1 is, as for B, matched by all four quantum chemical methods. However, it is unexpected by all four harmonic methods that the symmetric OH stretching vibrations of hetππ and homππ are coinciding. The smallest mismatch is predicted by B2PLYP-D3 (Δω = 4 cm−1). The hom − het chirality discrimination shifts for the three observed band pairs are summarized in Table 5.
| Method | ππ symm. | Ogπ OH⋯π | Ogπ OH⋯O |
|---|---|---|---|
| Experiment | 0(2) | 2(2) | 10(2) |
| B3LYP-D3 | 7 | 8 | 13 |
| B2PLYP-D3 | 4 | 9 | 12 |
| ωB97X-D | 9 | 13 | 10 |
| M06-2X | −11 | 4 | 9 |
Fig. 10 also includes simulation contributions from Otπ structures, which are energetically somewhat lowered for P relative to B. These contribute at best minor signals and shoulders and shall therefore not be discussed further.
In analogy to B, conformational freezing temperatures can be estimated for the hydrogen bond topology switch, now separately for hom and het pairings (see also Fig. S12 and S13 in the ESI†). The expectation is that they reflect the higher barrier in the hetππ case. Without positive IR evidence of homππ, only an upper bound from the FTIR data is possible: <(70–130) K for B3LYP-D3, B2YPLYP-D3 and ωB97X-D, but negative for M06-2X. The temperatures obtained from the Raman spectrum for the homochiral case are realistic for a low-barrier interconversion with B3LYP-D3 and ωB97X-D predictions (60–100 K) but are strongly negative for M06-2X, due to the wrong prediction of the global minimum structure. For the relaxation of hetππ the B3LYP-D3 und B2PLYP-D3 predictions are significantly higher (200–400 K), as one would expect for kinetic hindrance. The values for ωB97X-D and M06-2X are again strongly negative. These results are similar to the analogous situation for B.
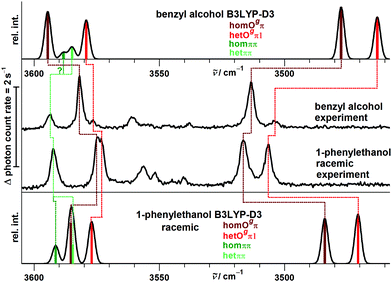
The close analogy between B and P and the regularity in the harmonic prediction failure of band centers is summarized in Fig. 11 for the Raman spectra, focusing on the four most stable conformations. Double methylation of B dimers has a slight weakening effect on the OH⋯O hydrogen bond which translates into a formal strengthening effect for the cooperatively attached OH⋯π hydrogen bond. As mentioned before, this slight formal anti-cooperativity might have a partially anharmonic origin, but in any case it is qualitatively reproduced at harmonic B3LYP-D3 level, as is the slight downshift of the hetππ band.
Coming back to the intensity ratio between the O and π acceptor hydrogen bonds in the Ogπ motif, which was predicted slightly anomalously in the harmonic DFT calculations for B, the corresponding P results are summarized in Table 6. Similar to B (Table 4), B3LYP-D3, B2PLYP-D3 and ωB97X-D predict a higher O acceptor visibility in the IR and a similar visibility in the Raman spectra. Experimentally, the opposite is observed for P. This distinction between B and P can be related to a smaller wavenumber difference between the transitions and thus a stronger coupling and redistribution of IR and Raman activity in P, which is sensitive to accurate hydrogen bond shifts. While this trend in wavenumber difference is predicted by all four methods, only M06-2X predicts the actual values (Table 7) and thus the band intensity ratios (Table 6) almost within the respective experimental uncertainties.
| Method | homOgπ | hetOgπ | ||
|---|---|---|---|---|
| IR | Raman | IR | Raman | |
| Experiment | 0.9(2) | 1.5(2) | 0.9(5) | 1.1(3) |
| B3LYP-D3 | 1.6 | 1.1 | 1.7 | 1.1 |
| B2PLYP-D3 | 1.5 | — | 1.6 | — |
| ωB97X-D | 1.7 | 1.1 | 1.7 | 1.3 |
| M06-2X | 1.1 | 1.3 | 1.3 | 1.4 |
![[small nu, Greek, tilde]](https://www.rsc.org/images/entities/i_char_e0e1.gif) (ω) between the OH⋯π and the OH⋯O modes of homOgπ at different harmonic levels in comparison with experiment
(ω) between the OH⋯π and the OH⋯O modes of homOgπ at different harmonic levels in comparison with experiment
| Method | Δ![[small nu, Greek, tilde]](https://www.rsc.org/images/entities/i_char_e0e1.gif) (ω) B/cm−1 (ω) B/cm−1 |
Δ![[small nu, Greek, tilde]](https://www.rsc.org/images/entities/i_char_e0e1.gif) (ω) P/cm−1 (ω) P/cm−1 |
|---|---|---|
| Experiment | 68(2) | 59(2) |
| B3LYP-D3 | 117 | 102 |
| B2PLYP-D3 | 106 | 88 |
| ωB97X-D | 115 | 103 |
| M06-2X | 69 | 62 |
Whether this is for the right reason or due to error compensation between deficiencies in the electronic structure method (overestimation of the relative strength of the OH⋯π hydrogen bond) and the double-harmonic approximation, has to remain an open question at this time. An interesting test case could be the dimers of propargyl alcohol, for which two conformers were recently assigned in an FTIR matrix study.64 In the nomenclature used here they correspond to homOtπ and homOgπ structures, with the former having weakly and the latter strongly coupled (assigned only 20 cm−1 apart) OH stretching modes.
4 Conclusions
This work can be summarized on a puzzle-solving and on an experimental benchmarking level.On the puzzle-solving level, the close analogy between benzyl alcohol and 1-phenylethanol dimerization together with an extensive characterization of the potential energy landscape has secured and explained three previous chirality-sensitive conjectures and open assignments for the dimer of B:
• The global minimum structure of B dimer is confirmed to involve homochirally synchronized monomers.
• The heterochiral B dimer counterpart is now spectrally assigned and its relative energy is about 0.3–2.0 kJ mol−1 higher.
• The dominant ππ dimer is almost certainly heterochiral, because the Ci symmetry generates a higher trapping barrier, whereas the homochiral counterpart relaxes efficiently.
These conclusions are largely experimental, but they profit from reliable computational assignment aids. For systems of this size, these computations typically have to employ the harmonic approximation. Therefore, a formally good agreement between theory and experiment could be right for the wrong reason and if it is non-systematic, it is not so helpful to the spectroscopist. Systematic deviations, such as overestimations of certain hydrogen bond-induced spectral shifts and underestimations for other types of hydrogen bonds due to anharmonicity, are more acceptable, in particular once they are well understood. A difficult task ahead is to understand why certain hydrogen bond patterns have systematically different anharmonicities. This work provides ample testing ground for such an analysis.
On an experimental benchmarking level, the final assignment of the FTIR and Raman spectra allows for statements about the relative energy of different dimer conformations. These can be directly compared to harmonically zero-point energy-corrected predictions for the four investigated methods. Their performance is summarized in Fig. 12. Because of the two phenyl rings involved, a proper description of London dispersion interactions is essential for the correct energy balance of the different dimer conformations. At least when combined with the may-cc-pVTZ basis set and the double-harmonic approximation, none of the benchmarked functionals strikes this balance in a fully satisfactory way within plausible experimental range, with B3LYP-D3 coming closest. For spectral assignment purposes predicted wavenumber differences suffer from the over- and underestimation of shifts for different hydrogen bonds,74 which might be partly blamed on the harmonic approximation.75 This also results in unreliable visibility ratios already for weakly coupled OH stretching modes, as indicated by results of this work. Predictions for the investigated systems by the double-hybrid B2PLYP-D3 functional (as far as accessible) are overall very similar to B3LYP-D3 and are apparently not profiting from the included high-cost perturbative second-order correlation part. ωB97X-D slightly and M06-2X strongly predicts wrong global minima. However, the latter functional shows the best overall predictions for wavenumber differences and related relative spectral visibility, partly because it does not share the generic overestimation of large hydrogen bond-induced shifts of most DFT methods. This is reminiscent of a broader benchmark for hydrogen bonding.77 It would be rewarding to have a functional which makes better shift predictions for hydrogen bonds without losing predictive power for the energetics of competing isomers.
The dimerization picture which emerges for benzyl alcohol in this work is somewhat analogous but also opposite to that of ethanediol,6 beyond the fact that the chirality is much more transient for the former. Homochiral encounters are funneled down rather efficiently to the global minimum structure of benzyl alcohol, whereas this is closer to reality for heterochiral encounters in ethanediol. A significant fraction of heterochiral encounters gets trapped behind barriers for benzyl alcohol, whereas this is strongly the case for homochiral encounters for ethanediol. For benzyl alcohol, there is the potential for a detailed investigation of such processes by stimulated emission pumping,78 because it offers an aromatic chromophore. It would be interesting to test our conjectures using this or other powerful techniques, because experimental benchmarks need experimental verification.
Conflicts of interest
There are no conflicts to declare.Acknowledgements
This project was partly funded by the Deutsche Forschungsgemeinschaft (DFG, German Research Foundation) – 271107160/SPP1807. Computational ressources from the GWDG and the Faculty of Chemistry (DFG – 405832858/INST 186/1294-1 FUGG) are acknowledged. The benchmarking aspect has profited from the environment provided by the local research training group BENCh (DFG – 389479699/GRK2455). We thank E. Meyer and C. Stelbrink for help in the context of their undergraduate research participation and the workshops of the institute for their valuable support. M. Lange and E. Sennert have kindly provided an improved benzyl alcohol IR jet spectrum. M. Gawrilow has provided instrumental support. N. O. B. Lüttschwager has provided the MC integration method and support for it.Notes and references
- L.-C. Sögütoglu, R. R. E. Steendam, H. Meekes, E. Vlieg and F. P. J. T. Rutjes, Chem. Soc. Rev., 2015, 44, 6723–6732 RSC.
- A. Kumar, E. Capua, M. K. Kesharwani, J. M. L. Martin, E. Sitbon, D. H. Waldeck and R. Naaman, Proc. Natl. Acad. Sci. U. S. A., 2017, 114, 2474–2478 CrossRef CAS.
- C. Tschierske and G. Ungar, ChemPhysChem, 2016, 17, 9–26 CrossRef CAS.
- J. Jacques, A. Collet and S. H. Wilen, Enantiomers, racemates, and resolutions, Krieger, Malabar, Florida, Reissue with corrections, 1994.
- A. Zehnacker and M. A. Suhm, Angew. Chem., Int. Ed., 2008, 47, 6970–6992 CrossRef CAS.
- B. Hartwig, M. Lange, A. Poblotzki, R. Medel, A. Zehnacker and M. A. Suhm, Phys. Chem. Chem. Phys., 2020, 22, 1122–1136 RSC.
- S. Portmann, A. Inauen, H. P. Lüthi and S. Leutwyler, J. Chem. Phys., 2000, 113, 9577–9585 CrossRef CAS.
- T. N. Wassermann and M. A. Suhm, J. Phys. Chem. A, 2010, 114, 8223–8233 CrossRef CAS.
- D. Loru, I. Peña and M. Sanz, J. Mol. Spectrosc., 2017, 335, 93–101 CrossRef CAS.
- T. Scharge, T. Häber and M. A. Suhm, Phys. Chem. Chem. Phys., 2006, 8, 4664–4667 RSC.
- J. Thomas and Y. Xu, J. Phys. Chem. Lett., 2014, 5, 1850–1855 CrossRef CAS.
- M. Mons, E. G. Robertson and J. P. Simons, J. Phys. Chem. A, 2000, 104, 1430–1437 CrossRef CAS.
- J. Altnöder, S. Oswald and M. A. Suhm, J. Phys. Chem. A, 2014, 118, 3266–3279 CrossRef.
- J. C. Pearson, K. V. L. N. Sastry, E. Herbst and F. C. De Lucia, Astrophys. J., 1997, 480, 420–431 CrossRef CAS.
- J. J. Fox and A. E. Martin, Trans. Faraday Soc., 1940, 36, 897 RSC.
- N. Guchhait, T. Ebata and N. Mikami, J. Chem. Phys., 1999, 111, 8438–8447 CrossRef CAS.
- N. Guchhait, T. Ebata and N. Mikami, J. Am. Chem. Soc., 1999, 121, 5705–5711 CrossRef CAS.
- M. A. Suhm and F. Kollipost, Phys. Chem. Chem. Phys., 2013, 15, 10702 RSC.
- S. Oswald, Aromatische und aliphatische Sechsringe in Wasserstoffbrückenkonkurrenz, Bachelor's thesis, Georg-August-Universität Göttingen, 2013, unpublished Search PubMed.
- N. A. Seifert, A. L. Steber, J. L. Neill, C. Pérez, D. P. Zaleski, B. H. Pate and A. Lesarri, Phys. Chem. Chem. Phys., 2013, 15, 11468 RSC.
- M. Mons, F. Piuzzi, I. Dimicoli, A. Zehnacker and F. Lahmani, Phys. Chem. Chem. Phys., 2000, 2, 5065–5070 RSC.
- A. Giardini Guidoni, S. Piccirillo, D. Scuderi, M. Satta, T. M. Di Palma and M. Speranza, Phys. Chem. Chem. Phys., 2000, 2, 4139–4142 RSC.
- A. Giardini Guidoni, S. Piccirillo, D. Scuderi, M. Satta, T. Di Palma, M. Speranza, A. Filippi and A. Paladini, Chirality, 2001, 13, 727–730 CrossRef CAS.
- K. Le Barbu, F. Lahmani, M. Mons, M. Broquier and A. Zehnacker, Phys. Chem. Chem. Phys., 2001, 3, 4684–4688 RSC.
- K. Le Barbu, A. Zehnacker, F. Lahmani, M. Mons, F. Piuzzi and I. Dimicoli, Chirality, 2001, 13, 715–721 CrossRef CAS.
- A. Filippi, A. Giardini, A. Latini, S. Piccirillo, D. Scuderi and M. Speranza, Int. J. Mass Spectrom., 2001, 210–211, 483–488 CrossRef.
- D. Scuderi, A. Paladini, M. Satta, D. Catone, A. Filippi, S. Piccirillo, A. Laganà, M. Speranza and A. Guidoni, Int. J. Mass Spectrom., 2003, 223–224, 159–168 CrossRef CAS.
- R. Medel, C. Stelbrink and M. A. Suhm, Angew. Chem., Int. Ed., 2019, 58, 8177–8181 CrossRef CAS.
- K. Shin-ya, H. Sugeta, S. Shin, Y. Hamada, Y. Katsumoto and K. Ohno, J. Phys. Chem. A, 2007, 111, 8598–8605 CrossRef CAS.
- F. Kollipost, K. E. Otto and M. A. Suhm, Angew. Chem., Int. Ed., 2016, 55, 4591–4595 CrossRef CAS.
- S. K. Nayak, R. Sathishkumar and T. N. G. Row, CrystEngComm, 2010, 12, 3112 RSC . Note that the position of the hydroxy hydrogen atom in the single molecule cutout in Fig. 4 of the reference is not in agreement with the crystal structure.
- T. Forsting and M. Suhm, Curry-Jet SETUP, 2019, DOI:10.6084/m9.figshare.6395840.v1.
- M. J. Frisch, G. W. Trucks, H. B. Schlegel, G. E. Scuseria, M. A. Robb, J. R. Cheeseman, G. Scalmani, V. Barone, B. Mennucci, G. A. Petersson, H. Nakatsuji, M. Caricato, X. Li, H. P. Hratchian, A. F. Izmaylov, J. Bloino, G. Zheng, J. L. Sonnenberg, M. Hada, M. Ehara, K. Toyota, K. Fukuda, J. Hasegawa, M. Ishida, T. Nakajima, Y. Honda, O. Kitao, H. Nakai, T. Vreven, J. A. J. Montgomery, J. E. Peralta, F. Ogliaro, M. Bearpark, J. J. Heyd, E. Brothers, K. N. Kudin, V. N. Staroverov, R. Kobayashi, J. Normand, K. Raghavachari, A. Rendell, J. C. Burant, S. S. Iyengar, J. Tomasi, M. Cossi, N. Rega, J. M. Millam, M. Klene, J. E. Knox, J. B. Cross, V. Bakken, C. Adamo, J. Jaramillo, R. Gomperts, R. E. Stratmann, O. Yazyev, A. J. Austin, R. Cammi, C. Pomelli, J. W. Ochterski, R. L. Martin, K. Morokuma, V. G. Zakrzewski, G. A. Voth, P. Salvador, J. J. Dannenberg, S. Dapprich, A. D. Daniels, Ö. Farkas, J. B. Foresman, J. V. Ortiz, J. Cioslowski and D. J. Fox, Gaussian 09, Revision E.01, Gaussian, Inc. technical report, 2009 Search PubMed.
- A. D. Becke, Phys. Rev. A: At., Mol., Opt. Phys., 1988, 38, 3098–3100 CrossRef CAS.
- C. Lee, W. Yang and R. G. Parr, Phys. Rev. B: Condens. Matter Mater. Phys., 1988, 37, 785–789 CrossRef CAS.
- A. D. Becke, J. Chem. Phys., 1993, 98, 5648–5652 CrossRef CAS.
- P. J. Stephens, F. J. Devlin, C. F. Chabalowski and M. J. Frisch, J. Phys. Chem., 1994, 98, 11623–11627 CrossRef CAS.
- S. Grimme, S. Ehrlich and L. Goerigk, J. Comput. Chem., 2011, 32, 1456–1465 CrossRef CAS.
- F. Weigend and R. Ahlrichs, Phys. Chem. Chem. Phys., 2005, 7, 3297 RSC.
- E. Papajak, J. Zheng, X. Xu, H. R. Leverentz and D. G. Truhlar, J. Chem. Theory Comput., 2011, 7, 3027–3034 CrossRef CAS.
- S. Grimme, J. Chem. Phys., 2006, 124, 034108 CrossRef.
- J.-D. Chai and M. Head-Gordon, Phys. Chem. Chem. Phys., 2008, 10, 6615 RSC.
- Y. Zhao and D. G. Truhlar, Theor. Chem. Acc., 2008, 120, 215–241 Search PubMed.
- G. Karir, N. O. B. Lüttschwager and M. A. Suhm, Phys. Chem. Chem. Phys., 2019, 21, 7831–7840 RSC.
- A. Poblotzki, H. C. Gottschalk and M. A. Suhm, J. Phys. Chem. Lett., 2017, 8, 5656–5665 CrossRef CAS.
- H. C. Gottschalk, A. Poblotzki, M. A. Suhm, M. M. Al-Mogren, J. Antony, A. A. Auer, L. Baptista, D. M. Benoit, G. Bistoni, F. Bohle, R. Dahmani, D. Firaha, S. Grimme, A. Hansen, M. E. Harding, M. Hochlaf, C. Holzer, G. Jansen, W. Klopper, W. A. Kopp, L. C. Kröger, K. Leonhard, H. Mouhib, F. Neese, M. N. Pereira, I. S. Ulusoy, A. Wuttke and R. A. Mata, J. Chem. Phys., 2018, 148, 014301 CrossRef.
- H. C. Gottschalk, A. Poblotzki, M. Fatima, D. A. Obenchain, C. Pérez, J. Antony, A. A. Auer, L. Baptista, D. M. Benoit, G. Bistoni, F. Bohle, R. Dahmani, D. Firaha, S. Grimme, A. Hansen, M. E. Harding, M. Hochlaf, C. Holzer, G. Jansen, W. Klopper, W. A. Kopp, M. Krasowska, L. C. Kröger, K. Leonhard, M. Mogren Al-Mogren, H. Mouhib, F. Neese, M. N. Pereira, M. Prakash, I. S. Ulusoy, R. A. Mata, M. A. Suhm and M. Schnell, J. Chem. Phys., 2020, 152, 164303 CrossRef CAS.
- R. Glaser and G. R. Nichols, J. Org. Chem., 2000, 65, 755–766 CrossRef CAS.
- V. V. Varfolomeeva and A. V. Terent’ev, Russ. J. Phys. Chem. A, 2010, 84, 1592–1597 CrossRef CAS.
- B. J. Miller, H. G. Kjaergaard, K. Hattori, S.-i. Ishiuchi and M. Fujii, Chem. Phys. Lett., 2008, 466, 21–26 CrossRef CAS.
- K. A. Utzat, R. K. Bohn, J. A. Montgomery, H. H. Michels and W. Caminati, J. Phys. Chem. A, 2010, 114, 6913–6916 CrossRef CAS.
- T. V. Alves, L. Simón-Carballido, F. R. Ornellas and A. Fernández-Ramos, Phys. Chem. Chem. Phys., 2016, 18, 8945–8953 RSC.
- S. Tang, Z. Xia, A. Maris and W. Caminati, Chem. Phys. Lett., 2010, 498, 52–55 CrossRef CAS.
- L. Evangelisti, L. B. Favero and W. Caminati, J. Mol. Struct., 2010, 978, 279–281 CrossRef CAS.
- R. G. Bird, A. E. Nikolaev and D. W. Pratt, J. Phys. Chem. A, 2011, 115, 11369–11377 CrossRef CAS.
- L. Evangelisti, G. Feng, Q. Gou and W. Caminati, J. Mol. Struct., 2012, 1023, 15–17 CrossRef CAS.
- L. Evangelisti, Q. Gou, G. Feng and W. Caminati, Mol. Phys., 2013, 111, 1994–1998 CrossRef CAS.
- R. T. Saragi, M. Juanes, W. Caminati, A. Lesarri, L. Enríquez and M. Jaraíz, J. Phys. Chem. A, 2019, 123, 8435–8440 CrossRef CAS.
- B. Maté, R. D. Suenram and C. Lugez, J. Chem. Phys., 2000, 113, 192–199 CrossRef.
- J. Kapitán, C. Johannessen, P. Bouř, L. Hecht and L. D. Barron, Chirality, 2009, 21, E4–E12 CrossRef.
- E. Bogdan, G. Compain, L. Mtashobya, J.-Y. Le Questel, F. Besseau, N. Galland, B. Linclau and J. Graton, Chem. – Eur. J., 2015, 21, 11462–11474 CrossRef CAS.
- A. K. King and B. J. Howard, J. Mol. Spectrosc., 2009, 257, 205–212 CrossRef CAS.
- D. Mani and E. Arunan, J. Chem. Phys., 2014, 141, 164311 CrossRef.
- J. Saini and K. S. Viswanathan, J. Phys. Chem. A, 2017, 121, 1448–1459 CrossRef CAS.
- K. A. E. Meyer and M. A. Suhm, J. Chem. Phys., 2018, 149, 104307 CrossRef.
- N. Borho and M. A. Suhm, Org. Biomol. Chem., 2003, 1, 4351 RSC.
- N. Borho and M. A. Suhm, Phys. Chem. Chem. Phys., 2002, 4, 2721–2732 RSC.
- J. Altnöder, J. J. Lee, K. E. Otto and M. A. Suhm, ChemistryOpen, 2012, 1, 269–275 CrossRef.
- R. S. Ruoff, T. D. Klots, T. Emilsson and H. S. Gutowsky, J. Chem. Phys., 1990, 93, 3142–3150 CrossRef CAS.
- J. Altnöder, A. Bouchet, J. J. Lee, K. E. Otto, M. A. Suhm and A. Zehnacker-Rentien, Phys. Chem. Chem. Phys., 2013, 15, 10167 RSC.
- J. A. Frey, C. Holzer, W. Klopper and S. Leutwyler, Chem. Rev., 2016, 116, 5614–5641 CrossRef CAS.
- S. Haldar, R. Gnanasekaran and P. Hobza, Phys. Chem. Chem. Phys., 2015, 17, 26645–26652 RSC.
- E. Sennert, Methyllaktat als multifunktionaler chiraler Induktor, Bachelor's thesis, Georg-August-Universität Göttingen, 2019, unpublished Search PubMed.
- R. Medel, M. Heger and M. A. Suhm, J. Phys. Chem. A, 2015, 119, 1723–1730 CrossRef CAS.
- M. Heger, M. A. Suhm and R. A. Mata, J. Chem. Phys., 2014, 141, 101105 CrossRef.
- H. C. Gottschalk, J. Altnöder, M. Heger and M. A. Suhm, Angew. Chem., Int. Ed., 2016, 55, 1921–1924 CrossRef CAS.
- S. Oswald and M. A. Suhm, Phys. Chem. Chem. Phys., 2019, 21, 18799–18810 RSC.
- B. C. Dian, J. R. Clarkson and T. S. Zwier, Science, 2004, 303, 1169–1173 CrossRef CAS.
Footnote |
| † Electronic supplementary information (ESI) available: Two-dimensional conformational scans of the monomers, more details and transition states of dimers, list of experimental band positions. See DOI: 10.1039/d0cp04825a |
| This journal is © the Owner Societies 2020 |

