 Open Access Article
Creative Commons Attribution 3.0 Unported Licence
Reply to the ‘Comment on “Powering sustainable development within planetary boundaries”’ by Y. Yang, Energy Environ. Sci., 2020, 13, DOI: 10.1039/C9EE01176E
Ibrahim M.
Algunaibet
 a,
Carlos
Pozo
 ab,
Ángel
Galán-Martín
 c,
Mark A. J.
Huijbregts
 d,
Niall
Mac Dowell
 ae and
Gonzalo
Guillén-Gosálbez
 *c
*c
aCentre for Process Systems Engineering, Department of Chemical Engineering, Imperial College London, South Kensington Campus, London SW7 2AZ, UK
bLEPAMAP Research Group, University of Girona, Maria Aurèlia Capmany, 61, Girona 17003, Spain
cInstitute for Chemical and Bioengineering, Department of Chemistry and Applied Biosciences, ETH Zürich, Vladimir-Prelog-Weg 1, 8093 Zürich, Switzerland. E-mail: gonzalo.guillen.gosalbez@chem.ethz.ch
dDepartment of Environmental Science, Institute for Water and Wetland Research, Radboud University, P.O. Box 9010, NL-6500, GL, Nijmegen, The Netherlands
eCentre for Environmental Policy, Imperial College London, South Kensington Campus, London SW7 1NA, UK
First published on 12th December 2019
Abstract
In our recently published work, we incorporated planetary boundaries in the optimization of the United States (US) power sector in 2030. Yang claims there is a double-counting error in our results and encourages us to minimize direct emissions instead of life cycle emissions in our model. Here, we argue that Yang's main criticism based on the risk of double-counting emissions when multiple sectors are simultaneously optimized does not apply to our case study, in which only one sector – the power sector – is analyzed. To assess the implications of Yang's suggestion to minimize direct emissions, we repeated the calculations optimizing direct emissions instead of life cycle emissions. We found that this approach is unable to discriminate effectively between electricity production technologies and, consequently, leads to a suboptimal mix with impacts on climate change, ocean acidification and freshwater use 102, 33 and 1.5 times the limits, respectively, whereas our original solution meets all planetary boundaries concurrently. Our findings imply that Yang's suggestion of optimizing direct emissions in energy systems models might not the best way forward in single-sector studies like ours.
Outline
We appreciate Dr Yang's comments and interest in our work. We acknowledge that the readers of the original manuscript could reach Yang's conclusions due to the way it was presented. To summarize, Yang claims that our calculations incur double-counting because the projected United States (US) total demand for electricity in 2030 was multiplied by the life cycle impact embodied in electricity generation, instead of by the direct emissions of electricity generation. The motivation for his comment is that in his view part of the impact of electricity generation should be assigned to other sectors, as they consume electricity for their own activities that ultimately aim to satisfy their final demand of products. Yang further encouraged us to repeat our calculations using direct emissions in lieu of life cycle ones.Below we address Yang's concerns by: (i) differentiating between single- and multi-sector models; (ii) illustrating the potential occurrence of double-counting in single-sector models; and (iii) assessing the potential pitfalls of Yang's proposed approach.
Double-counting
Double-counting might occur when (i) multiple sectors are analyzed concurrently considering their life cycle impact or (ii) when environmental burdens relevant to electricity generation are accounted twice, i.e., in the life cycle factor as well as in the total electricity demand.Yang's comment on double-counting is indeed directly applicable to multi-sector models, such as input–output tables, in which double-counting would occur if the life cycle emissions of all the sectors of an economy were summed up together. For instance, if the chemical and power sectors were optimized simultaneously, we should subtract the electricity consumed in the former from the total electricity demand, while using allocation methods to deal with other mass and energy flows exchanged between the two sectors. In our case, however, we focus on a single sector in a given country and single year, so using either direct or life cycle emissions is an open modeling choice, provided the other sectors are not optimized simultaneously using life cycle emissions, which was out of the scope of our work. We optimized the LCA impact of the US power sector in 2030, leaving the other sectors out of the analysis, so there is no risk of multi-sectoral double counting.
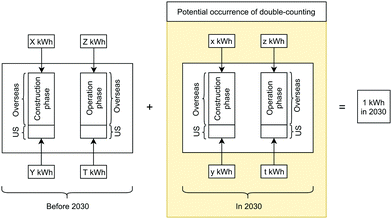
Double-counting in the electricity demand could, however, still influence our calculations. This double-counting occurs when environmental flows are summed up twice, i.e., impacts embodied in a given process are duplicated in the calculations (Fig. 1). To avoid this, the electricity consumed in the US in 2030 during the construction and/or operation phases of electricity generation should not be considered simultaneously in the life cycle parameters as well as in the total electricity demand; more precisely, amounts y and t in Fig. 1 should be excluded from the US electricity demand in 2030. As an example, the electricity consumed in the US to construct and operate coal plants should be either included in the lumped life cycle parameter for electricity from coal or in the total US electricity demand, but not in both simultaneously.
Under the assumptions explained in detail next, we accounted for electricity consumption in the construction and operation of power plants only once, i.e., in the life cycle factor and not in the projected US demand for electricity in 2030, thereby avoiding the occurrence of this type of double-counting. Note that there is no double-counting concerning the electricity consumed overseas to generate electricity in the US (X, Z, x and z in Fig. 1), e.g., construction and operation of facilities built in China that contribute to delivering the electricity demanded in the US, whether before or in 2030. This is because these electricity inputs are accounted for only once, i.e., in the life cycle parameters, as the US demand for electricity omits energy flows from overseas. The potential occurrence of double-counting in the amount of domestic electricity consumed to construct and operate the power plants in the mix is discussed in detail next. We stress that in the absence of full disaggregated data, sensible assumptions were made to minimize the risk of double-counting.
The Ecoinvent2 database quantifies the electricity consumed for electricity generation. This electricity input can be generated overseas or by an aggregated region encompassing US, Canada and part of Mexico, known as the North American Electric Reliability Corporation (NERC). Hence, the precise share of NERC electricity corresponding to an individual country that is consumed in the electricity generation phase is unknown. The extent to which double-counting could, therefore, potentially occur depends on the amount of NERC electricity consumed in the electricity generation phase attributed to the US in 2030. Our original calculations assumed that all the electricity consumed over the life cycle to generate electricity in the US was either fully imported from Canada and Mexico or, if coming from the US, it would correspond to periods before 2030, i.e., time lags in production3 (T in Fig. 1).
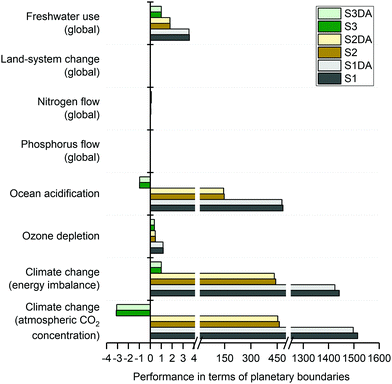
To assess the accuracy of this assumption, we ran the calculations again subtracting from the projected US electricity demand in 2030 the total electricity input from NERC consumed in the operation phase of electricity generation in the US in 2030. This assumption reduces the total US demand for electricity in 2030 by 1%, underestimating the impact of electricity generation (while the original calculations could overestimate it). Rerunning ERCOM-PB for the new demand, the performance in planetary boundaries improved by no more than 1% to 2% (Fig. 2), which falls within the uncertainty range in the original calculations.1 Finally, we note that in the absence of more disaggregated data, all the calculations assumed that the amount of electricity consumed in the US in 2030 in the construction phase of power plants operating in that same year (y in Fig. 1) is negligible. We think this is a sensible assumption considering the time frames involved in the construction of power plants, i.e., up to 11 years.4
 | ||
| Fig. 2 US electricity generation performance relative to downscaled planetary boundaries. Solutions S1, S2 and S3 correspond to the business as usual, Paris Agreement and minimum transgression of planetary boundaries, respectively, obtained directly from the original paper.1 S1DA, S2DA and S3DA correspond to the business as usual, Paris Agreement and minimum transgression of planetary boundaries, respectively, when the demand is adjusted by 1% to reflect the assumption whereby all NERC electricity consumed in the operation of US power plants is generated in the US in 2030. | ||
Direct versus life cycle emissions
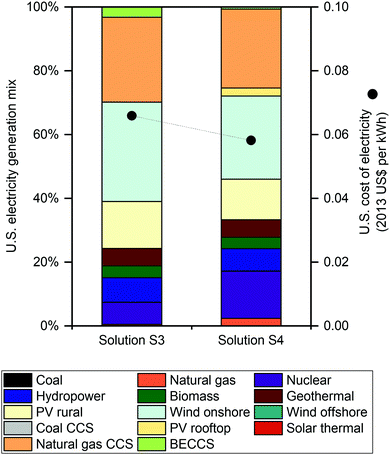
Life cycle emissions are in our opinion more suitable when a single sector is assessed, as otherwise the occurrence of burden-shifting5,6 can be overlooked, e.g., environmental burdens can be simply shifted to other activities in the product's life cycle. This is because direct emissions omit links between sectors that are essential for a proper evaluation of power technologies. Indeed, the ongoing trend in energy systems modeling is to quantify the impact over the life cycle when the power sector in a given country is assessed.7–13Following Yang's comment, we re-ran solution S3, referred to as solution S4 from here onwards, via ERCOM-PB using direct emissions instead of life cycle emissions, i.e., the transgression of the downscaled planetary boundaries was constrained via direct emissions (Fig. 3). In solution S4, the discriminatory power of ERCOM-PB is very limited, as from an environmental viewpoint renewable technologies perform quite similarly. This is because, from a planetary boundaries viewpoint, they differ in life cycle performance but are almost the same in terms of direct performance; consequently, the model decreases the share of expensive technologies, such as natural gas with Carbon Capture and Storage (CCS) and Bio-Energy with CCS (BECCS) plants. This approach lowers the cost of electricity generation by 12% in contrast to solution S3, as investments in nuclear and natural gas plants are preferred over other alternatives that can better contribute to meet planetary boundaries throughout their supply chains, such as BECCS.
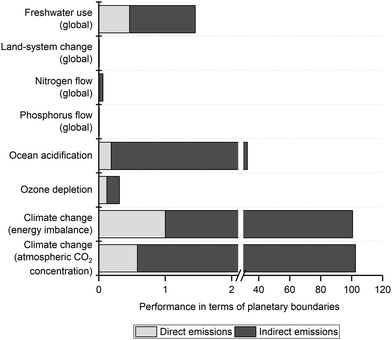
Fig. 4 shows the direct and life cycle environmental impacts on each downscaled planetary boundary for solution S4. This solution was obtained by constraining the transgression of planetary boundaries via direct emissions only. Clearly, optimizing energy systems based on their direct emissions can lead to a mix with high life cycle impacts compared to its direct impact. For example, the life cycle atmospheric CO2 concentration and ocean acidification are 177 times higher than their direct impacts counterparts. Moreover, life cycle energy imbalance and freshwater use are 101 and 3 times their direct impacts, respectively. While the original solution (S3) meets all planetary boundaries concurrently (Fig. 2), solution S4 transgresses both climate change PBs by around 102 times their limits, as well as ocean acidification and freshwater use by 33 and 1.5 times their thresholds, respectively (Fig. 4).
Conclusions
We showed here that, under the assumptions made, the effect of double-counting on our results is negligible. First, we focused only on a single-sector, omitting other sectors in the analysis and avoiding multi-sectoral double-counting. Second, we showed that the electricity input generated by NERC that is consumed in the operation phase of power facilities in the US is virtually negligible (<1%) compared to the total electricity consumption in the US, so double-counting here would, therefore, be negligible. Third, in the absence of full disaggregated data, we still think that neglecting the amount of electricity consumed in the construction phase of power plants in the same year they are under operation is a sensible assumption given the time frames of building such facilities.Furthermore, if direct emissions were used instead of life cycle emissions in the optimization, as suggested by Yang, planetary thresholds for climate change, ocean acidification and freshwater use would be transgressed by 102, 33 and 1.5 times their limits, respectively; meanwhile, the mix designed via life cycle emissions, as shown in the original article, meets all planetary boundaries concurrently. Alternatively, if only the final demand of households was considered in the study while still using the life cycle emissions, the analysis would be restricted to a small part of the whole power sector, i.e., only 39% of the total electricity generated.14
In the context of designing and planning electricity mixes, we argue that optimizing life cycle impacts can better support policymaking and should, therefore, be the method of choice.
Conflicts of interest
There are no conflicts to declare.Acknowledgements
I. M. A. thanks Saudi Aramco for the full PhD scholarship. G. G.-G. acknowledges the Spanish Ministry of Education and Competitiveness (CTQ2016-77968-C3-1-P, MINECO/FEDER) for the financial support received. C. P., G. G.-G. and N. M. D. acknowledge the financial support from NERC – Natural Environment Research Council (NE/P019900/1). M. A. J. H. was supported by an ERC consolidation grant (62002139 ERC – CoG SIZE 647224).References
- I. M. Algunaibet, C. Pozo, Á. Galán-Martín, M. A. J. Huijbregts, N. Mac Dowell and G. Guillén-Gosálbez, Energy Environ. Sci., 2019, 12, 1890–1900 RSC.
- G. Wernet, C. Bauer, B. Steubing, J. Reinhard, E. Moreno-Ruiz and B. Weidema, Int. J. Life Cycle Assess., 2016, 21, 1218–1230 CrossRef.
- G. Okten, O. Kural and E. Algurkaplan, Storage of Coal: Problems and Precautions, in Energy Storage Systems, ed. Y. Gogus, Department of mining Engineering, Istanbul Technical University, Turkey, 2009 Search PubMed.
- K. Sarıca and I. Or, Energy, 2007, 32, 1484–1499 CrossRef.
- I. M. Algunaibet and G. Guillén-Gosálbez, J. Cleaner Prod., 2019, 229, 886–901 CrossRef.
- A. G. Garay, M. Frei, A. Alqahtani, C. Mondelli, G. Guillen-Gosalbez and J. Perez-Ramirez, Energy Environ. Sci., 2019, 12, 3425–3436 RSC.
- D. García-Gusano, D. Iribarren and J. Dufour, Energy Policy, 2018, 114, 413–421 CrossRef.
- S. Rauner and M. Budzinski, Environ. Res. Lett., 2017, 12, 124005 CrossRef.
- D. Garcia-Gusano, D. Garrain and J. Dufour, Renewable Sustainable Energy Rev., 2017, 75, 21–34 CrossRef CAS.
- D. García-Gusano, D. Iribarren and D. Garraín, Appl. Energy, 2017, 190, 891–901 CrossRef.
- D. Garcia-Gusano, I. R. Istrate and D. Iribarren, Sci. Total Environ, 2018, 612, 386–391 CrossRef CAS PubMed.
- D. Garcia-Gusano, M. Martin-Gamboa, D. Iribarren and J. Dufour, Resources, 2016, 5, 39 CrossRef.
- I. M. Algunaibet, C. Pozo, Á. Galán-Martín and G. Guillén-Gosálbez, Appl. Energy, 2019, 242, 588–601 CrossRef.
- EIA, Annual Energy Outlook 2019 with projections to 2050, 2019.
| This journal is © The Royal Society of Chemistry 2020 |


