 Open Access Article
A new concept in constructed wetlands: assessment of aerobic electroconductive biofilters†
Arantxa
Aguirre-Sierra
 abc,
Tristano
Bacchetti-De Gregoris
a,
Juan José
Salas
 c,
Andrés
de Deus
b and
Abraham
Esteve-Núñez
 *ab
*ab
aIMDEA Agua, Parque Científico Tecnológico, E-28805 Alcalá de Henares, Madrid, Spain. E-mail: abraham.esteve@imdea.org
bDepartment of Analytical Chemistry and Chemical Engineering, University of Alcalá, E-28805 Alcalá de Henares, Madrid, Spain
cFoundation Centre for New Water Technologies (CENTA), E-41820 Carrión de los Céspedes, Sevilla, Spain
First published on 12th March 2020
Abstract
The METland® concept constitutes a hybrid concept for treating wastewater where microbial electrochemical technologies (MET) are integrated with constructed wetlands (CW) to enhance pollutant removal. Although electroactive bacteria (EAB) were thought to be restricted to anaerobic environments, we decided to explore alternative aerobic conditions like those found in down flow vertical CW. Two electroconductive (EC) biofilters fed with real urban wastewater were operated under downflow (aerobic) and upflow (anaerobic) conditions. The objective was to evaluate the impact of the operational mode on both the removal of pollutants and the microbial community profile. Surprisingly, despite the aerobic nature of the downflow EC biofilter, our results revealed an abundance of EAB from the Geobacter genus, opening a new scenario for treating wastewater based on stimulating extracellular electron transfer. Furthermore, the co-presence of Geobacter and Thiobacillus suggests the existence of interspecies electron transfer leading to nitrate respiration in our system. Moreover, the downflow EC biofilter outperformed the anaerobic upflow one in terms of COD, BOD5 and nitrogen removal.
Water impactIn spite of the general statement that wastewater treatments based on electroactive bacteria (electron interchange with electroconductive materials) should be operated under anoxic conditions, we have shown how such microorganisms are compatible with a redox environment found in aerobic-downflow biofilters (vertical constructed wetlands 3 m2 pe−1). The new concept, the so-called METland®, outperforms wetlands by nitrifying and reducing the surface requirement to 0.5 m2 pe−1. |
Introduction
Since the discovery of electroactive microorganisms, those capable of directly exchanging electrons with electrically conductive materials,1 a number of innovative applications in the field of wastewater treatment (WWT) have been extensively explored. For instance, the conversion of chemical energy from wastewater into electrical power, by means of bioelectrochemical devices like microbial fuel cells (MFC), constitutes the most extensively reported concept on the lab scale2,3 and, occasionally, on the pilot scale.4–7 Beyond the energy harvesting potential of this technology, alternative applications like hydrogen production,8 nutrient removal,9–12 biosensing,13–15 nutrient recovery,16,17 sulphate reduction,18 or metal recovery,19,20 to name a few, have made MET an attractive platform.In contrast to all those applications, it has been suggested that integrating MET into already existing systems like anaerobic digesters21 and oxic–anoxic systems from WWT plants10 may be an effective approach to accelerate the implementation on a full scale. Among existing technologies, flooded constructed wetlands (CW) were recently identified as potential hosts for integrating MET-based technologies.22 CW are engineered systems made of a gravel or sand biofilter bed with wetland plants that use the natural functions of vegetation and microorganisms to remove pollutants from wastewater. They have been widely used for decades in urban WWT for small communities23 and present the advantages of low energy requirements, low costs of operation and maintenance, and good landscape integration in comparison to conventional WWT technologies.24 In this context, the combination of MET and CW has been successfully implemented in a few previous studies leading to a hybrid technology the so-called METland®.25–27 Other studies have integrated MFC concepts into CW with the purpose of harvesting energy, although the strategy of burying electrodes in the gravel of conventional CW exhibited a minor impact on the wetland performance from the water purification perspective.28–30 In contrast, the METland® concept followed an alternative approach by replacing the classical biofilter material (gravel and sand) with an EC material so bacteria can interchange electrons with the bed. The first METland® was based on horizontal subsurface flow (HSSF),25 a saturated system in which anaerobic conditions prevailed. Such METland® units made of EC materials outperformed standard CW by 4-fold after ca. 4 years of operation at 2 m3 per day.31 METland® bacterial community analysis revealed the enrichment of Deltaproteobacteria, a known electroactive taxon, and Geobacter, the most extensively studied model EAB and the dominant genus in the deeper zones of the EC bed where oxidation of organic matter occurred.25 Additional studies based on electric potential values showed how the electron flow profile along the bed is severely affected by using an EC material from METland® instead of inert gravel or sand used in standard CW.26 This electron flow from the deeper anaerobic bed towards oxygenated upper layers seems to be the driving force to enhance COD removal even under anaerobic conditions. A similar concept has been already described for certain kinds of microorganisms (the so-called cable bacteria) which are capable of forming filaments and capable of transfering electrons from reducing environments in the sediment to upper layers with a more positive redox potential through the cell bodies forming the filament.32–34 In contrast to the standard CW that use inert material, the METland® concept allows to play with EC material of different nature, from graphite or coke to more sustainable materials like EC biochar, produced by Quercus pyrolysis.27
Although the HSSF METland® concept was effective in terms of COD removal, including pharmaceuticals and micropollutants,35 the anaerobic nature of the HSSF was not optimal for removing ammonium. Optimal ammonium removal requires a different kind of CW called vertical flow (VF) where wastewater is dosed downflow (DF) through the system intermittently leading to an aerobic environment so nitrification by aerobic microorganisms is strongly favoured. Standard VF CW have lower surface requirements (around 3 m−2 pe−1) and do not suffer from the typical clogging present in HSSF CW, when they are operated by intermittent DF.36
Interestingly, EAB research is typically limited to anaerobic conditions for avoiding oxygen to compete with the EC material to accept electrons. So, in this scenario, it may seem counterintuitive to study EAB under a typical aerobic environment like VF CW. However, the main goal of this research was to assess the possible synergistic effects of both EC material and aerobic operation, in a vertical DF electroconductive biofilter (EC-biofilter) to enhance the removal of organic matter and nutrients.
Materials and methods
Experimental design
Two different sets of biofilters were assayed designated as SWW, for testing synthetic wastewater, or UWW, for testing urban wastewater (Table 1).| Experimental design | Type of WW | Start-up | Type of biofilter | Mode of operation | Total volume | HLR (mm d−1) | Inoculation EAB | Objective | Study of bacterial communities |
|---|---|---|---|---|---|---|---|---|---|
| SWW biofilters | Synthetic WW | 1 month | EC biofilter | Vertical DF (aerobic) | 4.7 L | 280 | Yes | Compare EC vs. inert DF performance | No |
| 560 | |||||||||
| 1120 | |||||||||
| Inert biofilter | Vertical DF (aerobic) | 4.7 L | 280 | Yes | No | ||||
| 560 | |||||||||
| 1120 | |||||||||
| UWW biofilters | Primary treated urban WW | 1 month | EC biofilter | Vertical DF (aerobic) | 23.5 L | 258 | No | Compare aerobic vs. anaerobic EC biofilters performance and bacterial communities | Yes |
| EC biofilter | Vertical UF (anaerobic) | 23.5 L | HRT 1 d | No | Yes | ||||
| Inert biofilter | Vertical DF (aerobic) | 23.5 L | 258 | No | Compare bacterial communities | Yes |
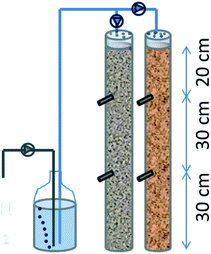
First, SWW biofilters made of PVC (900 mm long, 90 mm outer diameter) were built to be operated as VF CW. One was filled up with an EC material (coke granules) as a biofiltering bed, and the other with standard inert gravel (as control) (Fig. 1). Both biofilters were perforated at their lateral at 30 cm and 60 cm from the bottom. Through every hole, a PVC tube of 16 mm diameter was inserted sloping as a collector for sampling waste. Bottom caps were perforated to let the water drain and facilitate air convection; likewise, top caps were perforated as a showerhead to improve the homogeneous distribution of synthetic wastewater. Systems were filled with a granulated material (Ø 5–10 mm) up to 80 cm, leaving a reservoir on the top to avoid overflowing.
With the purpose of generating a real biological community, the biofilters were inoculated with real urban wastewater from the municipality of Carrión de los Céspedes (Sevilla, Spain) (2500 inhabitants) by circulating it for 3 days. Then, they were inoculated with 50 ml of Geobacter sulfurreducens culture with 0.51 units of optical density at 600 nm.
The biofilters had a total volume of 4.7 L and a water volume of 1.6 L. The systems were fed from the top using anoxic synthetic wastewater (SWW) sparged with nitrogen gas (see ESI† Table S1). A peristaltic pump was calibrated for flow rates of 1.6, 3.2 and 4.8 L per day in the experiment. Such a flow rate implied hydraulic loading rates (HLR) of 280, 560 and 1120 mm d−1 that would correspond to 24, 12 and 6 hours of hydraulic retention time (HRT) if they were flooded, respectively. Henceforth, although the water was not retained inside the biofilters (it just percolated through the media), we have used the HRT for referring to the hydraulic operation.
A second set of VF EC-biofilters (the so-called UWW) was constructed on a pilot scale (Fig. 2) to be tested with urban wastewater in two operational modes: one was operated as an upflow (UF) biofilter, flooding all pores of the bed and maintaining anaerobic conditions, while the other was non-flooded and operated as a DF biofilter, leading to an aerobic environment inside the bed. Both UF and DF biofilters were made of PVC cylinders (200 mm diameter and 900 mm height) and filled up with electrically conductive coke granules. From bottom to top, the first 5 cm of the biofilters was filled with a coarse material (Ø 25 mm) followed by 70 cm of finer material (Ø 5–10 mm). The DF EC-biofilter also had a 1 cm layer of sand (Ø 0.27 mm) at the top for the even distribution of inlet wastewater. The bottom of the DF EC-biofilter was perforated with 1 cm diameter holes allowing the water to drain into an air chamber which provided better circulation of air through the media. The systems had a total volume of 23.5 L including a water volume of 8 L and an inlet area of ca. 0.03 m2.
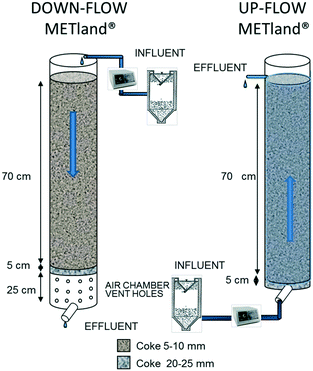 | ||
| Fig. 2 Design of the second experimental DF (aerobic) and UF (anaerobic) pilot UWW EC-biofilters (METland®). | ||
This second set of EC-biofilters (UWW) was fed by programmed pumping with real urban wastewater, previously treated in an Imhoff tank (wastewater characteristics shown in ESI† Table S2). All assays were performed in a Carrión de los Céspedes WWT plant (Sevilla, Spain, 2500 inhabitants) for 175 days. The DF EC-biofilter was fed from the top intermittently with 8 L d−1 with 16 pulses for 10 minutes (0.05 L min−1), which corresponds to a HLR of 258 mm d−1. In contrast, the UF EC-biofilter was continuously fed at 8 L d−1 from the bottom, giving a nominal hydraulic retention time (HRT) of 1 day. The biofilters were operated for one month prior to sample analysis.
Plants are typically integrated in CW for oxygenating the root zone and for providing a habitat to aerobic microorganisms. Thus, plants were not included in our experimental setups in order to achieve a better control of the redox interactions between bacteria and the bed. BOD5 loading rates of 10 to 40 g m−2 d−1 are often used in VF CW depending on the design, with most designs using a loading rate of 20 g m−2 d−1 to achieve a BOD5 concentration of the effluent under 25 mg BOD5 L−1 (ref. 37) and fulfil legal requirements for WWT.38
Physicochemical and statistical analysis
For the first experiment, synthetic WW was prepared weekly, the pH was adjusted to 7 and it was autoclaved to avoid biological degradation of the substrates. Influent, effluent and intermediate sampling points (20 cm and 50 cm from the top) were daily sampled. The WWT performance of the biofilters was determined by analyzing the evolution of COD, ammonia nitrogen (NH4-N), nitrate nitrogen (NO3-N) and nitrite nitrogen (NO2-N). COD was analyzed following standard methods.39 Nitrogen forms were analysed by ion chromatography (930 Compact IC Flex, Metrohm).During the second experiment, samples of influent wastewater and effluents of the systems were analysed weekly to monitor the biofilter performance in terms of biochemical oxygen demand (BOD5), total suspended solids (TSS), total phosphorous (TP), total nitrogen (TN), ammonium nitrogen (NH4-N), and nitrate nitrogen (NO3-N). Wastewater was sampled twice a week for chemical oxygen demand (COD) analysis. All the analyses were performed following the standard methods.39 Electrical conductivity (EC), pH, dissolved oxygen (DO), temperature (T) and redox potential (ORP) were measured with a handheld multiparameter (YSI 556 MPS).
Pollutant removal efficiencies were calculated in percentage while removal rates were calculated in grams per cubic meter of the biofiltering bed for a day. Statistical procedures to evaluate the performance of the biofilters were conducted using the Statgraphics Centurion XVII statistical software package. Tests were used to determine the differences of every water quality parameter among the sampling points and pairs were compared by LSD multiple range comparisons (95% confidence).
Microbial communities' study
DNA was extracted with PowerSoil spin columns (MO BIO Laboratories) and amplified with primers 341F 5′-CCTACGGGNGGCWGCAG-3′ and 785R 5′-GACTACHVGGGTATCT AATCC-3′,40 targeting the V3 and V4 regions of the bacterial 16S rRNA gene. The polymerase used was 2× KAPA HiFi HotStart Ready Mix (KAPA Biosystems) and the PCR conditions were: initial denaturation at 95 °C for 3 minutes followed by 25 cycles at 95 °C for 30 s, 55 °C for 30 s and 72 °C for 30 s, and a final elongation step at 72 °C for 5 minutes. 1/50 dilution of PCR products was then re-amplified (15 cycles) with Illumina's primers. Illumina PCR reactions were gel purified in order to get rid of any possible primer–dimers and undesired products. Finally, the products were run on a Bioanalyzer (Agilent) to estimate the concentration of each sample within the region of interest and the successful generation of equimolar pools was confirmed by qPCR. Sequencing was performed with the MiSeq equipment using the 2 × 250 bp format and following Illumina's protocol.
The Illumina Miseq sequence reads have been deposited in the European Nucleotide Archive (ENA) databases under accession no. PRJEB15667.
Results and discussion
Most of the MET-based devices for treating wastewater exhibit 2- or 3-electrode configurations where electrons flow from an anode to a cathode; however, in the current study, we have operated our EC-biofilters as a single electrode that accept the electrons produced in the oxidation processes and transfer these electrons to electron acceptors present in the soluble medium. This short-circuited electrochemical scenario is the so-called microbial electrochemical snorkel (MES)48 and electrons flow through a single material instead of a hosting independent anode and cathode. The effect of using an EC material instead of a classical inert material for construction of vertical biofilters was evaluated at two different levels: biodegradation (COD, BOD and nitrogen) capacity and microbial communities' profile.Exploring aerobic performance in electroactive biofilters with synthetic wastewater (SWW)
Our first approach was to assay aerobic conditions using DF VF CW using synthetic wastewater (SWW) as a proof of concept.| HLR mm d−1 | 280 | 560 | 1120 |
|---|---|---|---|
| COD loading rate g m−2 d−1 | 175 ± 16 | 372 ± 22 | 695 ± 12 |
| Theoretical BOD5 g m−2 d−1 | 105 ± 10 | 223 ± 13 | 417 ± 7 |
| NH4-N loading rate g m−2 d−1 | 9.2 ± 1.3 | 19.7 ± 1.2 | 38.8 ± 2.6 |
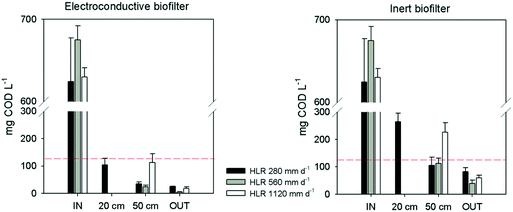
There were significant differences between both biofilters at every sampling point (p < 0.05), with the EC-biofilter as the best performance (Fig. 3). Regarding the lowest HLR (280 mm d−1), this biofilter reached the legal limits of discharge at 20 cm from the inlet, with a removal efficiency of 83 ± 9% at that point (Table 3). Even at the highest HLR, this EC-biofilter always reached the limit values of discharge (125 mg L−1 or more than 75% removal)38 at every sampling point (Fig. 3). On the other hand, at the lowest HLR, the inert biofilter doubled the limit of discharge for COD at 20 cm and showed an average COD concentration of 105 ± 30 mg L−1 at 50 cm, surpassing the limit values of discharge frequently, revealing a lower removal efficiency in comparison with the EC-biofilter (Table 3). Concerning the higher HLR, the gravel biofilter never reached the limits at 50 cm from the inlet (Fig. 3).
| Biofilter Section | Electroconductive biofilter | Inert biofilter | |||||
|---|---|---|---|---|---|---|---|
| 280 mm d−1 | 560 mm d−1 | 1120 mm d−1 | 280 mm d−1 | 560 mm d−1 | 1120 mm d−1 | ||
| COD removal efficiency (%) | Inlet – 20 cm | 83 ± 9 | — | — | 57 ± 8 | — | — |
| Inlet – 50 cm | 94 ± 5 | 97 ± 4 | 82 ± 5 | 83 ± 6 | 87 ± 3 | 64 ± 5 | |
| Inlet – effluent | 96 ± 3 | 99 ± 1 | 97 ± 2 | 88 ± 4 | 96 ± 4 | 90 ± 4 | |
| NH4-N removal efficiency (%) | Inlet – 20 cm | 81 ± 6 | — | — | 51 ± 7 | — | — |
| Inlet – 50 cm | 95 ± 2 | 78 ± 4 | 70 ± 7 | 87 ± 2 | 54 ± 8 | 46 ± 4 | |
| Inlet – effluent | 97 ± 2 | 90 ± 3 | 81 ± 5 | 97 ± 1 | 86 ± 4 | 57 ± 7 | |
The results are consistent with previous studies about HSSF EC-biofilters operating under anaerobic conditions, in which a similar trend was observed when increasing the HLR.25 So, when the HLR was increased, the differences between the EC and the inert biofilters became apparent, with the EC-biofilter being the only one that fulfilled the discharge requirements.
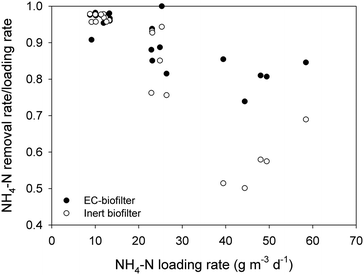
At a distance of 50 cm from the inlet, the EC-biofilter removed 95% of the ammonium at 280 mm d−1, resulting in an average concentration as low as 1.6 ± 0.2 mg NH4-N L−1 at that sampling point (Table 3). At the highest HLR, the removal efficiency decreased until 70%, while the inert biofilter only reached 46%. Not surprisingly, ammonium removal rates were not affected by the material nature at a low HLR (Fig. 4); however, at a high HLR, the material showed an impact and the EC-biofilter outperformed the inert biofilter by 1.5-fold in terms of ammonium removal.
It should be pointed out that, due to the aerobic nature of down-flow biofilters, nitrification processes were enhanced and ammonia can be converted to other forms of nitrogen, such as nitrite and nitrate. Furthermore, the concentration of nitrate at every sampling point was higher in the EC-biofilter than in the inert one (ESI† Fig. S1). Those data were well correlated with the amount of ammonium that was removed. As expected, the nitrate concentration decreased at higher HLR values, showing the impact of the nitrification process.
| COD | BOD5 | TN | NH4-N | TP | |
|---|---|---|---|---|---|
| Surface inlet load (g m−2 d−1) | 93 ± 11 | 51 ± 15 | 14.1 ± 1.6 | 11.8 ± 1.5 | 2.3 ± 0.3 |
| Volumetric inlet load (g m−3 d−1) | 120 ± 14 | 65 ± 12 | 18.2 ± 1.2 | 15.2 ± 1.9 | 2.9 ± 0.4 |
| Removal rates | |||||
|---|---|---|---|---|---|
| UF anaerobic biofilter | 109 ± 15 (90 ± 2) | 63 ± 12 (97 ± 1) | 4.1 ± 2.1 (23 ± 8) | 4.0 ± 2.2 (25 ± 9) | 1.3 ± 0.4 (45 ± 9) |
| DF aerobic biofilter | 115 ± 14 (96 ± 2) | 64 ± 12 (98 ± 2) | 6.7 ± 2.5 (37 ± 9) | 15.0 ± 1.4 (98 ± 1) | 2.3 ± 0.6 (76 ± 11) |
The BOD5 removal efficiency did not show significant statistical differences (p > 0.05) and it was very high in both biofilters; e.g. 98% (DF) and 97% (UF) (Table 4). This result implies that, at least under the loading rates tested, the UF EC-biofilter showed no limitation in electron acceptors (TEA) to degrade the pollutants because the impact of supplying oxygen in the DF EC-biofilter was negligible regarding the BOD5 removal rate. This seems counterintuitive but can be explained by the EC nature of the bed material capable of transfering electrons by itself from the anoxic bottom layers (reducing redox conditions) to the upper aerobic layers in the presence of atmospheric oxygen (oxidising redox conditions). This electrochemical configuration (the so-called snorkel)48 revealed how the EC nature of the material allows delocalization of two microbial phenomena that typically occur in the same cells: reduction of the electron acceptor (ca. oxygen) and generation of electrons from microbial metabolism. In this new redox scenario, oxygen may be a suitable electron acceptor to be reduced directly in contact with the EC material at the upper layers of the biofilter, instead of acting as a classical terminal electron acceptor in the respiratory chains of biofilm bacteria.
On top of COD removal, the key parameter in wastewater to fulfil the discharge legislation is the pollutant level in the treated wastewater. In this case, the DF EC-biofilter's effluent water had residual COD concentrations 2-fold lower than those obtained with the UF EC-biofilter and the BOD5 values were also much lower than the limits of discharge (ESI† Table S3). No significant statistical differences (p > 0.05) appeared regarding TSS (ESI† Table S3).
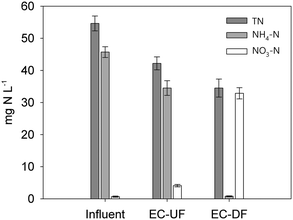
This low nitrification value is consistent with the anaerobic environment of the UF biofilter where oxygen-based nitrification is strongly limited. Regarding total nitrogen (TN) removal, our aerobic DF EC-biofilter (37% removal) also outperformed the anaerobic UF EC-biofilter (20%). This fact suggests either assimilation of nitrogen into biomass or, most probably, denitrifying activity at the inner layers of the biofilm enhanced by the EC material despite the presence of oxygen. Our DF EC-biofilter also performed more efficiently than plant-free VF CW51 by reaching a similar percentage (37–40%) of TN removal under a 3-fold higher TN loading rate (Table 4).
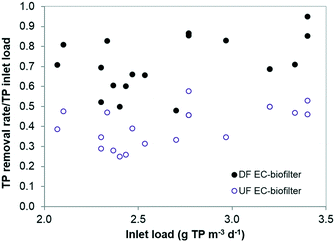
In terms of TP removal, the aerobic DF EC-biofilter exhibited the best removal efficiency (Fig. 6), with an average of 76% (Table 4) and occasional TP removal rates as high as 95%. TP removal in the DF EC-biofilter was twice the removal of the UF EC-biofilter. These results reveal that the impact of venting the EC material might have been shifting the redox state of the coke surface to a more oxidative potential. The specific aspects regarding surface oxidative potential and TP removal are currently under investigation.
![[thin space (1/6-em)]](https://www.rsc.org/images/entities/char_2009.gif) 049 raw reads that yielded a total of 38
049 raw reads that yielded a total of 38![[thin space (1/6-em)]](https://www.rsc.org/images/entities/char_2009.gif) 813 high quality sequences with an average length of 460 bp (Table S4†). Of the sequence reads, 0.86% was not classified. The rarefaction curves showed saturation, indicating that an appropriate number of sequence reads per sample were collected to disclose diversity at the sites (ESI† Fig. S2). Diversity indexes, such as observed OTUs and Chao1, were significantly higher in the UF EC-biofilter than in the DF one (ESI† Table S4). Good's coverage estimator denoted that the sizes of the libraries were enough to cover almost 100% of the bacterial communities. Shannon diversity indexes (H), which include information on both richness (the number of species present) and evenness (how the abundance of each species is distributed), were distinctly higher (6.26 and 7.54) than those reported in other studies using electrochemical setups integrated in CW treating urban wastewater and similar to the results of Aguirre-Sierra et al.25 (H: 6.27–7.47) and Lu et al.52 (H: 7.33–7.47). These results revealed a very high diversity in the EC-biofilters. Weighted Fast UniFrac analysis and correspondence analysis (CA) were used to identify the differences in the bacterial community structures based on their phylogenetic lineages. Constrained correspondence analysis showed that the adjusted explained variation was 79.3%.
813 high quality sequences with an average length of 460 bp (Table S4†). Of the sequence reads, 0.86% was not classified. The rarefaction curves showed saturation, indicating that an appropriate number of sequence reads per sample were collected to disclose diversity at the sites (ESI† Fig. S2). Diversity indexes, such as observed OTUs and Chao1, were significantly higher in the UF EC-biofilter than in the DF one (ESI† Table S4). Good's coverage estimator denoted that the sizes of the libraries were enough to cover almost 100% of the bacterial communities. Shannon diversity indexes (H), which include information on both richness (the number of species present) and evenness (how the abundance of each species is distributed), were distinctly higher (6.26 and 7.54) than those reported in other studies using electrochemical setups integrated in CW treating urban wastewater and similar to the results of Aguirre-Sierra et al.25 (H: 6.27–7.47) and Lu et al.52 (H: 7.33–7.47). These results revealed a very high diversity in the EC-biofilters. Weighted Fast UniFrac analysis and correspondence analysis (CA) were used to identify the differences in the bacterial community structures based on their phylogenetic lineages. Constrained correspondence analysis showed that the adjusted explained variation was 79.3%.
The classifiable sequences included members of 44 phyla of which the most abundant group was Proteobacteria (ESI† Fig. S3), ranging between 38% in the anaerobic UF EC-biofilter and 73% in the aerobic DF EC-biofilter. The Proteobacteria phylum includes a high level of bacterial metabolic diversity related to carbon, nitrogen, and sulphur cycling. They were also the most abundant group in previous studies about microbial ecology from constructed wetlands.53–55 The CA plot showed clear differences between communities of the aerobic DF and anaerobic UF EC-biofilters (ESI† Fig. S4).
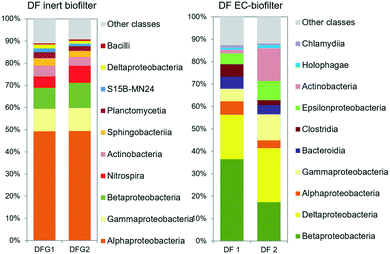
The analysis of the microbial communities revealed the presence of different taxonomic groups depending on the operation of the EC-biofilter. The results showed the presence of a high amount of Deltaproteobacteria (Fig. 7): 27–28% in the UF EC-biofilter and 20–24% in the DF EC-biofilter. Bacteria belonging to this class have been reported to associate with the electroactive biofilm from the very beginning56 as they share the capacity for generating ATP from very low value thermodynamic reactions.57,58 Within the class Deltaproteobacteria, bacteria from the genus Geobacter are capable of transferring electrons directly from acetate metabolism into EC materials,59 but they are also capable of acting as a redox plug transferring electrons from bacteria at the outermost layers of the biofilm into the EC material.60 Interestingly, Geobacter species were present in the UF EC-biofilter, ranging between 3.7 and 4.1% (ESI† Table S5). These species had been already detected in anaerobic EC-biofilters run under a horizontal subsurface flow.25 However, our current study revealed the presence of Geobacter bacteria in the DF EC-biofilter, representing 10% of the bacterial community (ESI† Table S6) despite being operated under aerobic conditions. This result is consistent with the fact that some Geobacter species are capable of respiring oxygen when this terminal electron acceptor (TEA) is supplied at low concentrations.61 Contrary to the general idea that Geobacter species are strictly anaerobic,62 years of work with this genus in our laboratory have demonstrated that Geobacter is capable of living in environments with oxygen concentrations in the range of 0–1 mg L−1 like the upper layer of constructed wetlands.25 Another electroactive genus like Geothrix was also detected in the DF EC-biofilter, although its abundance was lower than Geobacter's (ESI† Table S7).
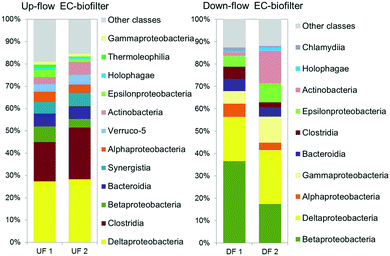 | ||
| Fig. 7 Relative abundance of OTUs at a class level (larger than 1% on average) in the upflow (UF) and downflow (DF) electroconductive biofilters fed with UWW. | ||
It is generally accepted that ammonium removal is difficult to be achieved in anaerobic systems, such as our UF EC-biofilter, since nitrifying reactions become limited by the absence of available electron acceptors. In contrast, vertical DF aerated biofilters should perform better in terms of nitrification, while denitrification should be limited. Nitrification is a two-step process, where ammonium in the presence of oxygen is first converted to nitrite by strictly chemolithotrophic Nitrosomonas, Nitrosococcus, and Nitrosospira bacteria, and then to nitrate by facultative chemolithotrophic bacteria Nitrospira and Nitrobacter.63 A deep insight into the bacterial community showed that Nitrospira and Nitrosomonadaceae families were not abundant in spite of the high nitrifying activity detected in the coke DF EC-biofilter. On the other hand, the analysis showed a high relative abundance of Thiobacillus in the DF EC-biofilter, ranging between 11 and 30%. In a previous study about nitrogen transforming bacteria in VSSF CW, Pelissari et al.64 reported that ammonia-oxidizing bacteria occurred only in the top layer (0–17 cm depth) of the wetland (8%), nitrite oxidizing bacteria were found to occur in top and intermediate layers (34–51 cm depth, 5%) and denitrifying bacteria were found in all layers. In this environment, Thiobacillus denitrificans was detected in the mid layer (34–51 cm depth, 2%) and the bottom layer (>51 cm, 10%) of the VF CW. In our DF EC-biofilter system, the granules were sampled at 40 cm depth, which can explain the small proportion of classical ammonium oxidizing species in comparison to Thiobacillus denitrificans. Novel nitrogen removal routes reported in wetland systems,65 include partial nitrification–denitrification reactions. This process includes conversion of ammonium to nitrite, followed by denitrification of nitrite to nitrogen gas. The advantage of partial nitrification and denitrification is a lower requirement for both oxygen (ca. 25%) and organic matter (40%), in contrast to traditional nitrification and denitrification metabolisms.66 The enhancement of nitrogen removal observed in the DF EC-biofilter suggests the activation of partial nitrification–denitrification reactions leading to N2 formation. Although this may seem counterintuitive due to inhibitory effect of oxygen on denitrification, the biofilm layer in the intimate contact with the EC material may preserve an anoxic environment. This was confirmed by the detection of Geobacter and Thiobacillus genus associated with the EC material in such aerobic DF EC-biofilters (ESI† Table S6). In fact, Geobacter bacteria has been reported to transfer electrons directly to Thiobacillus which in turn may reduce nitrate or nitrite to dinitrogen.67 This interspecies electron transfer might be enhanced in the presence of an EC material like coke in a similar manner reported elsewhere.68
Conclusions
Aerobic EC biofilters enhance the removal of organic matter compared to standard biofilters made of inert materials like gravel. More interestingly, such conditions enhance nitrification. Therefore, the downflow EC-biofilter has shown to be a suitable system to remove both COD and ammonium. Aerobic electroactive biofilters increase the amount of EAB such as Geobacter, even in the presence of oxygen, but also the presence of those bacteria reported to perform direct interspecies electron transfer (DIET) with Geobacter. The final scenario is a complex redox scenario capable of developing a unique electroactive community optimized to metabolize those pollutants present in wastewater outperforming classical biofilters used in constructed wetlands made of gravel.Conflicts of interest
There are no conflicts to declare.Acknowledgements
This research was supported by the projects AQUAELECTRA (http://www.aquaelectra.es) and SMART WETLAND (http://www.smartwetland.es) both funded by the Spanish Ministry of Economy and Innovation (MINECO) through the INNPACTO and RETOS DE LA SOCIEDAD programme. The PhD fellowship for Arantxa Aguirre-Sierra was funded by the Formación de Profesorado Universitario (FPU) programme of the University of Alcalá. This investigation has received funding from the European Union's Horizon 2020 research and innovation programme under the grant agreement No. 642190 (Project “iMETLAND”).References
- D. R. Lovley, Electromicrobiology, Annu. Rev. Microbiol., 2012, 66(1), 391–409, DOI:10.1146/annurev-micro-092611-150104.
- H. Liu, R. Ramnarayanan and B. E. Logan, Production of Electricity during Wastewater Treatment Using a Single Chamber Microbial Fuel Cell, Environ. Sci. Technol., 2004, 38(7), 2281–2285, DOI:10.1021/es034923g.
- P. Aelterman, K. Rabaey, P. Clauwaert and W. Verstraete, Microbial Fuel Cells for Wastewater Treatment, Water Sci. Technol., 2006, 54(8), 9 CrossRef CAS PubMed.
- R. D. Cusick, B. Bryan, D. S. Parker, M. D. Merrill, M. Mehanna, P. D. Kiely, G. Liu and B. E. Logan, Performance of a Pilot-Scale Continuous Flow Microbial Electrolysis Cell Fed Winery Wastewater, Appl. Microbiol. Biotechnol., 2011, 89(6), 2053–2063 CrossRef CAS PubMed.
- T. Ewing, P. T. Ha, J. T. Babauta, N. T. Tang, D. Heo and H. Beyenal, Scale-up of Sediment Microbial Fuel Cells, J. Power Sources, 2014, 272, 311–319, DOI:10.1016/j.jpowsour.2014.08.070.
- E. S. Heidrich, S. R. Edwards, J. Dolfing, S. E. Cotterill and T. P. Curtis, Performance of a Pilot Scale Microbial Electrolysis Cell Fed on Domestic Wastewater at Ambient Temperatures for a 12month Period, Bioresour. Technol., 2014, 173, 87–95, DOI:10.1016/j.biortech.2014.09.083.
- E. S. Heidrich, J. Dolfing, K. Scott, S. R. Edwards, C. Jones and T. P. Curtis, Production of Hydrogen from Domestic Wastewater in a Pilot-Scale Microbial Electrolysis Cell, Appl. Microbiol. Biotechnol., 2013, 97(15), 6979–6989 CrossRef CAS PubMed.
- J. A. Baeza, À. Martínez-Miró, J. Guerrero, Y. Ruiz and A. Guisasola, Bioelectrochemical Hydrogen Production from Urban Wastewater on a Pilot Scale, J. Power Sources, 2017, 356, 500–509, DOI:10.1016/j.jpowsour.2017.02.087.
- S. Puig, M. Serra, A. Vilar-Sanz, M. Cabré, L. Bañeras, J. Colprim and M. D. Balaguer, Autotrophic Nitrite Removal in the Cathode of Microbial Fuel Cells, Bioresour. Technol., 2011, 102(6), 4462–4467, DOI:10.1016/j.biortech.2010.12.100.
- S. Tejedor-Sanz, T. de Gregoris, J. J. Salas, L. Pastor and A. Esteve-Núñez, Integrating a Microbial Electrochemical System into a Classical Wastewater Treatment Configuration for Removing Nitrogen from Low COD Effluents, Environ. Sci.: Water Res. Technol., 2016, 2(5), 884–893, 10.1039/C6EW00100A.
- P. Clauwaert, K. Rabaey, P. Aelterman, L. De Schamphelaire, T. H. Pham, P. Boeckx, N. Boon and W. Verstraete, Biological Denitrification in Microbial Fuel Cells, Environ. Sci. Technol., 2007, 41(9), 3354–3360 CrossRef CAS PubMed.
- N. Pous, S. Puig, M. Dolors Balaguer and J. Colprim, Cathode Potential and Anode Electron Donor Evaluation for a Suitable Treatment of Nitrate-Contaminated Groundwater in Bioelectrochemical Systems, Chem. Eng. J., 2015, 263, 151–159, DOI:10.1016/j.cej.2014.11.002.
- M. Estevez-Canales, D. Pinto, T. Coradin, C. Laberty-Robert and A. Esteve-Núñez, Silica Immobilization of Geobacter Sulfurreducens for Constructing Ready-to-Use Artificial Bioelectrodes, Microb. Biotechnol., 2018, 11(1), 39–49 CrossRef CAS PubMed.
- O. Modin and B.-M. Wilén, A Novel Bioelectrochemical BOD Sensor Operating with Voltage Input, Water Res., 2012, 46(18), 6113–6120, DOI:10.1016/j.watres.2012.08.042.
- M. Di Lorenzo, T. P. Curtis, I. M. Head and K. Scott, A Single-Chamber Microbial Fuel Cell as a Biosensor for Wastewaters, Water Res., 2009, 43(13), 3145–3154, DOI:10.1016/j.watres.2009.01.005.
- M. Rodriguez Arredondo, P. Kuntke, A. W. Jeremiasse, T. H. J. A. Sleutels, C. J. N. Buisman and A. ter Heijne, Bioelectrochemical Systems for Nitrogen Removal and Recovery from Wastewater, Environ. Sci.: Water Res. Technol., 2015, 1(1), 22–33, 10.1039/C4EW00066H.
- M. Cerrillo, M. Viñas and A. Bonmatí, Removal of Volatile Fatty Acids and Ammonia Recovery from Unstable Anaerobic Digesters with a Microbial Electrolysis Cell, Bioresour. Technol., 2016, 219, 348–356 CrossRef CAS PubMed.
- G. Pozo, L. Jourdin, Y. Lu, P. Ledezma, J. Keller and S. Freguia, Methanobacterium Enables High Rate Electricity-Driven Autotrophic Sulfate Reduction, RSC Adv., 2015, 5(109), 89368–89374 RSC.
- P. Rodenas Motos, A. ter Heijne, R. van der Weijden, M. Saakes, C. J. N. Buisman and T. H. J. A. Sleutels, High Rate Copper and Energy Recovery in Microbial Fuel Cells, Front. Microbiol., 2015, 6, 527, DOI:10.3389/fmicb.2015.00527.
- A. Ter Heijne, F. Liu, R. van der Weijden, J. Weijma, C. J. N. Buisman and H. V. M. Hamelers, Copper Recovery Combined with Electricity Production in a Microbial Fuel Cell, Environ. Sci. Technol., 2010, 44(11), 4376–4381, DOI:10.1021/es100526g.
- F. Liu, A.-E. Rotaru, P. M. Shrestha, N. S. Malvankar, K. P. Nevin and D. R. Lovley, Promoting Direct Interspecies Electron Transfer with Activated Carbon, Energy Environ. Sci., 2012, 5(10), 8982–8989, 10.1039/C2EE22459C.
- C. Ramírez-Vargas, A. Prado, C. Arias, P. Carvalho, A. Esteve-Núñez and H. Brix, Microbial Electrochemical Technologies for Wastewater Treatment: Principles and Evolution from Microbial Fuel Cells to Bioelectrochemical-Based Constructed Wetlands, Water, 2018, 10(9), 1128, DOI:10.3390/w10091128.
- J. García, D. P. L. Rousseau, J. Morató, E. Lesage, V. Matamoros and J. M. Bayona, Contaminant Removal Processes in Subsurface-Flow Constructed Wetlands: A Review, Crit. Rev. Environ. Sci. Technol., 2010, 40(7), 561–661 CrossRef.
- P. Knowles, G. Dotro, J. Nivala and J. García, Clogging in Subsurface-Flow Treatment Wetlands: Occurrence and Contributing Factors, Ecol. Eng., 2011, 37(2), 99–112, DOI:10.1016/j.ecoleng.2010.08.005.
- A. Aguirre-Sierra, T. Bacchetti-De Gregoris, A. Berna, J. J. Salas, C. Aragon and A. Esteve-Núñez, Microbial Electrochemical Systems Outperform Fixed-Bed Biofilters in Cleaning up Urban Wastewater, Environ. Sci.: Water Res. Technol., 2016, 2(6), 984–993, 10.1039/C6EW00172F.
- C. A. Ramírez-Vargas, C. A. Arias, P. Carvalho, L. Zhang, A. Esteve-Núñez and H. Brix, Electroactive Biofilm-Based Constructed Wetland (EABB-CW): A Mesocosm-Scale Test of an Innovative Setup for Wastewater Treatment, Sci. Total Environ., 2019, 659, 796–806, DOI:10.1016/J.SCITOTENV.2018.12.432.
- A. Prado, R. Berenguer and A. Esteve-Núñez, Electroactive Biochar Outperforms Highly Conductive Carbon Materials for Biodegrading Pollutants by Enhancing Microbial Extracellular Electron Transfer, Carbon, 2019, 146, 597–609, DOI:10.1016/J.CARBON.2019.02.038.
- L. Doherty, Y. Zhao, X. Zhao and W. Wang, Nutrient and Organics Removal from Swine Slurry with Simultaneous Electricity Generation in an Alum Sludge-Based Constructed Wetland Incorporating Microbial Fuel Cell Technology, Chem. Eng. J., 2015, 266, 74–81, DOI:10.1016/j.cej.2014.12.063.
- C. Tang, Y. Zhao, C. Kang, Y. Yang, D. Morgan and L. Xu, Towards Concurrent Pollutants Removal and High Energy Harvesting in a Pilot-Scale CW-MFC: Insight into the Cathode Conditions and Electrodes Connection, Chem. Eng. J., 2019, 373, 150–160, DOI:10.1016/J.CEJ.2019.05.035.
- M. Hartl, D. F. Bedoya-Ríos, M. Fernández-Gatell, D. P. L. Rousseau, G. Du Laing, M. Garfí and J. Puigagut, Contaminants Removal and Bacterial Activity Enhancement along the Flow Path of Constructed Wetland Microbial Fuel Cells, Sci. Total Environ., 2019, 652, 1195–1208, DOI:10.1016/J.SCITOTENV.2018.10.234.
- A. Aguirre-Sierra, Integrating Microbial Electrochemical Technologies in Constructed Wetlands, a New Paradigm for Treating Wastewater in Small Communities, PhD Thesis, University of Alcala (Spain), 2017 Search PubMed.
- S. Larsen, L. P. Nielsen and A. Schramm, Cable Bacteria Associated with Long-Distance Electron Transport in New England Salt Marsh Sediment, Environ. Microbiol. Rep., 2015, 7(2), 175–179 CrossRef CAS PubMed.
- U. Marzocchi, D. Trojan, S. Larsen, R. Louise Meyer, N. Peter Revsbech, A. Schramm, L. Peter Nielsen and N. Risgaard-Petersen, Electric Coupling between Distant Nitrate Reduction and Sulfide Oxidation in Marine Sediment, ISME J., 2014, 8(8), 1682–1690, DOI:10.1038/ismej.2014.19.
- L. P. Nielsen, N. Risgaard-Petersen, H. Fossing, P. B. Christensen and M. Sayama, Electric Currents Couple Spatially Separated Biogeochemical Processes in Marine Sediment, Nature, 2010, 463(7284), 1071–1074, DOI:10.1038/nature08790.
- A. Pun, K. Boltes, P. Letón and A. Esteve-Nuñez, Detoxification of Wastewater Containing Pharmaceuticals Using Horizontal Flow Bioelectrochemical Filter, Bioresour. Technol. Rep., 2019, 7, 100296, DOI:10.1016/j.biteb.2019.100296.
- J. Vymazal, Constructed Wetlands for Wastewater Treatment, Water, 2010, 2(3), 530–549 CrossRef CAS.
- R. Kadlec and S. Wallace, Treatment Wetlands, Taylor & Francis Group, Boca Raton, FL, 2nd edn, 2009 Search PubMed.
- Directive 91/271/EEC of 21 May 1991, Concerning Urban Waste-Water Treatment. Official Journal L 135, 30/05/1991 P. 0040 - 0052, Official Journal of the European Communities, 1991, pp. 40–52 Search PubMed.
- APHA and AWWA, Standard Methods for the Examination of Water and Wastewater, American Public Health Association/American Water Works Association/Water Environmental Federation, Washington DC, 21st edn, 2005 Search PubMed.
- A. Klindworth, E. Pruesse, T. Schweer, J. Peplies, C. Quast, M. Horn and F. O. Glöckner, Evaluation of General 16S Ribosomal RNA Gene PCR Primers for Classical and Next-Generation Sequencing-Based Diversity Studies, Nucleic Acids Res., 2013, 41(1), e1, DOI:10.1093/nar/gks808.
- J. G. Caporaso, J. Kuczynski, J. Stombaugh, K. Bittinger, F. D. Bushman, E. K. Costello, N. Fierer, A. G. Peña, J. K. Goodrich, J. I. Gordon, G. A. Huttley, S. T. Kelley, D. Knights, J. E. Koenig, R. E. Ley, C. A. Lozupone, D. McDonald, B. D. Muegge, M. Pirrung, J. Reeder, J. R. Sevinsky, P. J. Turnbaugh, W. A. Walters, J. Widmann, T. Yatsunenko, J. Zaneveld and R. Knight, QIIME Allows Analysis of High-Throughput Community Sequencing Data, Nat. Methods, 2010, 7(5), 335–336, DOI:10.1038/nmeth.f.303.
- E. Aronesty, Ea-Utils : Command-Line Tools for Processing Biological Sequencing Data, Ea-Utils Command. Tools Process. Biol. Seq. Data, 2011, https://expressionanalysis.github.io/ea-utils/ Search PubMed.
- R. C. Edgar, Search and Clustering Orders of Magnitude Faster than BLAST, Bioinformatics, 2010, 26(19), 2460–2461, DOI:10.1093/bioinformatics/btq461.
- T. Z. DeSantis, P. Hugenholtz, N. Larsen, M. Rojas, E. L. Brodie, K. Keller, T. Huber, D. Dalevi, P. Hu and G. L. Andersen, Greengenes, a Chimera-Checked 16S RRNA Gene Database and Workbench Compatible with ARB, Appl. Environ. Microbiol., 2006, 72(7), 5069–5072, DOI:10.1128/AEM.03006-05.
- M. N. Price, P. S. Dehal and A. P. Arkin, FastTree 2--Approximately Maximum-Likelihood Trees for Large Alignments, PLoS One, 2010, 5(3), e9490, DOI:10.1371/journal.pone.0009490.
- N. A. Bokulich, S. Subramanian, J. J. Faith, D. Gevers, J. I. Gordon, R. Knight, D. A. Mills and J. G. Caporaso, Quality-Filtering Vastly Improves Diversity Estimates from Illumina Amplicon Sequencing, Nat. Methods, 2013, 10(1), 57–59, DOI:10.1038/nmeth.2276.
- J. A. Klappenbach, Rrndb: The Ribosomal RNA Operon Copy Number Database, Nucleic Acids Res., 2001, 29(1), 181–184, DOI:10.1093/nar/29.1.181.
- B. Erable, L. Etcheverry and A. Bergel, From Microbial Fuel Cell (MFC) to Microbial Electrochemical Snorkel (MES): Maximizing Chemical Oxygen Demand (COD) Removal from Wastewater, Biofouling, 2011, 27(3), 319–326 CrossRef CAS PubMed.
- C. Murphy, S. Wallace, R. Knight, D. Cooper and T. Sellers, Treatment Performance of an Aerated Constructed Wetland Treating Glycol from De-Icing Operations at a UK Airport, Ecol. Eng., 2015, 80, 117–124, DOI:10.1016/J.ECOLENG.2014.05.032.
- C. Ávila, M. Garfí and J. García, Three-Stage Hybrid Constructed Wetland System for Wastewater Treatment and Reuse in Warm Climate Regions, Ecol. Eng., 2013, 61, 43–49, DOI:10.1016/j.ecoleng.2013.09.048.
- Y. J. Zhao, B. Liu, W. G. Zhang, Y. Ouyang and S. Q. An, Performance of Pilot-Scale Vertical-Flow Constructed Wetlands in Responding to Variation in Influent C/N Ratios of Simulated Urban Sewage, Bioresour. Technol., 2010, 101(6), 1693–1700, DOI:10.1016/j.biortech.2009.10.002.
- L. Lu, D. Xing and Z. J. Ren, Microbial Community Structure Accompanied with Electricity Production in a Constructed Wetland Plant Microbial Fuel Cell, Bioresour. Technol., 2015, 195, 115–121 CrossRef CAS PubMed.
- P. Arroyo, L. E. Sáenz de Miera and G. Ansola, Influence of Environmental Variables on the Structure and Composition of Soil Bacterial Communities in Natural and Constructed Wetlands, Sci. Total Environ., 2015, 506–507, 380–390, DOI:10.1016/j.scitotenv.2014.11.039.
- G. Ansola, P. Arroyo and L. E. Sáenz de Miera, Characterisation of the Soil Bacterial Community Structure and Composition of Natural and Constructed Wetlands, Sci. Total Environ., 2014, 473–474, 63–71, DOI:10.1016/j.scitotenv.2013.11.125.
- B. Adrados, O. Sánchez, C. a. Arias, E. Becares, L. Garrido, J. Mas, H. Brix and J. Morató, Microbial Communities from Different Types of Natural Wastewater Treatment Systems: Vertical and Horizontal Flow Constructed Wetlands and Biofilters, Water Res., 2014, 55, 304–312 CrossRef CAS PubMed.
- S. Srikanth, E. Marsili, M. C. Flickinger and D. R. Bond, Electrochemical Characterization Of Geobacter Sulfurreducens Cells Immobilized on Graphite Paper Electrodes, Biotechnol. Bioeng., 2008, 99(5), 1065–1073, DOI:10.1002/bit.21671.
- M. J. McInerney, L. Rohlin, H. Mouttaki, U. Kim, R. S. Krupp, L. Rios-Hernandez, J. Sieber, C. G. Struchtemeyer, A. Bhattacharyya, J. W. Campbell and R. P. Gunsalus, The Genome of Syntrophus Aciditrophicus: Life at the Thermodynamic Limit of Microbial Growth, Proc. Natl. Acad. Sci. U. S. A., 2007, 104(18), 7600–7605, DOI:10.1073/pnas.0610456104.
- D. R. Lovley, D. E. Holmes and K. P. Nevin, Dissimilatory Fe(III) and Mn(IV) Reduction, Adv. Microb. Physiol., 2004, 49(04), 219–286, DOI:10.1016/S0065-2911(04)49005-5.
- Z. Borjas, J. Ortiz, A. Aldaz, J. Feliu and A. Esteve-Núñez, Strategies for Reducing the Start-up Operation of Microbial Electrochemical Treatments of Urban Wastewater, Energies, 2015, 8(12), 14064–14077, DOI:10.3390/en81212416.
- S. Tejedor-Sanz, P. Fernández-Labrador, S. Hart, C. I. Torres and A. Esteve-Núñez, Geobacter Dominates the Inner Layers of a Stratified Biofilm on a Fluidized Anode During Brewery Wastewater Treatment, Front. Microbiol., 2018, 9, 378, DOI:10.3389/fmicb.2018.00378.
- W. C. Lin, M. V. Coppi and D. R. Lovley, Geobacter Sulfurreducens Can Grow with Oxygen as a Terminal Electron Acceptor, Appl. Environ. Microbiol., 2004, 70(4), 2525–2528, DOI:10.1128/AEM.70.4.2525-2528.2004.
- C. Koch and F. Harnisch, Is There a Specific Ecological Niche for Electroactive Microorganisms?, ChemElectroChem, 2016, 3, 1–15, DOI:10.1002/celc.201600079.
- K. R. Reddy, W. H. Patrick and F. E. Broadbent, Nitrogen Transformations and Loss in Flooded Soils and Sediments, Crit. Rev. Environ. Control, 1984, 13(4), 273–309, DOI:10.1080/10643388409381709.
- C. Pelissari, C. Ávila, C. M. Trein, J. García, R. D. de Armas and P. H. Sezerino, Nitrogen Transforming Bacteria within a Full-Scale Partially Saturated Vertical Subsurface Flow Constructed Wetland Treating Urban Wastewater, Sci. Total Environ., 2017, 574, 390–399, DOI:10.1016/j.scitotenv.2016.08.207.
- T. Saeed and G. Sun, A Review on Nitrogen and Organics Removal Mechanisms in Subsurface Flow Constructed Wetlands: Dependency on Environmental Parameters, Operating Conditions and Supporting Media, J. Environ. Manage., 2012, 112, 429–448 CrossRef CAS PubMed , Academic Press.
- W. Jianlong and Y. Ning, Partial Nitrification under Limited Dissolved Oxygen Conditions, Process Biochem., 2004, 39(10), 1223–1229, DOI:10.1016/S0032-9592(03)00249-8.
- S. Kato, K. Hashimoto and K. Watanabe, Microbial Interspecies Electron Transfer via Electric Currents through Conductive Minerals, Proc. Natl. Acad. Sci. U. S. A., 2012, 109(25), 10042–10046, DOI:10.1073/pnas.1117592109.
- A.-E. Rotaru, P. M. Shrestha, F. Liu, B. Markovaite, S. Chen, K. P. Nevin and D. R. Lovley, Direct Interspecies Electron Transfer between Geobacter Metallireducens and Methanosarcina Barkeri, Appl. Environ. Microbiol., 2014, 80(15), 4599–4605, DOI:10.1128/AEM.00895-14.
- M. Dworkin, S. Falkow, E. Rosenberg, K.-H. Schleifer and E. Stackebrandt, The Prokaryotes. A Handbook on the Biology of Bacteria. Volume 5: Proteobacteria: Alpha and Beta Subclasses, ed. M. Dworkin, S. Falkow, E. Rosenberg, K.-H. Schleifer and E. Stackebrandt, Springer New York, New York, NY, 3rd edn, 2006, DOI:10.1007/0-387-30745-1.
Footnote |
| † Electronic supplementary information (ESI) available. See DOI: 10.1039/c9ew00696f |
| This journal is © The Royal Society of Chemistry 2020 |

