Potential roles of dietary flavonoids from Citrus aurantium L. var. amara Engl. in atherosclerosis development†
Chun-Yan
Shen
a,
Jia-Jun
Lin
a,
Jian-Guo
Jiang
 *a,
Tian-Xing
Wang
a and
Wei
Zhu
*b
aCollege of Food and Bioengineering, South China University of Technology, Guangzhou, 510640, China. E-mail: jgjiang@scut.edu.cn; Fax: +86-20-87113843; Tel: +86-20-87113849
bThe Second Affiliated Hospital, Guangzhou University of Chinese Medicine, Guangzhou 510120, China. E-mail: zhuwei9201@gzucm.edu.cn; Fax: +86-20-39318571; Tel: +86-20-39318571
First published on 26th November 2019
Abstract
Dietary consumption of flavonoids correlated positively with lower risk of cardiovascular disease. However, the precise roles of flavonoids from the blossoms of Citrus aurantium Linn variant amara Engl (CAVA) in atherosclerosis (AS) are still poorly understood. This study aimed to find novel flavonoid-type skeletons with protection against AS. Total flavonoids (CAVAF), homoeriodictyol (HE) and hesperetin-7-O-β-D-glucopyranoside (HG) were isolated from the blossoms of Citrus aurantium Linn variant amara Engl. by chromatography. Their suppressive effects on lipopolysaccharide (LPS)-induced inflammatory responses and ox-LDL-induced foam cell formation were systematically and comparatively investigated using macrophage RAW264.7 cells. HE was more powerful than HG in inhibiting LPS-induced production of nitric oxide (NO), interleukin-6 (IL-6), tumor necrosis factor-α (TNF-α), interleukin-1 beta (IL-1β) and gene expression in RAW264.7 cells. HE and HG showed different responses to extracellular signal-regulated kinases (ERK), c-Jun N-terminal kinases (JNK), P38, P65, IκBα, IκKα/β phosphorylation, and nuclear factor-kappa B (NF-κB) nuclear translocation. HE and HG also differentially decreased oxidized low-density lipoprotein (ox-LDL)-induced foam cell formation by regulating peroxisome proliferator-activated receptor-gamma (PPARγ), phospholipid ATP-binding cassette transporter A1 (ABCA1), phospholipid ATP-binding cassette transporter G1 (ABCG1), scavenger receptor class B type I (SRB1), scavenger receptor class A type I (SRA1) and cluster of differentiation 36 (CD36) expression at gene and protein levels in RAW264.7 cells. HG showed weaker potential than HE in preventing AS development. Their chemical differences might partially explain the discrepancy in their bioactivity. In conclusion, HE and HG might be developed into novel therapeutic agents against inflammation and AS-associated diseases.
1. Introduction
Atherosclerosis (AS), one of the leading causes of mortality and morbidity in Western countries, has been extensively studied recently. AS is a complex process which involves various factors. Specifically, emerging evidence has suggested the close relationship between AS and inflammation.1 Lots of antiatherogenic candidates acted through the regulation of inflammatory cytokines.2,3 In support, Wang et al. found that the flavonoid-rich extracts from Polygonum capitatum had potent anti-AS effects on hyperlipidemia rats by attenuating inflammatory responses and oxidative stress.4 Mao et al. also proved that flavonoids from the flowers of Helichrysum arenarium exerted anti-AS activities through inhibiting the expression of inflammation factors, including VEGF, CRP, JNK2, p38 and NO in LPS-triggered RAW264.7 cells.5 These facts suggested that the inhibition of LPS-induced inflammatory responses might represent a useful therapy for AS-associated diseases.Recently, much attention has been paid to natural products to develop novel therapeutic interventions for inflammation-related diseases.6,7 Flavonoids (C6–C3–C6), one of the most prevalent classes of phenolic compounds, are generally composed of two aromatic rings which are linked through three carbon atoms that form an oxygenated heterocycle. Flavonoids extracted from natural products have attracted great attention because of their well-characterized involvement in a wide range of beneficial effects, especially anti-inflammation8 and anti-AS.9 Flavonoids are divided into different subclasses based on their degree of unsaturation and the degree of oxidation of the C ring. Structural variations contributed much towards the observed differences in their pharmacological activities. For example, a published study reported that 5,7-methoxy groups might be responsible for the predominant anti-inflammatory effects of flavonoids.10
Our previous study demonstrated that the purified flavonoid (CAVAF) of Citrus aurantium L. var. amara Engl. (CAVA) is a superior antioxidant.11 In the current study, two flavonoid compounds including homoeriodictyol (HE) and hesperetin-7-O-β-D-glucopyranoside (HG) were extracted and identified from the blossoms of CAVA for the first time. By comparing their chemical structures, we found that HE and HG are the structural analogs of hesperetin, which has been extensively reported on due to its preventive effect against AS development.12,13 However, the precise roles of HE and HG in AS still remain unclear. Therefore, the present study was undertaken to find more novel flavonoid-type skeletons with protection against inflammation and AS, as well as to explore the underlying mechanism.
2. Materials and methods
2.1. Plant materials and reagents
CAVA was purchased from the Qingping traditional Chinese medicine market (Guangzhou, China). Oil Red O, 3-(4,5-dimethylthiazol-2-yl)-2,5-diphenyl tetrazolium bromide (MTT) and 25-[N-[(7-nitrobenz-2-oxa-1,3-diazol-4-yl)-methyl]amino]-27-norcholesterol (25-NBD cholesterol) were purchased from Sigma-Aldrich (St Louis, MO, USA). Human ox-LDL, Dil-ox-LDL (oxidized low-density lipoprotein, labeled with 1,1′-dioctadecyl-3,3,3′,3′-tetramethylindocarbocyanine perchlorate) and high-density lipoprotein (HDL) were purchased from Yiyuan Biotechnologies (Guangzhou, China).2.2. Extraction, isolation and purification
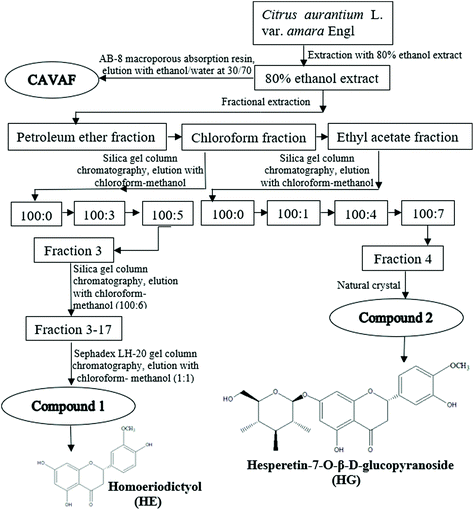
The blossoms of CAVA were mixed with 80% ethanol at a ratio of 10/1 (mL g−1) for 3 h at 100 °C. Subsequently, the mixture was filtered under vacuum and evaporated using a rotary evaporator to yield 80% ethanol extracts. Extraction of the residue was conducted twice more following the same procedure. All the 80% ethanol extracts were collected, followed by successive extraction three times with petroleum ether, chloroform and ethyl acetate. As indicated by thin-layer chromatography analysis, the chloroform fractions and ethyl acetate fractions contained a significant amount of flavonoids and therefore further purification was conducted following the method of Zhou et al. with minor modifications.14The schematic illustration of the isolation and purification procedure is shown in Fig. 1. The chloroform fractions were purified by using silica gel column chromatography by eluting chloroform/methanol at different gradients, yielding Fraction 3. Fraction 3 was further separated by silica gel column chromatography and eluted with chloroform/methanol at 100/6 (v/v), yielding subfraction Fractions 3–17. Fractions 3–17 were further chromatographed on a Sephadex LH-20 gel column with chloroform/methanol (1/1, v/v) as the mobile phase, to yield a novel white powder, compound 1. Ethyl acetate fractions were also subjected to silica gel column chromatography and eluted sequentially with stepwise solvent systems of chloroform/methanol, affording Fraction 4. Luckily, compound 2 was collected after the recrystallization of Fraction 4. Additionally, the flavonoid-rich fraction of CAVA (CAVAF) was also obtained in the current study based on our previous report.11
2.3. Macrophage culture
Murine macrophages RAW264.7, cultured in DMEM containing 10% fetal bovine serum, were obtained from the Cell Bank of Shanghai of Chinese Academy of Sciences. Macrophages between passages 4 and 7 were employed for subsequent research. When confluent, the cells were seeded into different kinds of plates and incubated overnight. Then, the cells were stimulated with lipopolysaccharide (LPS, 1 μg mL−1) or oxidized low-density lipoproteins (ox-LDL, 80 μg mL−1) with or without test samples at different concentrations. Test samples were initially dissolved in dimethyl sulfoxide (DMSO) and then diluted to various working concentrations with DMEM. The cells in the normal control group were incubated with culture medium with the same volume of DMSO added.2.4. Cytotoxicity
MTT assay was performed as previously described by Hendriks et al.15 Briefly, RAW264.7 cells were seeded into 96-well plates and stimulated with different test samples at indicated concentrations. After 24 h of incubation, the culture medium was discarded and DMSO was added to completely dissolve formazan crystals. Finally, the absorbance at 490 nm was determined using a microplate reader.2.5. Measurement of NO production
Nitric oxide (NO), playing a pivotal role in the inflammatory response, was evaluated based on our published report with minor modifications.16 Briefly, macrophages were plated into 24-well plates at a concentration of 2 × 10⁵ mL−1. After attachment, the cells were incubated with LPS with or without test samples. 24 h later, the culture medium was obtained and NO accumulation was determined using Griess reagents. Simultaneously, the cells were washed gently with phosphate buffered saline (PBS) and observed using an inverted microscope.2.6. Measurement of pro-inflammatory cytokines
After treatment, the culture medium was carefully collected and centrifuged at 2000g to yield the supernatant. Then, pro-inflammatory cytokines, including interleukin-6 (IL-6), tumor necrosis factor-α (TNF-α) and interleukin-1β (IL-1β), were investigated using the commercially available ELISA kits (Cusabio Biotech Co., Ltd, Wuhan, China).2.7. RT-qPCR
Total RNA was extracted using TRIzol reagents, according to the manufacturer's instructions. 3 μg of RNA was added as a template to reverse-transcriptase reactions carried out using cDNA synthesis kits (Roche). Then, RT-qPCR was further conducted with the resulting cDNAs in triplicate using the FastStart DNA Master SYBR Green I kit (Roche).17 The relative mRNA expression levels of all target genes were calculated by normalization with the GAPDH housekeeping gene. The sequences of all primers were synthesized by Invitrogen and are shown in the ESI Table S1.†2.8. Oil Red O staining
To detect foam cell formation, macrophages were cultured on cover slips in 6-well plates, administered with ox-LDL in the presence or absence of test samples, and then stained with Oil Red O solution, as described by Wang et al.18 During the experiment, the attached cells were fixed with 4% paraformaldehyde and washed with PBS.2.9. Measurement of cholesterol uptake and efflux
RAW264.7 cells were initially seeded into clear-bottom black plates and incubated overnight. Then, the culture medium was removed and the cells were labeled with 25-NBD cholesterol (5 μg mL−1) containing different concentrations of test samples for 24 h. The supernatant was removed and the cells were washed three times with PBS. To determine the cholesterol influx, the cells were collected using 0.1% Triton X-100 and the fluorescence intensity was determined immediately. Furthermore, macrophages were also administered with HDL to determine HDL-mediated cholesterol efflux from the cells into the culture medium.2.10. Western blot analysis
Western blot analyses were performed based on a published report.19 Total proteins were extracted by RIPA by lysis on ice for 40 min. Cytosol and nuclear proteins were extracted and isolated using the commercial Nuclear and Cytoplasmic Protein Extraction Kit. Thereafter, the resulting proteins were determined with the BCA method and were further separated on 10% (v/v) SDS-PAGE, transferred onto PVDF membranes, blocked with 5% BSA, incubated with primary and secondary antibodies. After each step, the blots were washed extensively with TBST three times. Eventually, the proteins were visualized using ECL reagents. The catalog numbers of all antibodies are provided in the ESI Table S2.†2.11. Statistics
All experimental data were expressed as mean ± standard deviation and were analysed using SPASS 20.0. A value of (*) p < 0.05 was considered statistically significant and a value of (**) p < 0.01 was considered highly statistically significant. All experiments were performed independently at least three times.3. Results
3.1. Identification of dietary flavonoids
Compound 1 was obtained as a white powder. The desired spots on silica gel plates (elution with chloroform/methanol at 100/13, v/v) showed light green fluorescence under 254 nm UV radiation after heating. 1H-NMR (600 MHz, DMSO-d6): δ 12.97 (1H, S, 5-OH), 10.41 (1H, S, 4,-OH), 7.07 (1H, d, J = 1.7, H-2′), 6.88 (1H, dd, J = 8.1, 1.7, H-6′), 6.77 (1H, d, J = 8.1, H-5′), 5.87 (1H, S, H-6), 5.87 (1H, S, H-8), 5.40 (1H, dd, J = 12.8, 2.8, H-2), 3.87 (3H, s, 3′-OCH3), 3.22 (1H, trans m, H-2), 2.66 (1H, cis dd, J = 17.1, 2.8, H-2). 13C-NMR (125 MHz, DMSO-d6) δ 196.3 (C-4), 166.6 (C-7), 163.3 (C-5), 162.8 (C-9), 147.4 (C-3′), 146.8 (C-4′), 129.2 (C-1′), 119.5 (C-6′), 115.0 (C-5′), 111.0 (C-2′), 101.6 (C-10), 94.8 (C-6,8), 78.6 (C-2), 55.5 (C-OCH3). The spectral data were similar to the presented data,20 suggesting that compound 1 was homoeriodictyol (HE) (Fig. 1).Compound 2 was obtained as a light yellow crystalline powder. EI-MS (m/z): 464 [M]+. 1H-NMR (DMSO, 400 MHz) δ 12.04 (1H, s, 5-OH), 9.12 (1H, s, 3′-OH), 5.51 (1H, dd, J = 12.2, 3.0 Hz, H-2), 2.74 (1H, dd, J = 17.4, 3.0 Hz, Haq-3), 3.42 (1H, dd, J = 17.4, 12.0 Hz, Heq-3), 6.15 (2H, d, J = 3.2 Hz, H-6, 8), 6.92 (1H, br s, H-2′), 6.92 (1H, d, J = 8.7 Hz, H-5′), 6.88 (1H, br d, J = 8.7 Hz, H-6′), 4.96 (1H, d, J = 7.2 Hz, Glc-H-1), 3.19 (1H, m, Glc-H-2), 3.35 (1H, m, Glc-H-3), 3.33 (1H, m, Glc-H-4), 3.41 (1H, m, Glc-H-5), 3.44 (1H, dd, J = 5.7, 10.4 Hz, Glc-Ha-2), 3.65 (1H, dd, J = 5.7, 10.4 Hz, Glc-Hb-2), 3.76 (3H, s, 4′-OCH3). 13C-NMR (DMSO, 100 MHz) δ 78.4 (C-2), 41.9 (C-3), 196.3 (C-4), 162.5 (C-5), 97.4 (C-6), 164.7 (C-7), 95.0 (C-8), 162.5 (C-9), 103.1 (C-10), 130.7 (C-1′), 113.9 (C-2′), 147.7 (C-3′), 145.9 (C-4′), 111.9 (C-5′), 117.3 (C-6′), 99.1 (C-1′′), 72.9 (C-2′′), 76.1 (C-3′′), 69.5 (C-4′′), 77.1 (C-5′′), 60.2 (C-6′′), 55.6 (4′-OCH3). Compound 2 was identified as hesperetin-7-O-β-D-glucopyranoside (HG) (Fig. 1), according to the published report.21
3.2. Effects on LPS-induced inflammatory responses
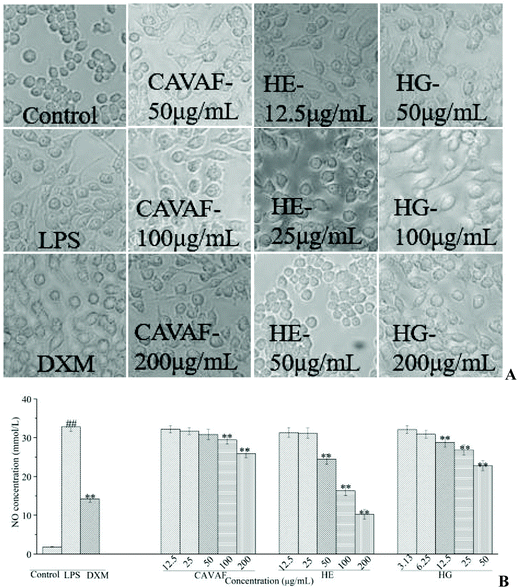
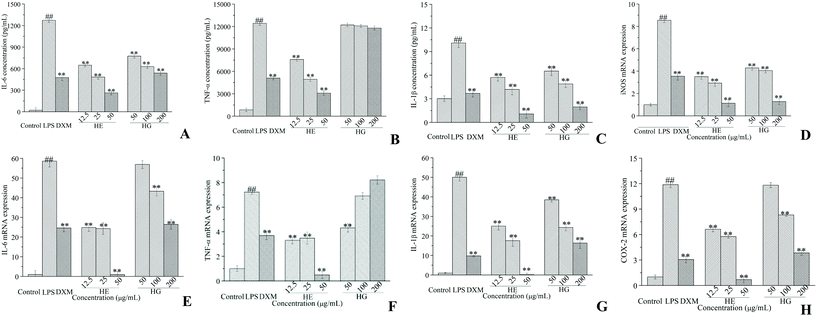
Based on the MTT assay, CAVAF, HE and HG showed no cytotoxicity on RAW264.7 cells at 200, 50 and 200 μg mL−1, respectively (data not shown). Thus, the maximum working concentrations of CAVAF, HE, and HG were determined to be 200, 50 and 200 μg mL−1, respectively. Exposure to LPS resulted in significant morphological changes (Fig. 2A). Macrophages largely increased in size and became irregular in shape when treated with LPS alone. However, these conditions were markedly reversed by co-treatment with different concentrations of CAVAF, HE and HG. Specifically, the cells treated with HE at 50 μg mL−1 showed similar morphology to untreated control cells. Simultaneously, CAVAF, HE and HG treatments at higher concentrations, all significantly inhibited NO accumulation in a strict dose-dependent manner (Fig. 2B). Consistent with the morphological changes, HE tended to show the highest inhibition ratio of NO production, followed by HG and CAVAF. Notably, the suppressive effect of HE on NO production reached 68.89%, much higher than that of the positive control DXM (56.85%).As expected, LPS intervention resulted in a significant increase of IL-6 (Fig. 3A) and IL-1β (Fig. 3C) accumulation. Nevertheless, these effects were potently attenuated by co-treatment with the different doses of HE and HG. The inhibition ratios of HE on TNF-α (Fig. 3B) production were determined to be 38.94%, 60.23% and 75.03%, respectively, while HG failed to exert any significant effect on TNF-α production. The treatment of macrophages with various concentrations of HE and HG for 24 h also dose-dependently suppressed LPS-triggered increase in inducible nitric oxide synthase (iNOS) (Fig. 3D), IL-6 (Fig. 3E), IL-1β (Fig. 3G) and cyclooxygenase-2 (COX-2) (Fig. 3H) expression at the transcriptional level. HE also potently inhibited the mRNA expression of TNF-α, with a nearly maximum inhibitory effect at 50 μg mL−1 (Fig. 3F). Unexpectedly, lower concentrations of HG were required to achieve an inhibitory effect on TNF-α mRNA expression.
3.3. Effects on LPS-induced MAPK phosphorylation and NF-κB activation
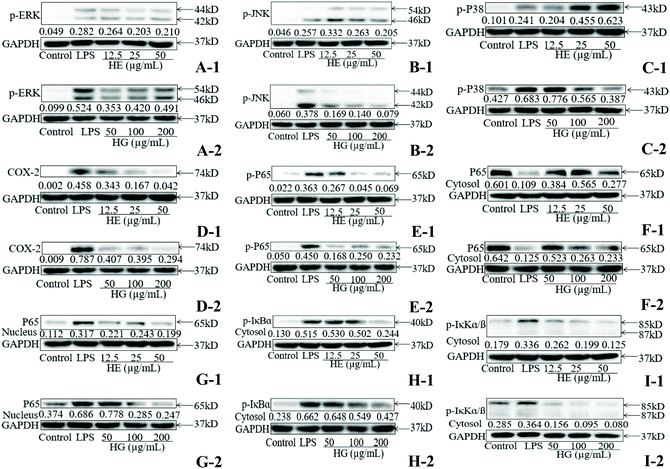
As determined by the western blot assay, exposure to LPS significantly increased the phosphorylation of extracellular signal-regulated kinases (ERK) (Fig. 4A), c-Jun N-terminal kinases (JNK) (Fig. 4B) and P38 (Fig. 4C). Nevertheless, the LPS-induced phosphorylation of ERK was marginally attenuated in HE-treated macrophages (Fig. 4A-1). HE treatment at 50 μg mL−1 also strongly reduced JNK phosphorylation (Fig. 4B-1). As for P38 phosphorylation, HE only exhibited inhibitory effects at 25 μg mL−1 (Fig. 4C-1). HG supplementation resulted in the enormous reduction of ERK (Fig. 4A-2) and JNK (Fig. 4B-2) phosphorylation and its efficacy was higher than that of HE. HG administration at 25 μg mL−1 and especially at 50 μg mL−1 also prominently mitigated P38 phosphorylation (Fig. 4C-2). The addition of HE (Fig. 4D-1) and HG (Fig. 4D-2) efficiently prevented LPS-induced COX-2 expression in macrophages.Further study indicated that both HE (Fig. 4E-1) and HG (Fig. 4E-2) administration caused a significant decrease in P65 phosphorylation. In parallel to the inhibitory effect on P65 phosphorylation, HE and HG also markedly inhibited cytosolic nuclear factor-kappa B (NF-κB) subunit p65 (Fig. 4F-1 and F-2) translocation to the nucleus (Fig. 4G-1 and G-2). IκBα (Fig. 4H-1 and H-2) and IκKα/β (Fig. 4I-1 and I-2) phosphorylation was also profoundly attenuated in a dose-dependent manner when the cells were treated with HE and HG. Taken together, these data demonstrated that both HE and HG caused a significant blockade of the NF-κB pathway, and HE was slightly more effective than HG in inhibiting NF-κB activation.
3.4. Effects on ox-LDL-induced foam cell formation
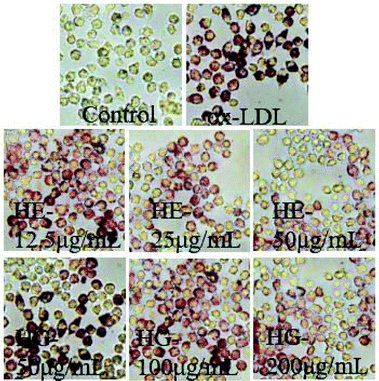
The regulatory effects of HE and HG on macrophage-deprived foam cells were initially determined by Oil Red O staining, a well-established method to detect lipid accumulation. These results demonstrated that ox-LDL administration not only enhanced lipid deposition in macrophages, but also significantly enlarged the cell surfaces (Fig. 5). However, exposure to HE and HG strikingly reversed this condition.3.5. Effects on ox-LDL-induced inflammation
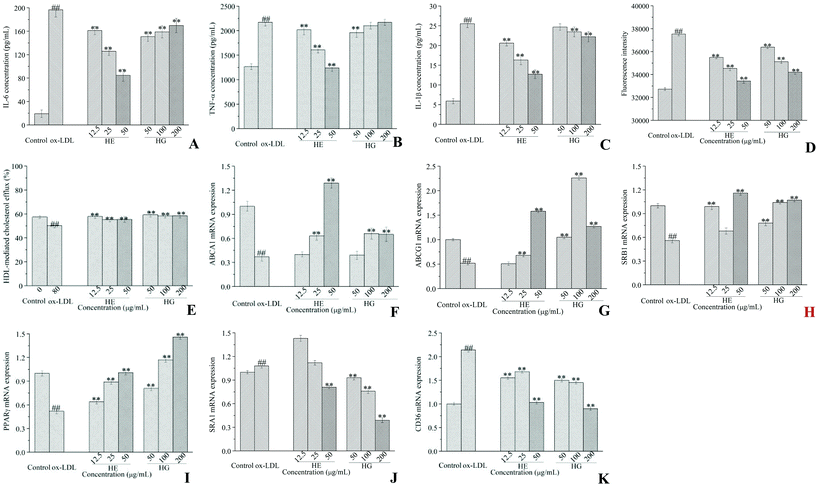
As shown, the production of IL-6 (Fig. 6A), TNF-α (Fig. 6B) and IL-1β (Fig. 6C) was markedly increased in ox-LDL-initiated cells, whereas HE administration dramatically reduced the secretion of all these pro-inflammatory cytokines in a strict dose-dependent manner. Although HG treatment significantly decreased IL-6 production, lower concentrations were more potent. HG administration at a minimum concentration of 50 μg mL−1 significantly decreased TNF-α production. HG application at higher concentrations of 100 and 200 μg mL−1 showed an inhibitory effect on IL-1β (Fig. 6C) accumulation. Of note, HE showed a much stronger inhibitory activity than HG in cytokine secretion.3.6. Effects on cholesterol homeostasis
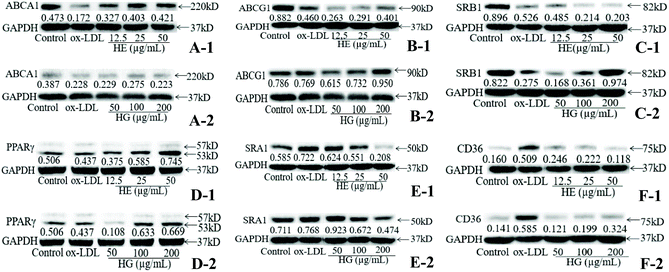
Macrophages supplemented with ox-LDL showed great ability for cholesterol internalization, compared with untreated control cells (Fig. 6D). However, HE and HG at various concentrations significantly and dose-dependently inhibited ox-LDL-initiated cholesterol uptake levels. HE was more powerful in inhibiting cholesterol uptake than HG. Further assay revealed that HE treatment significantly increased HDL-mediated cholesterol efflux (Fig. 6E). And this effect was further promoted when macrophages were treated with HG. Further study suggested that ox-LDL induction significantly suppressed phospholipid ATP-binding cassette transporter A1 (ABCA1) (Fig. 6F), phospholipid ATP-binding cassette transporter G1 (ABCG1) (Fig. 6G) and scavenger receptor class B type I (SRB1) (Fig. 6H) mRNA expression, while these conditions were partially restrained by HE and HG administration. We further investigated the effects of HE and HG on the mRNA expression of peroxisome proliferator-activated receptor-gamma (PPARγ), a classical gene which plays a critical role in lipid processing, disposal and removal. HE and especially HG exerted a profound stimulatory effect on PPARγ mRNA expression (Fig. 6I). ox-LDL-treated macrophages showed markedly increased mRNA expression levels of scavenger receptor class A type I (SRA1) (Fig. 6J) and cluster of differentiation 36 (CD36) (Fig. 6K), compared with the control cells. In contrast, the supplementation of HG at different concentrations remarkably reversed ox-LDL-induced SRA1 mRNA expression (Fig. 6J). HE application at 50 μg mL−1 also potently inhibited SRA1 mRNA expression, while HE treatment at 12.5 and 25 μg mL−1 did not show inhibitory effects but enhanced SRA1 mRNA expression. Notably, both HE and HG stimulation substantially suppressed CD36 expression at the transcriptional level (Fig. 6K).To further explore the underlying molecular mechanism, western blot analysis was conducted. Our data provided compelling evidence suggesting that HE and HG treatments differentially regulated ABCA1, ABCG1, SRB1, PPARγ, CD36 and SRA1 protein expression. Briefly, HE administration significantly enhanced ABCA1 (Fig. 7A-1) and PPARγ (Fig. 7D-1) protein expression, but had no apparent effects on ABCG1 (Fig. 7B-1) and SRB1 (Fig. 7C-1) protein expression. The ox-LDL-induced reduction of ABCA1 (Fig. 7A-2) protein expression was remarkably enhanced by HG treatment at 12.5 and 25 μg mL−1. HG administration at 200 μg mL−1 potently enhanced ABCG1 protein expression (Fig. 7B-2). SRB1 protein expression was markedly increased to 0.974 by the application of HG at 200 μg mL−1, much higher than that of untreated control cells (0.882) (Fig. 7C-2). Additionally, high levels of SRA1 (Fig. 7E-1 and E-2) and CD36 (Fig. 7F-1 and F-2) protein expression were observed in ox-LDL-stimulated cells; however, treatment with HE and HG showed an inhibitory effect on these proteins.
4. Discussion
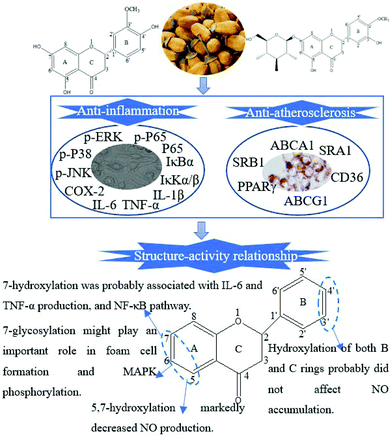
Flavonoids, abundant in citrus fruits, have been extensively reported due to their chemical diversity and prominent pharmacological activities.22 Their structure–activity relationship was also evidenced by numerous studies.23 In the current research, HE and HG were extracted and identified from the blossoms of CAVA. HE with 5, 7 and 4′-hydroxylations was isomeric with hesperetin. HG differed from HE at positions 7′, 3′ and 4′. Numerous studies have been sufficiently performed to confirm the role of hesperetin in AS-related diseases.24,25 However, few studies were involved in the anti-AS activities of HE and HG. Herein, we selected HE and HG for subsequent study.A published study demonstrated that the anti-inflammatory activities of dietary flavonoids were mainly dependent on the hydroxyl substitutions of the A-ring and 2,3-double bond and the 4-keto group of the C-ring, regardless of the substituent of the B-ring.26 Taubert et al. further demonstrated that the hydroxylation of both B and C rings did not affect NO accumulation.27 A hydroxyl group at the 5-position in the A-ring was reported to play a determinant role in NO inhibitory activity.28 Taken together, we speculated that flavanones with more hydroxyl groups of the A-ring were more powerful in inhibiting NO production. Consistently, in the current research, both HE and HG significantly attenuated LPS-induced NO production. HE showed the highest NO inhibition ratio, followed by HG and CAVAF. HE was more powerful than HG in inhibiting LPS-induced IL-6 and especially TNF-α accumulation, indicating that the absence of the hydroxyl group at 7 might partially abolish the efficacy of HG (Fig. 8). HE and HG also showed different regulations on LPS-induced MAPK and NF-κB pathways. HG appeared to be more active in blocking MAPK phosphorylation, whereas HE might exert a more substantial effect on the NF-κB pathway.
Dietary consumption of flavonoids correlated positively with lower risk of cardiovascular disease.29 Therefore, we also investigated and compared the effects of HE and HG on ox-LDL-induced foam cell formation. HE and HG showed a striking discrepancy in inhibiting ox-LDL-induced IL-6, TNF-α and IL-1β secretion. Then, we focused on the proteins of ABCA1, ABCG1, PPARγ, SRA1 and CD36 because of their well-characterized involvement in cholesterol homeostasis. HE was more effective in promoting ABCA1 expression, whereas HG was a more superior regulator of ABCG1 and SRB1 expression. We next tested their effects on PPARγ expression, which operated as the cholesterol sensor by promoting ABCA1, ABCG1 and SRB1 expression. For example, Ma et al. found that propofol treatment significantly inhibited ox-LDL-induced foam cell formation in human THP-1 macrophages by stimulating the PPARγ-LXRα-ABCA1/ABCG1/SRB1 pathway.30 Our results suggested that both HE and HG significantly increased PPARγ protein expression, with the former being more efficient. Moreover, we found that HE and HG showed comparable potency on SRA1 and CD36 expression. However, the inhibitory effect of HE on ox-LDL uptake and cholesterol influx was superior to that of HG. Taken together, HG showed weaker potential than HE in preventing AS development. One persuading reason might be that HG contained a glycosyl group at A-7, which increased its molecular weight and made it difficult for absorption.31
In conclusion, all these findings together provided strong evidence that HE and HG showed differential effects on LPS-induced inflammatory responses and ox-LDL-induced foam cell formation. The discrepancy in bioactivity was most likely due to their structural differences, such as the number and position of hydroxyl groups, as well as the sugar substitution.
Abbreviations
| AS | Atherosclerosis |
| LPS | Lipopolysaccharide |
| ox-LDL | Oxidized low-density lipoproteins |
| CD36 | Cluster of differentiation 36 |
| ABCA1 | Phospholipid ATP-binding cassette transporter A1 |
| CAVA | Citrus aurantium Linn variant amara Engl |
| HE | Homoeriodictyol |
| HG | Hesperetin-7-O-β-D-glucopyranoside |
| 25-NBD cholesterol | 25-[N-[(7-Nitrobenz-2-oxa-1,3-diazol-4-yl)-methyl]amino]-27-norcholesterol |
| HDL | High-density lipoprotein |
| ABCG1 | Phospholipid ATP-binding cassette transporter G1 |
| PBS | Phosphate buffered saline |
| SRB1 | Scavenger receptor class B type I |
| SRA1 | Scavenger receptor class A type I |
| LPS | Lipopolysaccharide |
| NO | Nitric oxide |
| iNOS | Inducible nitric oxide synthase |
| IL-6 | Interleukin-6 |
| TNF-α | Tumor necrosis factor-α |
| IL-1β | Interleukin-1 beta |
| COX-2 | Cyclooxygenase-2 |
| ERK | Extracellular signal-regulated kinase |
| JNK | c-Jun N-terminal kinase |
| MAPK | Mitogen-activated protein kinase |
| NF-κB | Nuclear factor-kappa B |
| PPARγ | Peroxisome proliferator-activated receptor-gamma |
Author contributions
CY, JJ and TX performed the experimental work and data analysis. CY and JG drafted the paper. CY, JG and W revised the paper. All authors read and approved the final version.Conflicts of interest
The authors declare no conflicts of interest.Acknowledgements
The authors gratefully acknowledge the financial support from the Science and Technology Project of Guangzhou City (201604020150), the Science and Technology Planning Project of Guangdong Province (2017B030314166), the Guangdong Provincial Hospital of Chinese Medicine Science and Technology Research Program (YN2019MJ11).References
- H. N. Siti, Y. Kamisah and J. Kamsiah, The role of oxidative stress, antioxidants and vascular inflammation in cardiovascular disease (a review), Vasc. Pharmacol., 2015, 71, 40–56 CrossRef CAS PubMed.
- F. Y. Chen, J. Zhou, N. Guo, W. G. Ma, X. Huang, H. Wang and Z. Y. Yuan, Curcumin retunes cholesterol transport homeostasis and inflammation response in M1 macrophage to prevent atherosclerosis, Biochem. Biophys. Res. Commun., 2015, 467, 872–878 CrossRef CAS PubMed.
- Y. Zhou, R. Chen, D. Liu, C. M. Wu, P. Guo and W. H. Lin, Asperlin inhibits LPS-evoked foam cell formation and prevents atherosclerosis in ApoE(-/-) mice, Mar. Drugs, 2017, 15, 358 CrossRef PubMed.
- Z. Wang and X. Jiang, Flavonoid-rich extract of Polygonum capitatum attenuates high-fat diet-induced atherosclerosis development and inflammatory and oxidative stress in hyperlipidemia rats, Eur. J. Inflammation, 2018, 16, UNSP 2058739218772710 Search PubMed.
- Z. H. Mao, C. L. Gan, J. X. Zhu, N. Ma, L. J. Wu, L. B. Wang and X. B. Wang, Anti-atherosclerotic activities of flavonoids from the flowers of Helichrysum arenarium L. MOENCH through the pathway of anti-inflammation, Bioorg. Med. Chem. Lett., 2017, 27, 2812–2817 CrossRef CAS PubMed.
- C. Y. Shen, J. G. Jiang, L. Yang, D. W. Wang and W. Zhu, Anti-ageing active ingredients from herbs and nutraceuticals used in traditional Chinese medicine: pharmacological mechanisms and implications for drug discovery, Br. J. Pharmacol., 2017, 174, 1395–1425 CrossRef CAS PubMed.
- J. G. Jiang, X. J. Huang, J. Chen and Q. S. Lin, Comparison of the sedative and hypnotic effects of flavonoids, saponins, and polysaccharides extracted from Semen Ziziphus jujube, Nat. Prod. Res., 2007, 21, 310–320 CrossRef CAS PubMed.
- T. Hu, X. W. He, J. G. Jiang and X. L. Xu, Hydroxytyrosol and its potential therapeutic effects, J. Agric. Food Chem., 2014, 62, 1449–1455 CrossRef CAS.
- A. Basu, A. S. Das, M. Majumder and R. Mukhopadhyay, Antiatherogenic roles of dietary flavonoids chrysin, quercetin, and luteolin, J. Cardiovasc. Pharmacol., 2016, 68, 89–96 CrossRef CAS.
- H. Celik and M. Kosar, Inhibitory effects of dietary flavonoids on purified hepatic NADH-cytochrome b5 reductase: Structure-activity relationships, Chem.-Biol. Interact., 2012, 197, 103–109 CrossRef CAS PubMed.
- C. Y. Shen, T. X. Wang, X. M. Zhang and J. G. Jiang, Various antioxidant effects were attributed to different components in the dried blossoms of Citrus aurantium L. var. amara Engl, J. Agric. Food Chem., 2017, 65, 6087–6092 CrossRef CAS PubMed.
- J. S. Choi, Y. J. Choi, S. Y. Shin, J. Li, S. W. Kang, J. Y. Bae, D. S. Kim, G. E. Ji, J. S. Kang and Y. H. Kang, Dietary flavonoids differentially reduce oxidized LDL-induced apoptosis in human endothelial cells: Role of MAPK- and JAK/STAT-signaling, J. Nutr., 2008, 138, 983–990 CrossRef CAS PubMed.
- S. C. Whitman, E. M. Kurowska, J. A. Manthey and A. Daugherty, Nobiletin, a citrus flavonoid isolated from tangerines, selectively inhibits class A scavenger receptor-mediated metabolism of acetylated LDL by mouse macrophages, Atherosclerosis, 2005, 178, 25–32 CrossRef CAS PubMed.
- Z. L. Zhou, W. Q. Yin, X. P. Zou, D. Y. Huang, C. L. Zhou, L. M. Li, K. C. Chen, Z. Y. Guo and S. Q. Lin, Flavonoid Glycosides and Potential Antivirus Activity of Isolated Compounds from the Leaves of Eucalyptus citriodora, J. Korean Soc. Appl. Biol. Chem., 2014, 57, 813–817 CrossRef CAS.
- J. J. A. Hendriks, H. E. de Vries, S. M. A. van der Pol, T. K. van den Berg, E. A. F. van Tol and C. D. Dijkstra, Flavonoids inhibit myelin phagocytosis by macrophages; a structure-activity relationship study, Biochem. Pharmacol., 2003, 65, 877–885 CrossRef CAS PubMed.
- C. Y. Shen, J. G. Jiang, M. Q. Li, C. Y. Zheng and W. Zhu, Structural characterization and immunomodulatory activity of novel polysaccharides from Citrus aurantium Linn. variant amara Engl, J. Funct. Foods, 2017, 35, 352–362 CrossRef CAS.
- C. Y. Shen, W. L. Zhang and J. G. Jiang, Immune-enhancing activity of polysaccharides from Hibiscus sabdariffa Linn. via MAPK and NF-kappa B signaling pathways in RAW264.7 cells, J. Funct. Foods, 2017, 34, 118–129 CrossRef CAS.
- Y. Wang, X. Zhao, H. Jin, H. Wei, W. Li, D. Bu, X. Tang, Y. Ren, C. Tang and J. Du, Role of Hydrogen Sulfide in the Development of Atherosclerotic Lesions in Apolipoprotein E Knockout Mice, Arterioscler., Thromb., Vasc. Biol., 2009, 29, 173–U171 CrossRef CAS PubMed.
- H. K. Kim, B. S. Cheon, Y. H. Kim, S. Y. Kim and H. P. Kim, Effects of naturally occurring flavonoids on nitric oxide production in the macrophage cell line RAW 264.7 and their structure-activity relationships, Biochem. Pharmacol., 1999, 58, 759–765 CrossRef CAS PubMed.
- A. R. S. Ibrahim, A. M. Galal, M. S. Ahmed and G. S. Mossa, O-demethylation and sulfation of 7-methoxylated flavanones by Cunninghamella elegans, Chem. Pharm. Bull., 2003, 51, 203–206 CrossRef.
- Y. H. Jiang, D. Q. Jiang, P. F. Wang, X. Wang and Z. B. Yu, Flavonoids of Fructus aurantii processed using the Zhangband system, Biomed. Res., 2017, 28, 4386–4389 CAS.
- L. Yang, J. G. Jiang, W. F. Li, J. Chen, D. Y. Wang and L. Zhu, Optimum extraction process of polyphenols from the bark of Phyllanthus emblica L. based on the response surface methodology, J. Sep. Sci., 2009, 32, 1437–1444 CrossRef CAS PubMed.
- J. H. G. Lago, A. C. Toledo-Arruda, M. Mernak, K. H. Barrosa, M. A. Martins, I. F. L. C. Tiberio and C. M. Prado, Structure-activity association of flavonoids in lung diseases, Molecules, 2014, 19, 3570–3595 CrossRef PubMed.
- N. A. Bawazeer, H. Choudhry, M. A. Zamzami, W. H. Abdulaal, B. Middleton and S. S. Moselhy, Role of hesperetin in LDL-receptor expression in hepatoma HepG2 cells, BMC Complementary Altern. Med., 2016, 16, 182 CrossRef PubMed.
- A. Iio, K. Ohguchi, M. Iinuma, Y. Nozawa and M. Ito, Hesperetin upregulates ABCA1 expression and promotes cholesterol efflux from THP-1 macrophages, J. Nat. Prod., 2012, 75, 563–566 CrossRef CAS PubMed.
- S. B. Lotito and B. Frei, Dietary flavonoids attenuate tumor necrosis factor alpha-induced adhesion molecule expression in human aortic endothelial cells - Structure-function relationships and activity after first pass metabolism, J. Biol. Chem., 2006, 281, 37102–37110 CrossRef CAS PubMed.
- D. Taubert, R. Berkels, W. Klaus and R. Roesen, Nitric oxide formation and corresponding relaxation of porcine coronary arteries induced by plant phenols: Essential structural features, J. Cardiovasc. Pharmacol., 2002, 40, 701–713 CrossRef CAS PubMed.
- W. J. Jiang, A. Daikonya, M. Ohkawara, T. Nemoto, R. Noritake, T. Takamiya, S. Kitanaka and H. Iijima, Structure-activity relationship of the inhibitory effects of flavonoids on nitric oxide production in RAW264.7 cells, Bioorg. Med. Chem., 2017, 25, 779–788 CrossRef CAS.
- S. Haseeb, B. Alexander and A. Baranchuk, Wine and cardiovascular health a comprehensive review, Circulation, 2017, 136, 1434–1448 CrossRef CAS PubMed.
- X. Ma, S. F. Li, Z. S. Qin, J. Ye, Z. L. Zhao, H. H. Fang, Z. W. Yao, M. N. Gu and Y. W. Hu, Propofol up-regulates expression of ABCA1, ABCG1, and SR-B1 through the PPAR gamma/LXR alpha signaling pathway in THP-1 macrophage-derived foam cells, Cardiovasc. Pathol., 2015, 24, 230–235 CrossRef CAS PubMed.
- Z. Mao, C. Gan, J. Zhu, N. Ma, L. Wu, L. Wang and X. Wang, Anti-atherosclerotic activities of flavonoids from the flowers of Helichrysum arenarium L. MOENCH through the pathway of anti-inflammation, Bioorg. Med. Chem. Lett., 2017, 27, 2812–2817 CrossRef CAS PubMed.
Footnote |
| † Electronic supplementary information (ESI) available. See DOI: 10.1039/c9fo02336d |
| This journal is © The Royal Society of Chemistry 2020 |

